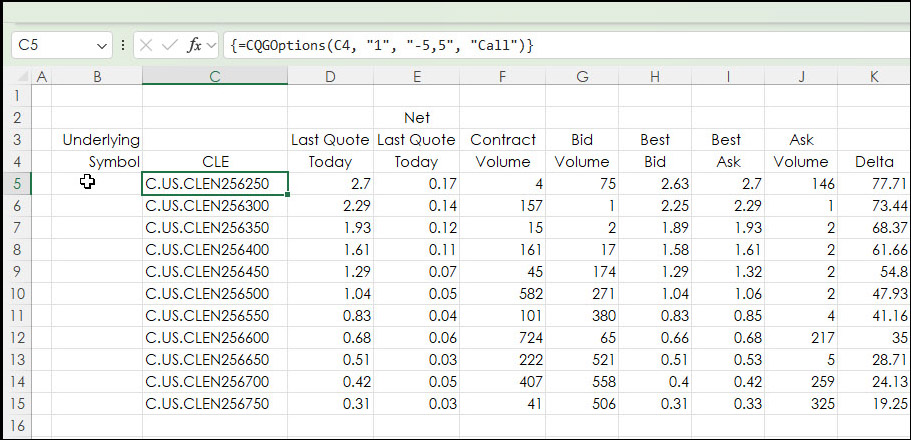
This post walks the reader through building option chains in Excel. The CQG RTD Toolkit offers this functionality, however, the same feature can be implemented using Excel's CONCATENATE function.… more
Excel
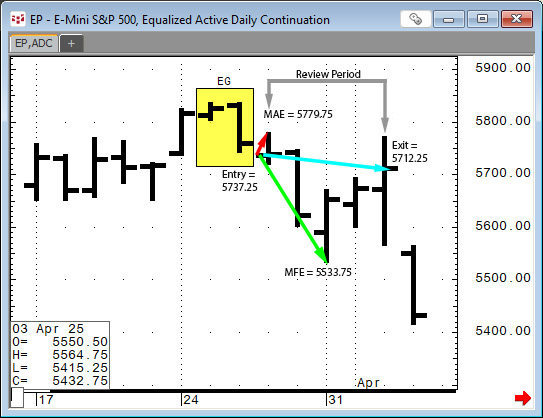
This post provides a guideline to reviewing the outcomes of a pattern recognition approach to the markets.
Two recent posts on Workspaces discussed CQG's Candlestick Formations Study.
… more
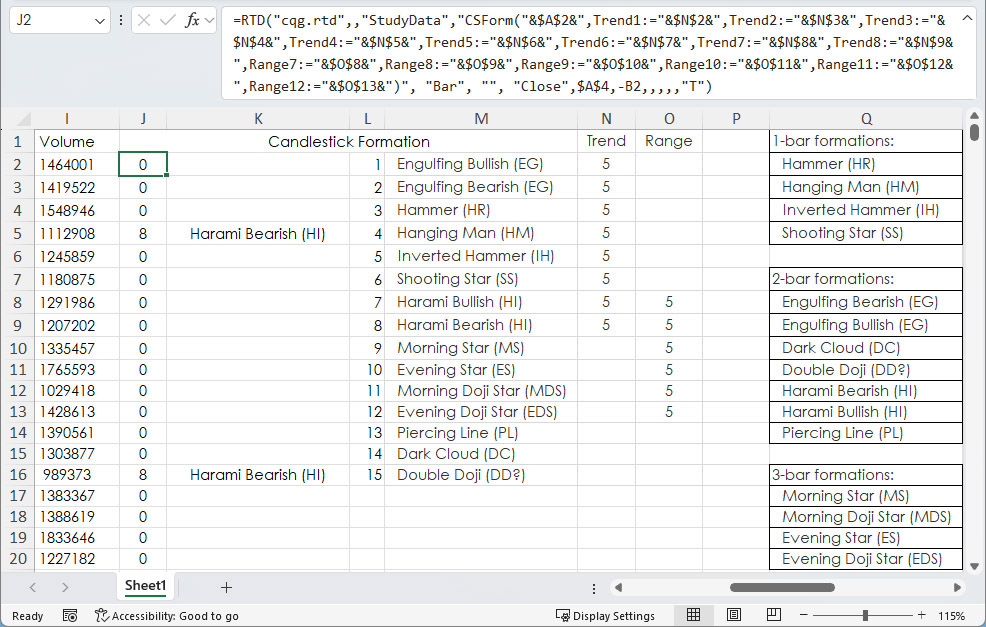
A recent post "CQG Primer: Candlesticks Formations Study" introduced this study available in CQG IC and QTrader. The study is a collection of fifteen conditions. The Candlestick formations appear… more
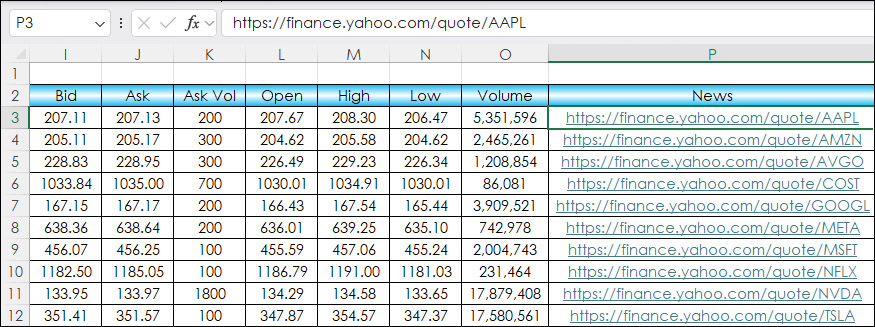
This post details adding HTML News Links to an Excel dashboard for monitoring equities and ETFs.
The news source is Finance.Yahoo.com. An example link for Microsoft is https://finance.yahoo.… more
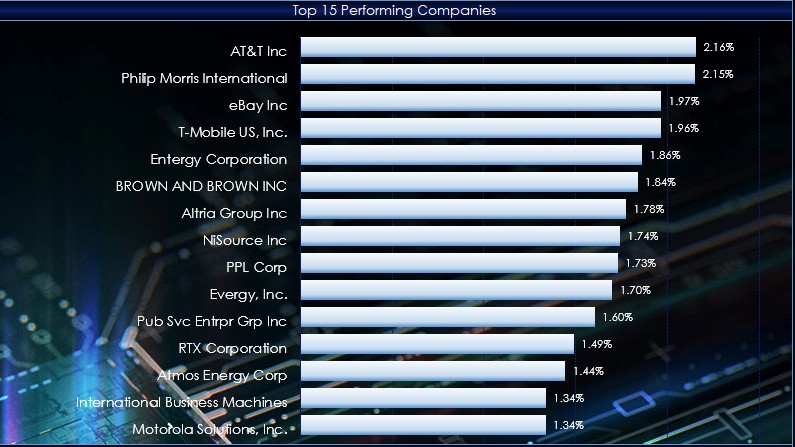
This macro-enabled Microsoft Excel® spreadsheet tracks the holdings of the Invesco S&P 500® Momentum ETF (SPMO). The ETF is based on the S&P 500 Momentum Index (Index).
Recently… more
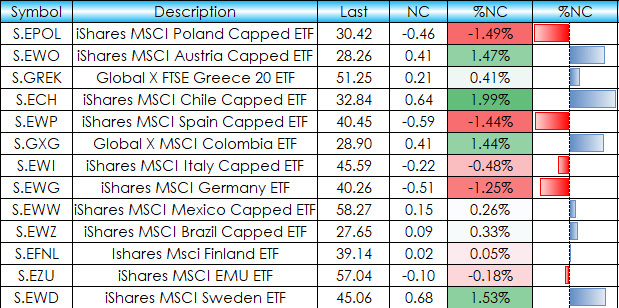
This post details an Excel dashboard tracking Country Equity ETFs performance. The dashboard ranks and sorts the Country ETFs traded using the NYSE American enablement. Fifty-one ETFs are tracked… more
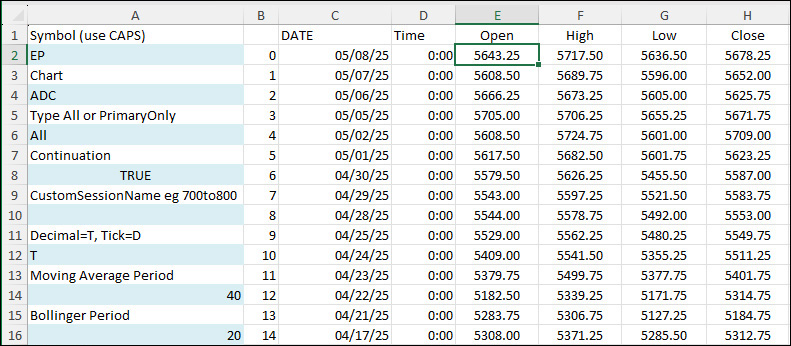
This post offers a downloadable sample Excel spreadsheet for pulling in historical data and study values from CQG IC or QTrader using RTD formulas.
The Data consists of:
Open, High, Low,… more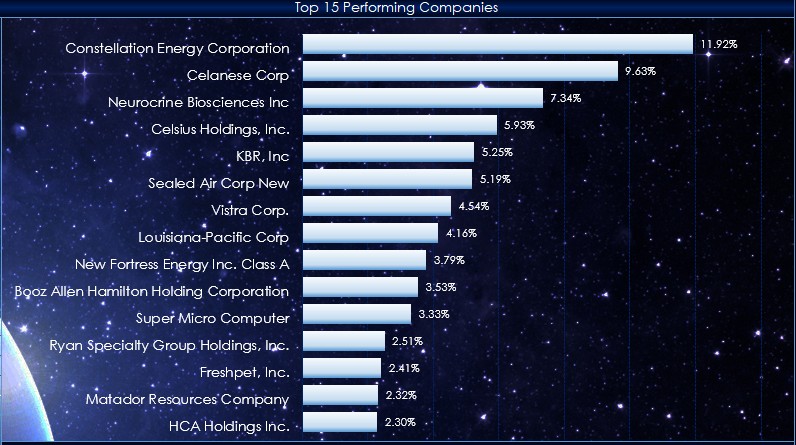
This macro-enabled Microsoft Excel® spreadsheet tracks the holdings of the iShares Russell 1000 Growth ETF (symbol: IWF). The iShares Russell 1000 Growth ETF seeks to track the investment results… more
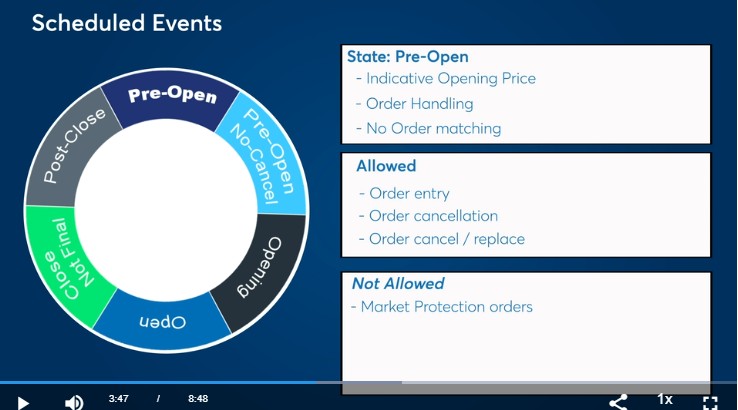
Various Exchanges offer market data detailing the current state of a market. This includes the CME Group, the Intercontinental Exchange (ICE), CBOE Futures Exchange (CFE), and others.
For… more
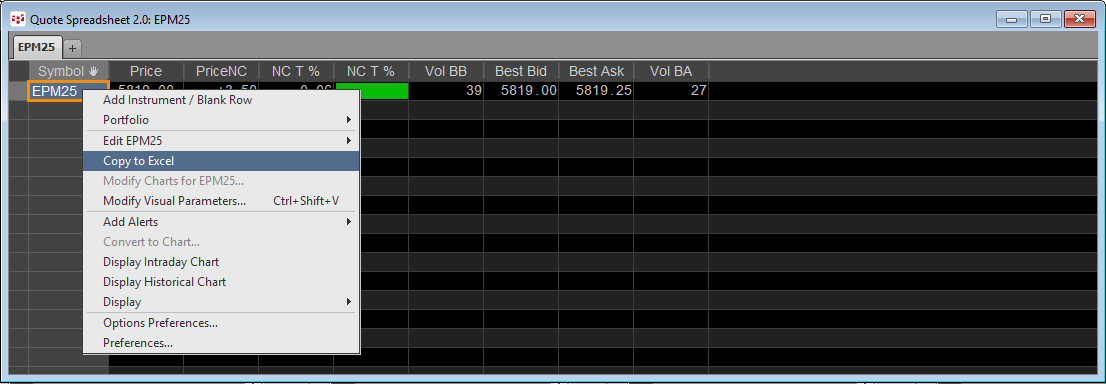
This post details the different techniques for pulling Depth-of-Market (DOM) data into Excel.
There are three ways:
C&P RTD formulas for Level 1 DOM data from the various quote… more