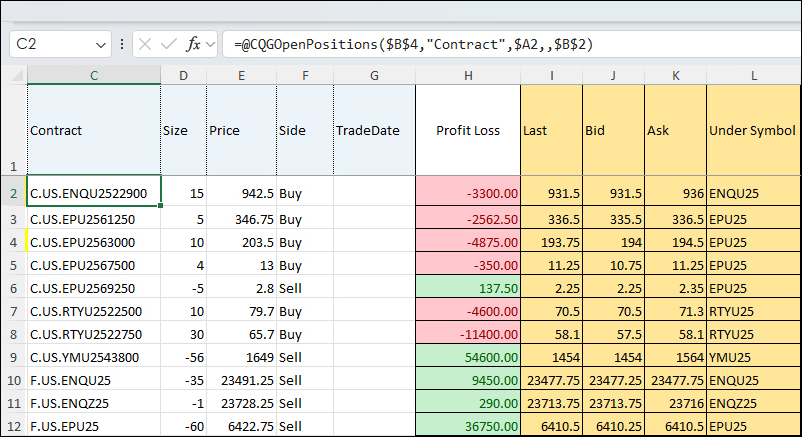
This spreadsheet built by CQG Product Specialist Jim Stavro uses RTD calls to pull in open futures and options positions as well as "Greeks" using RTD formulas.
To use the spreadsheet, CQG… more
This spreadsheet built by CQG Product Specialist Jim Stavro uses RTD calls to pull in open futures and options positions as well as "Greeks" using RTD formulas.
To use the spreadsheet, CQG… more
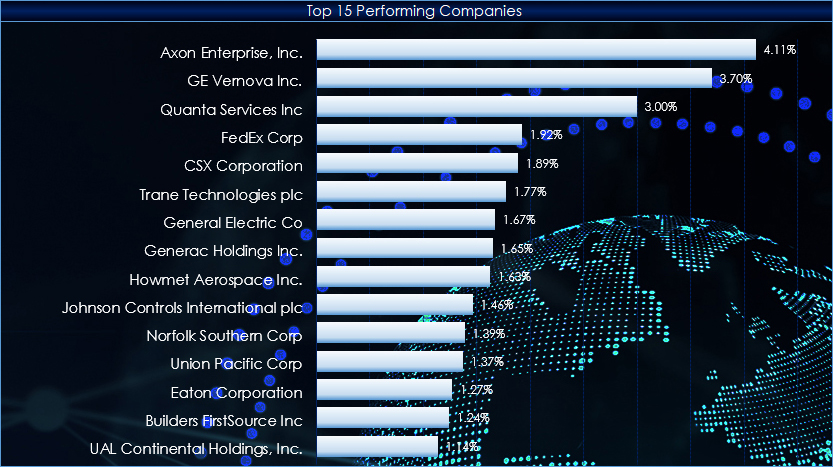
This post presents an Excel dashboard for tracking the constituents of the Industrial Select Sector SPDR® Fund. So far, during 2025 the top performing sector is the Industrials Sector (up 17.63%)… more
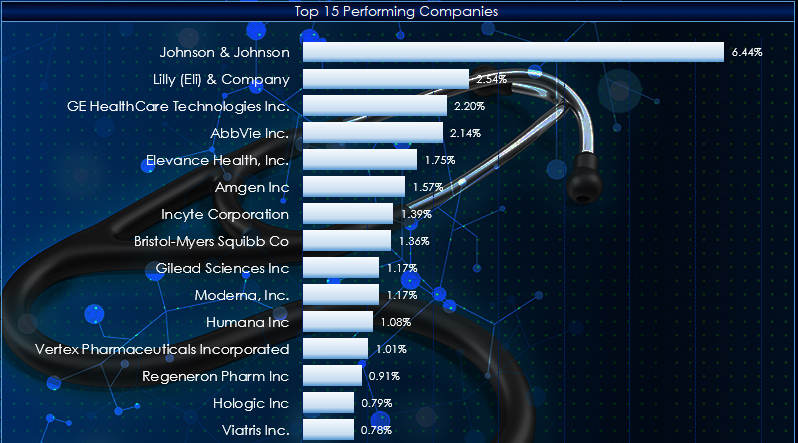
This macro-enabled Microsoft Excel® spreadsheet tracks the holdings of the Health Care Select Sector SPDR® (XLY). The ETF is based on the Health Care Select Sector Index.
There are 60 stocks… more
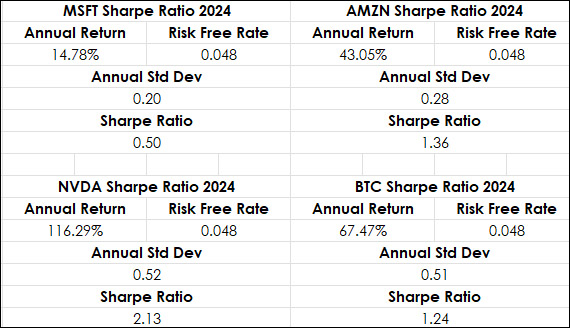
The Sharpe ratio measures the performance of an investment such as a security or portfolio compared to a risk-free asset, after adjusting for its risk. It is the difference between the returns of… more
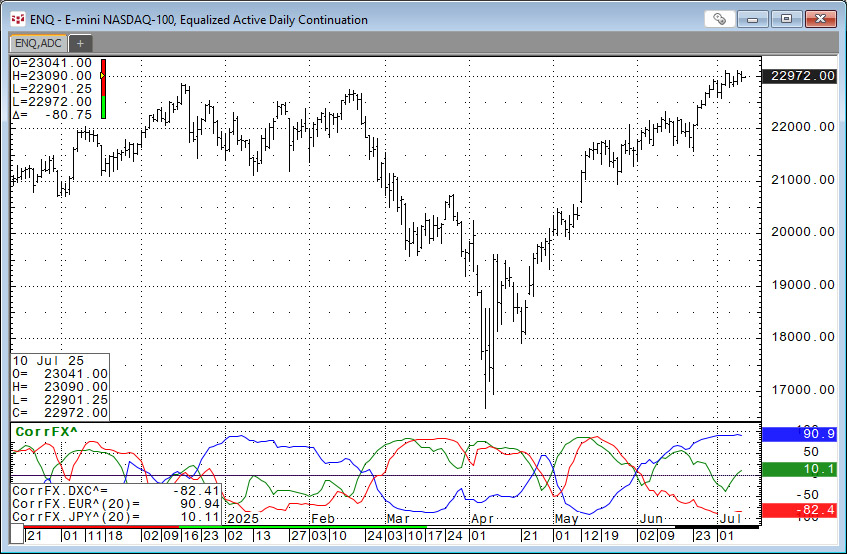
This function is available in the Add Study window and in the Formula Toolbox.
The function measures the strength and direction of the price movement of two symbols over a defined number of… more
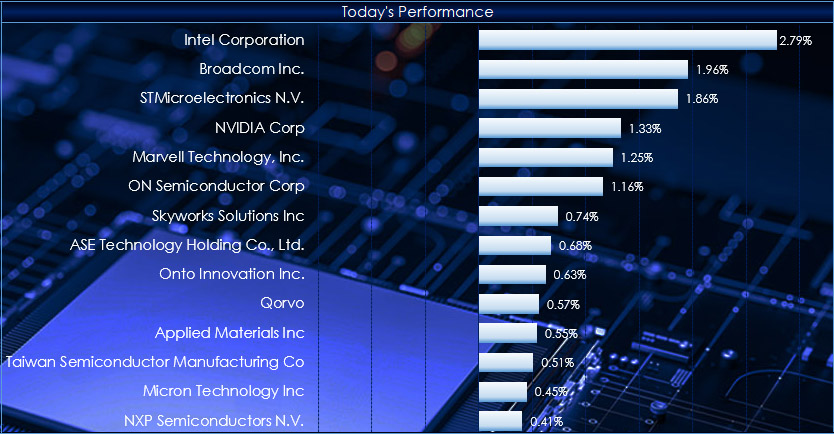
This macro-enabled Microsoft Excel® spreadsheet tracks the holdings of the iShares Semiconductor ETF (SOXX). The ETF tracks the investment results of an index composed of listed US equities in the… more
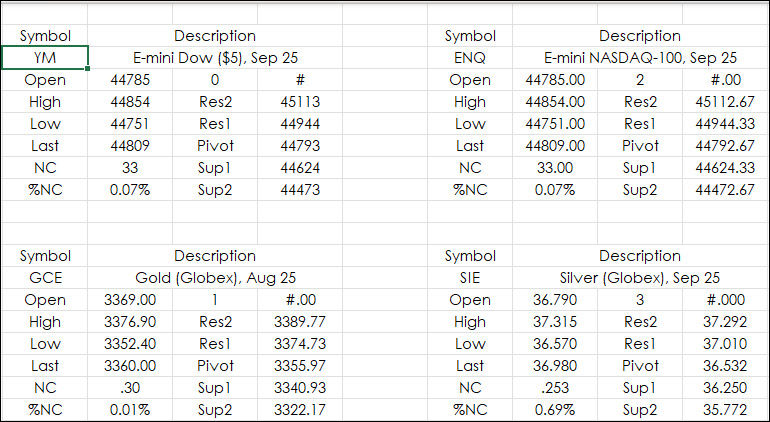
This post details bringing in the Pivot Points study values from IC or QTrader into Excel.
The pivot point is the arithmetic average of the high (H), low (L), and closing (C) prices of the… more
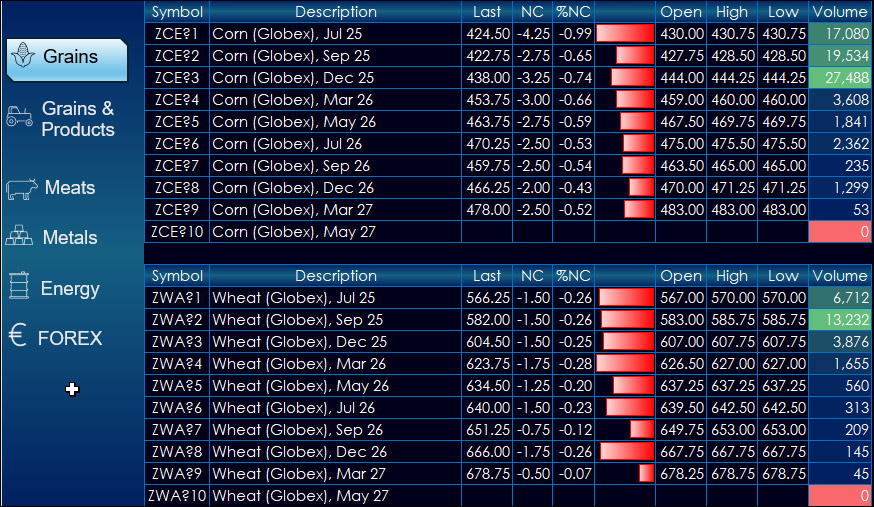
This dashboard provides market data for CME products. The dashboard uses a navigation bar instead of tabs.
The left-hand side provides market data for products. The right-hand side… more
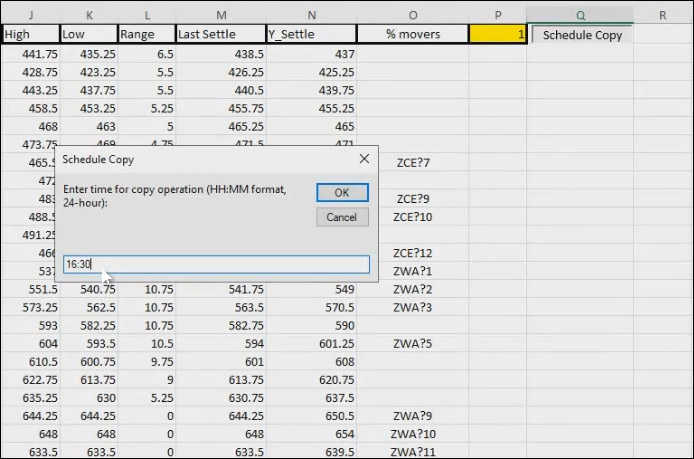
With the advent of nearly 24-hour electronic trading, one technical issue is market data servers require to be cleared of today's trading activity before the opening of the evening sessions. This… more
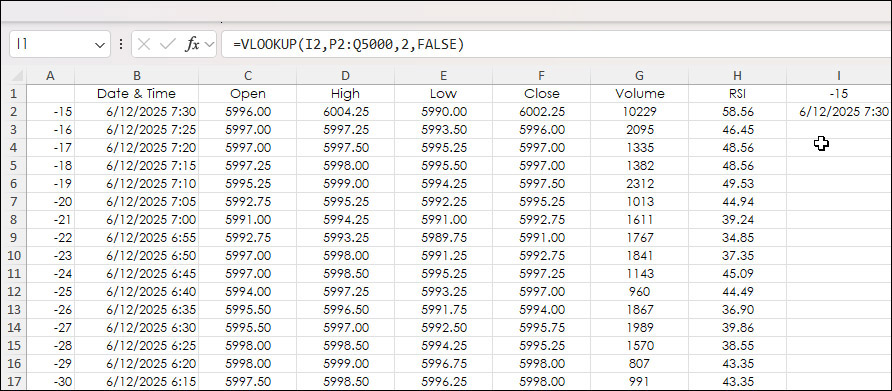
A typical historical Excel RTD dashboard pulls in market data using the bar index parameter. Below, the bar index is in column A. The most current bar is "0". The previous bar is "-1", etc.
… more