Stories are appearing in the media pointing out the possibility of an AI bubble. Alternative ETFs have been suggested that are not so "tech heavy." One suggestion is the Invesco S&P 500®… more
Workspaces
This post detailed the Double Exponential Moving Average Study or DEMA. DEMA is helpful for technical analysis because it reduces the lag of traditional moving averages, such as the simple moving… more
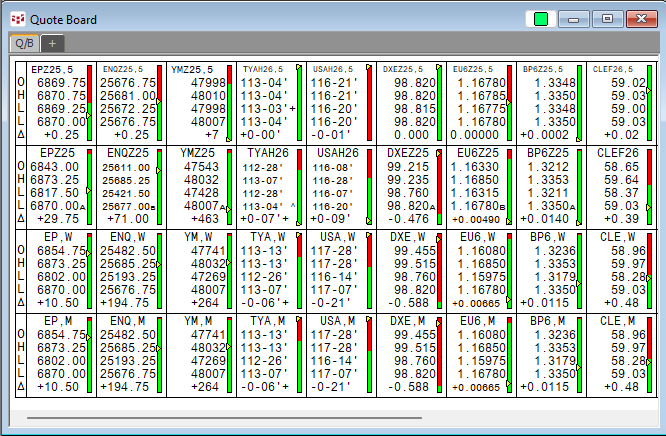
The CQG Quote Board is a classic quote display providing the open, high, low, last, and net change from the prior close.
One feature unique to the CQG Quote Board is a symbol entered… more
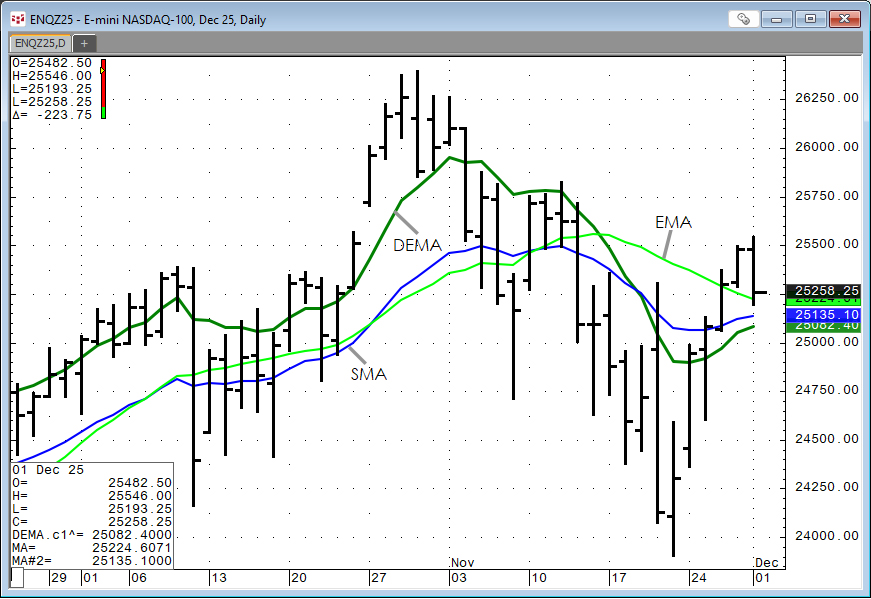
The Double Exponential Moving Average study is a moving average calculation that reduces the lag associated with other moving averages. The Double Exponential Moving average is calculated as the… more
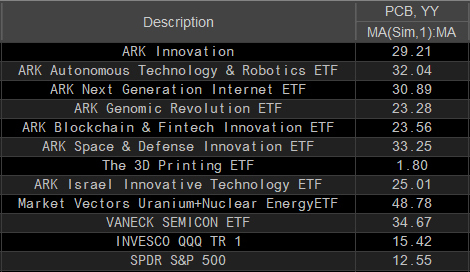
At the bottom of this post is a downloadable CQG Pac that installs a page for CQG IC and QTrader customers interested in following a section of the technology ETFs. The group of ETFs are displayed… more
From the ARK website: "Companies within ARKQ are focused on and are expected to substantially benefit from the development of new products or services, technological improvements, and advancements… more

This post details steps using the Excel CQG RTD Toolkit Add-in to pull in open interest data for an options series based on the same expiration. These same steps can be used to pull in other… more
This post offers two Excel dashboards for tracking the holdings of the Vanguard Information Technology ETF. The fund tracks the performance of the CRSP US Large Cap Growth Index.
It uses a… more
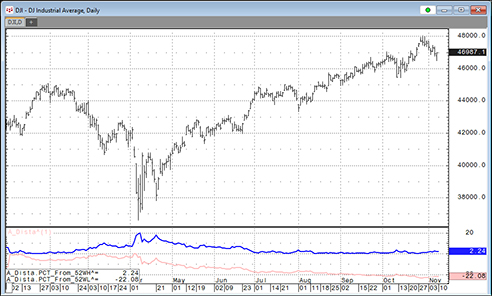
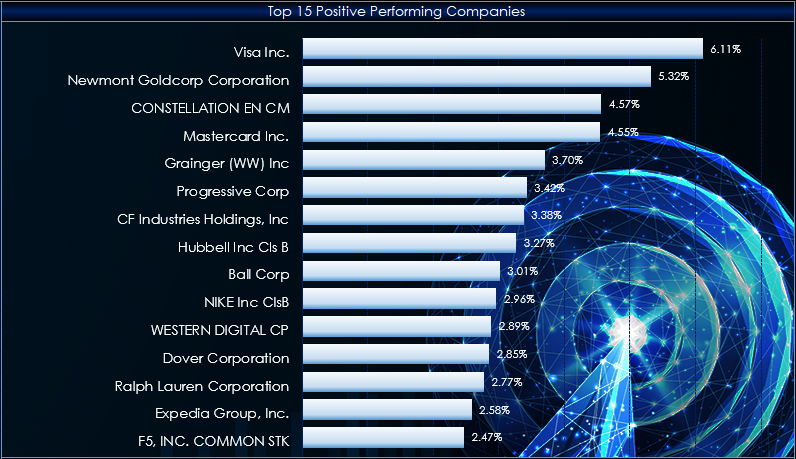
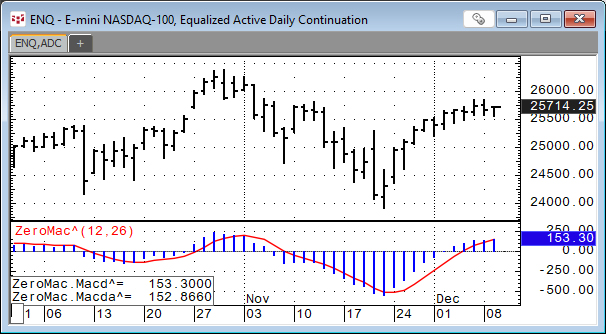
This post offers a downloadable CQG PAC for IC and QTrader and Excel dashboard that includes two custom studies that track a market's performance by measuring the price difference between the… more
This post offers two Excel dashboards for tracking the holdings of the Vanguard Information Technology ETF. The fund tracks a market cap-weighted index of companies in the US information… more