John Ehlers developed the Ultimate Smoother study. https://www.mesasoftware.com/TechnicalArticles.htm The study is a two-pole low-pass digital filter designed to smooth price data while… more
Workspaces
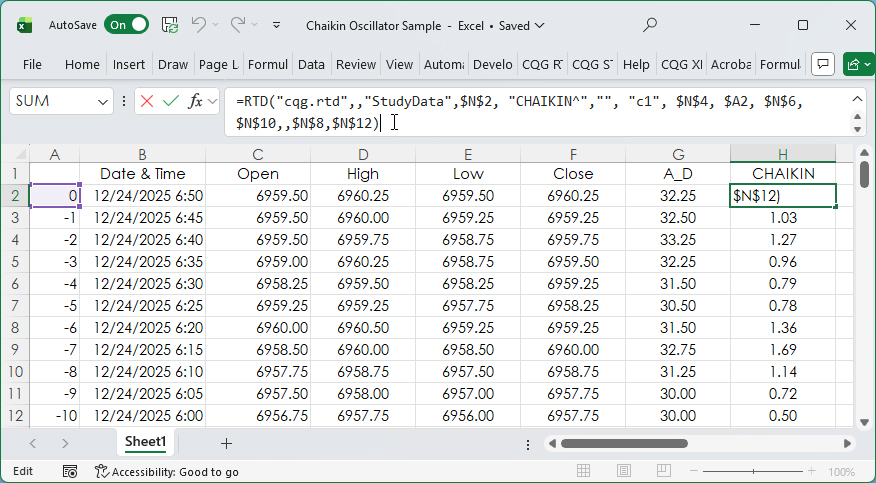
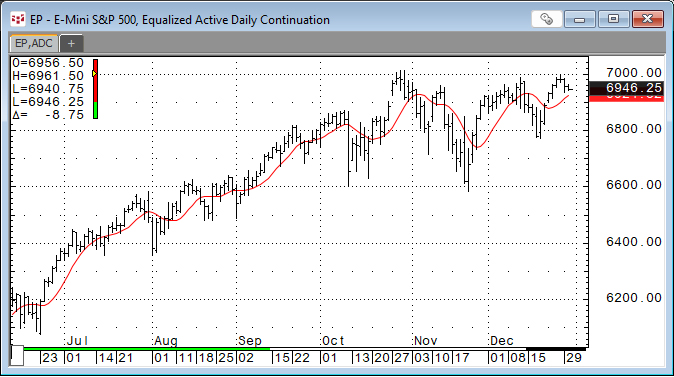
The Accumulation/Distribution Study and the Chaikin Oscillator were introduced in the post titled CQG Primer: The Chaikin Oscillator.
The Chaikin Oscillator is the difference between two… more
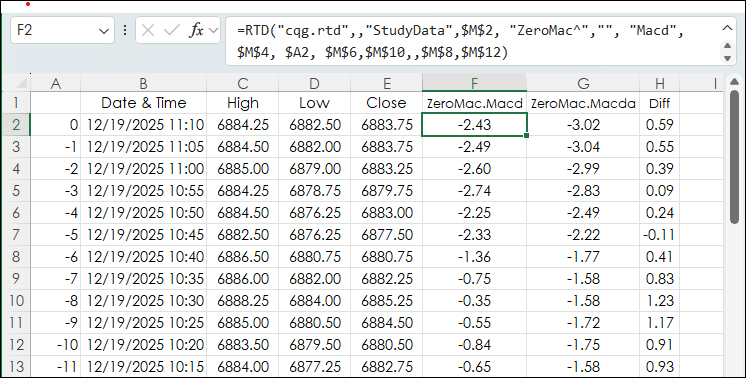
This post, DEMA Based MACD Oscillator, introduced using the Double Exponential Moving Average Study for smoothing the data to create an MACD study that would have less lag than the classic MACD… more
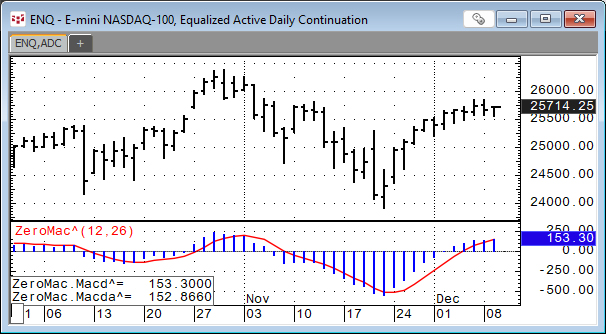
This post detailed the Double Exponential Moving Average Study or DEMA. DEMA is helpful for technical analysis because it reduces the lag of traditional moving averages, such as the simple moving… more
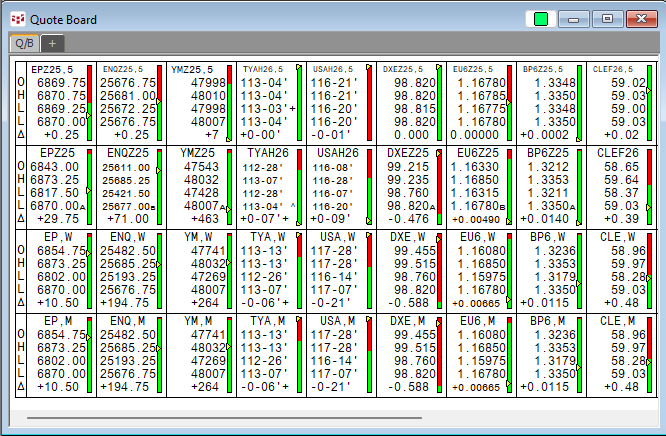
The CQG Quote Board is a classic quote display providing the open, high, low, last, and net change from the prior close.
One feature unique to the CQG Quote Board is a symbol entered… more
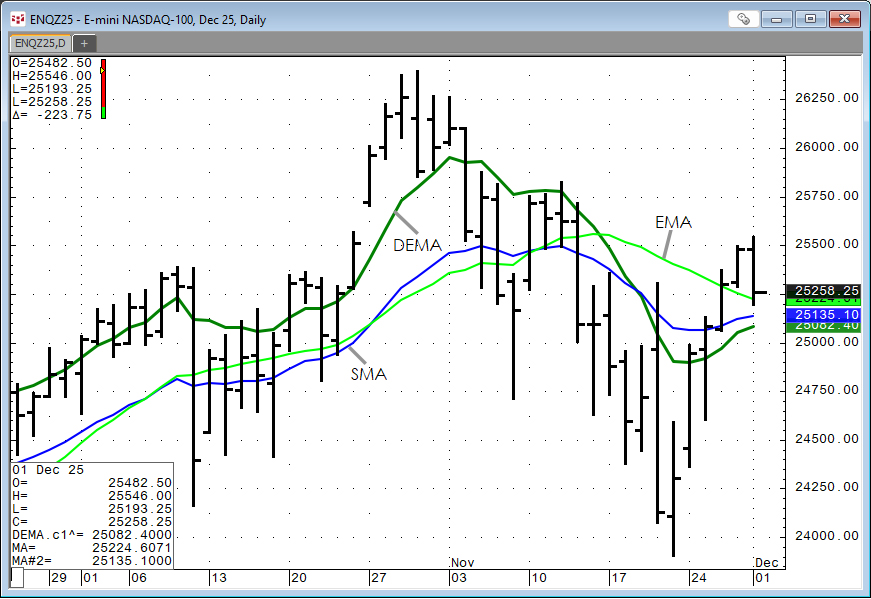
The Double Exponential Moving Average study is a moving average calculation that reduces the lag associated with other moving averages. The Double Exponential Moving average is calculated as the… more

This post details steps using the Excel CQG RTD Toolkit Add-in to pull in open interest data for an options series based on the same expiration. These same steps can be used to pull in other… more
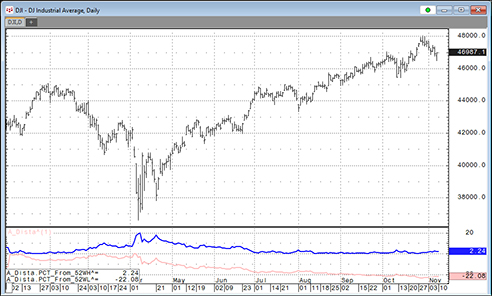
This post offers a downloadable CQG PAC for IC and QTrader and Excel dashboard that includes two custom studies that track a market's performance by measuring the price difference between the… more
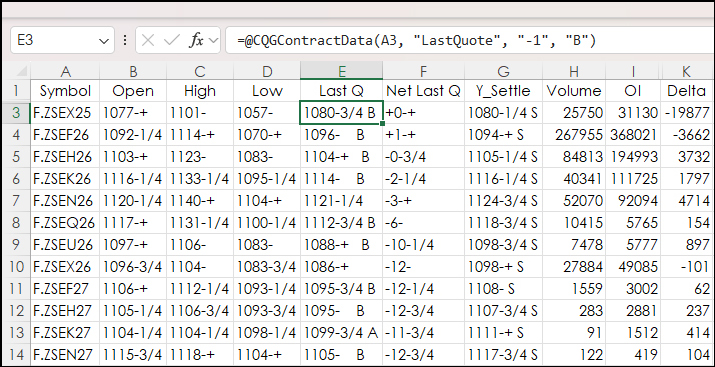
A popular quote display for following a group of contracts in a particular commodity is the CQG All Contracts display. This post details the steps to replicating this display in Excel.
First… more
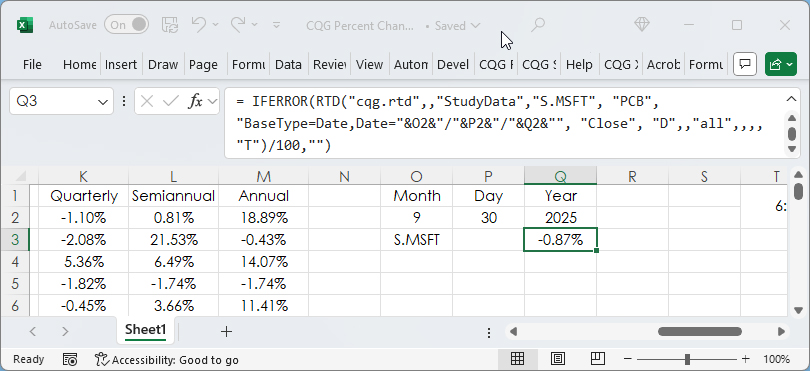
Percent Net Change is a key technique for comparing market performance among a group of markets. This post is an overview of the various Excel RTD formulas available for calculating percent net… more