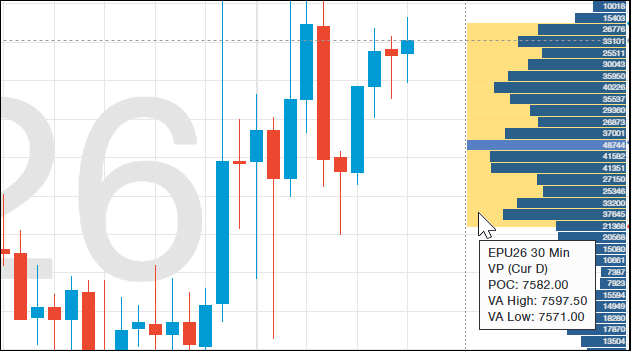
This post details CQG One's Volume Profile Study.
Once applied to a chart, the study calculates the Profile's Value Area and Point of Control (POC).
The value area begins calculating… more
This post details CQG One's Volume Profile Study.
Once applied to a chart, the study calculates the Profile's Value Area and Point of Control (POC).
The value area begins calculating… more
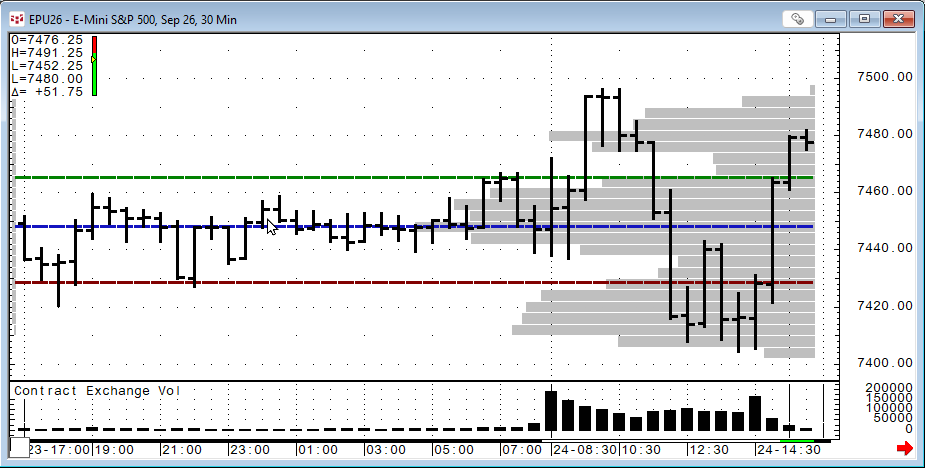
This post details the Market Profile Value Areas (MPVA) study, as well as providing a downloadable Excel sample for pulling MPVA study data into a spreadsheet.
When applied to a chart, the… more
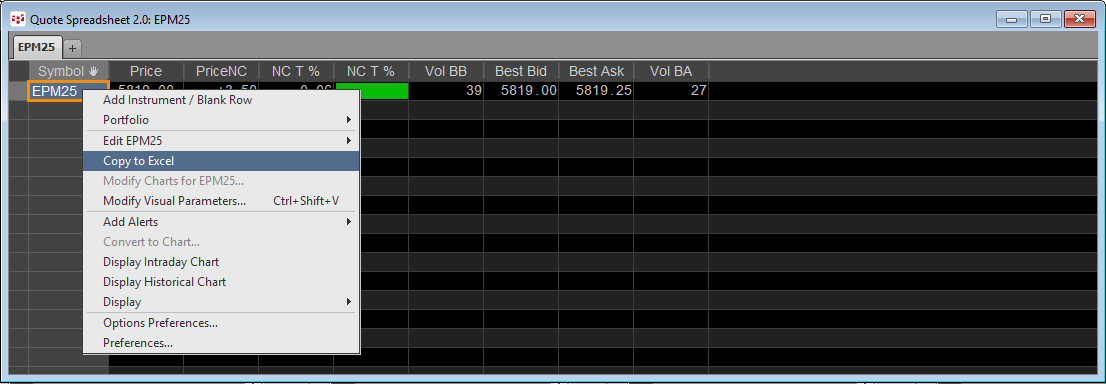
This post details the steps to pulling custom study values into Excel using RTD formulas. First, an overview of RTD formulas and parameters.
When CQG IC or QTrader are installed, a DLL… more
John Ehlers developed the Ultimate Smoother study. https://www.mesasoftware.com/TechnicalArticles.htm The study is a two-pole low-pass digital filter designed to smooth price data while… more
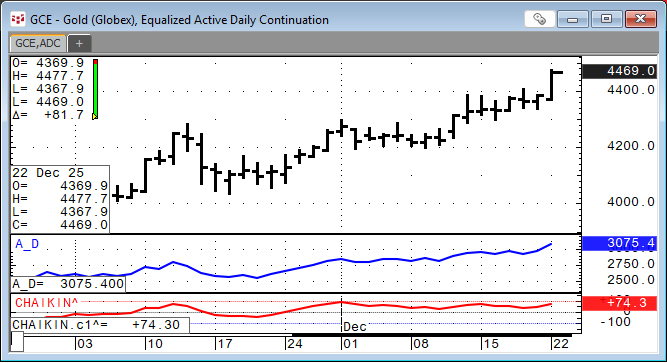
Developed by Marc Chaikin, the Chaikin Oscillator is a technical analysis tool traders and investors use to confirm trends and indicate possible trend reversals. The oscillator uses the… more
VWAP is the volume weighted average price for a futures contract plotted as a line on the price chart. The calculation is the sum of traded volume times the price divided by the sum of the traded… more
This set of studies provides the Order Display study (indications on a chart for filled and working orders), open trade equity, current position, and profit and loss account… more
CQG IC and QTrader offer the Candlestick Formations study.
The Candlestick Formations study is a collection of conditions. Candlestick formations appear as overlays on the chart in the… more
This post details the different techniques for pulling Depth-of-Market (DOM) data into Excel.
There are three ways:
C&P RTD formulas for Level 1 DOM data from the various quote… more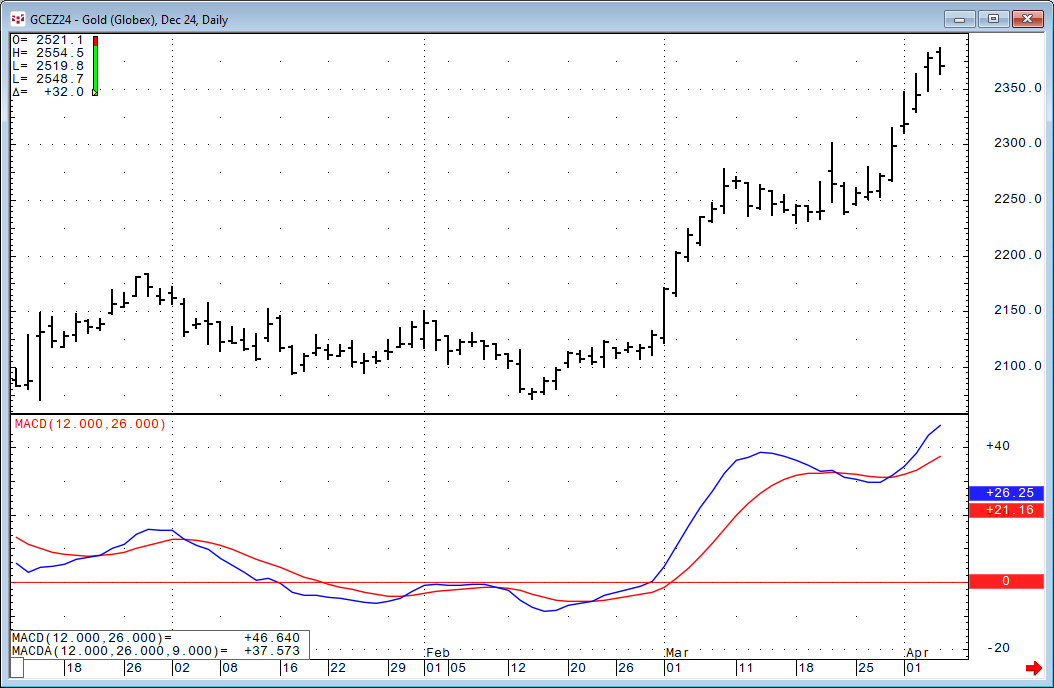
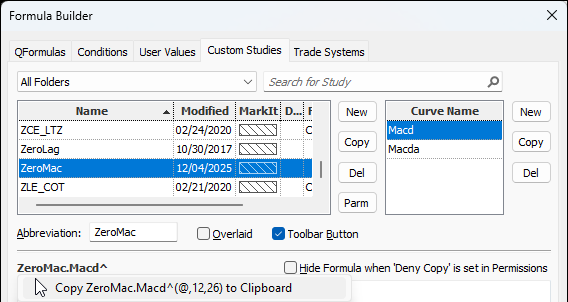
The Moving Average Convergence/Divergence indicator (MACD) was invented by Gerald Appel over 40 years ago. The study is an unbounded oscillator with two lines: MACD and MACDA.
MACD =… more