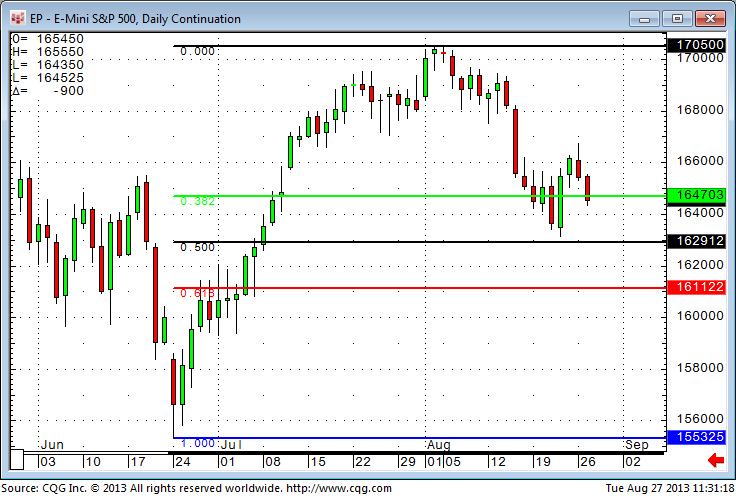
Derived from contributions medieval mathematician Leonardo Fibonacci made to number theory, retracements measure the price areas where a market move is likely to pause or reverse a trend. Many traders rely on Fibonacci numbers to compute these levels of support and resistance.
The following retracement scales are the default ratios in CQG: 0.000, 0.250, 0.382, 0.420, 0.500, 0.618, 0.750, 1.000, and 1.382.
Since the Fibonacci Retracement is a pointer tool, it cannot be used or referred to in trading systems and other formulas. The only solution to this is to calculate the Fibonacci levels automatically.
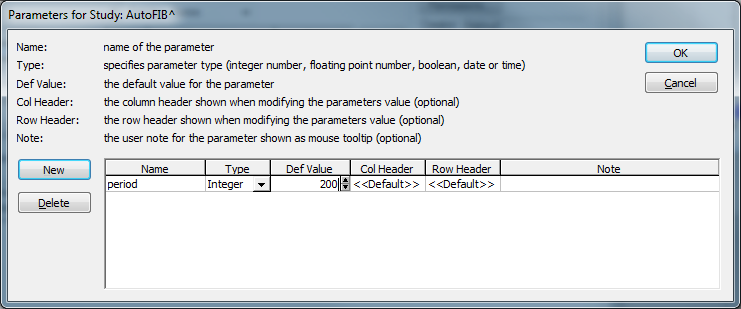
The first step is to identify the highest high and lowest low over a certain period. To keep this process as flexible as possible, it is wise to have the period set as a parameter.
The formulas for the different curves are:
High: HiLevel(@,period,0)
Low: LoLevel(@,period,0)
L50: LoLevel(@,period,0) + ( HiLevel(@,period,0) - LoLevel(@,period,0))*0.5
L618: LoLevel(@,period,0) + ( HiLevel(@,period,0) - LoLevel(@,period,0))*0.618
L382: LoLevel(@,period,0) + ( HiLevel(@,period,0) - LoLevel(@,period,0))*0.382
You can also change the multiplier at the end of each line to your individual values or create parameters for them. It is also possible to create more lines with the same logic. If you want to use this inside a trading system, you can use each line separately in the trading system without referring to the AutoFib study. Just keep in mind to have the parameter created and set.


