In CQG 2014 we will introduce three new chart types plus sub-minute bars, such as ten-second bar charts. In the next few articles we will have a short look into each one of them, starting with Heikin-Ashi charts.
Heikin-Ashi Charts
Heikin-Ashi candlesticks are a derivative of Japanese candlesticks, but rather than using actual open, high, low, and close values, they use recalculated values.
The values for open, high, low, and close are calculated like this:
- HAOpen = (HAOpen(Previous Bar) + HAClose(Previous Bar)) / 2
- HAHigh = Maximum(High, HAOpen, HAClose)
- HALow = Minimum(Low, HAOpen, HAClose)
- HAClose = (Open + High + Low + Close) / 4
The noise reduction resulting from these recalculated values may result in better exposure of trends and reversals.
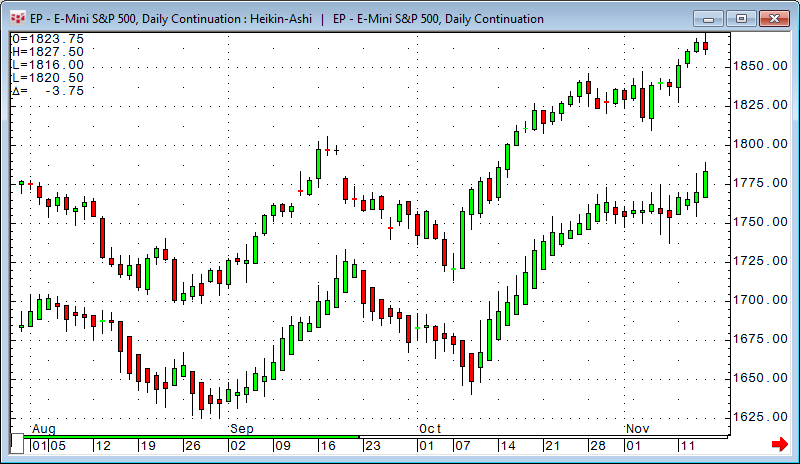
The upper portion of the chart above shows a classic candlestick chart while the lower portion of the chart shows the same market displayed as a Heikin-Ashi chart.
The recalculated Heikin-Ashi chart tries to filter out market noise and give us a clearer picture for the trend. Where the normal candlestick chart shows some red candles inside this strong uptrend, the Heikin-Ashi chart still gives us green candles. It also eliminates gaps for a better chart picture as seen on September 17.
You can apply all kinds of indicators to Heikin-Ashi charts, as you would with any other standard chart type. Fibonacci Retracements, moving averages, Bollinger Bands, etc. will work as expected.
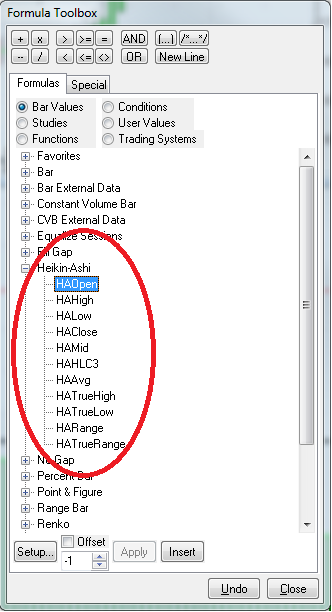
Heikin-Ashi charts are also reflected in CQG's Formula Toolbox under Bar Values.
Note that Heikin-Ashi charts are not intended for analysis where open, high, low, and close data apply. As all of these values are always recalculated values, backtesting results might be very different from what you would experience during real-time trading.
As an example, I have created a very simple trading system that simply buys Heikin-Ashi up-candles and sells down-candles. The backtesting results will look too good to be true, but as already mentioned, it will not be tradable the same way in reality.

For every trading system we build, we need to do a very careful reality check. This applies very strongly for Heikin-Ashi charts.
In order to visualize the difference of the real close price compared to the Heikin-Ashi close, I am displaying a very simple study as dashes on top of the Heikin-Ashi chart.
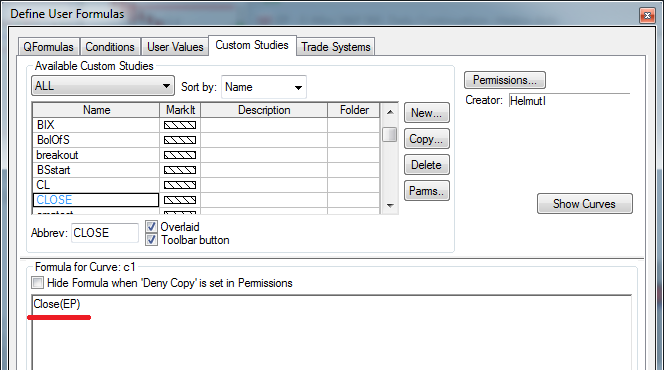
The custom study is Close(@) and I substituted the @ with the symbol EP. The custom study applied to the Heikin-Ashi chart now shows me the real close as indicated by the dashes.
Why are trading system results "unrealistic" using calculated open, high, low, and close values?
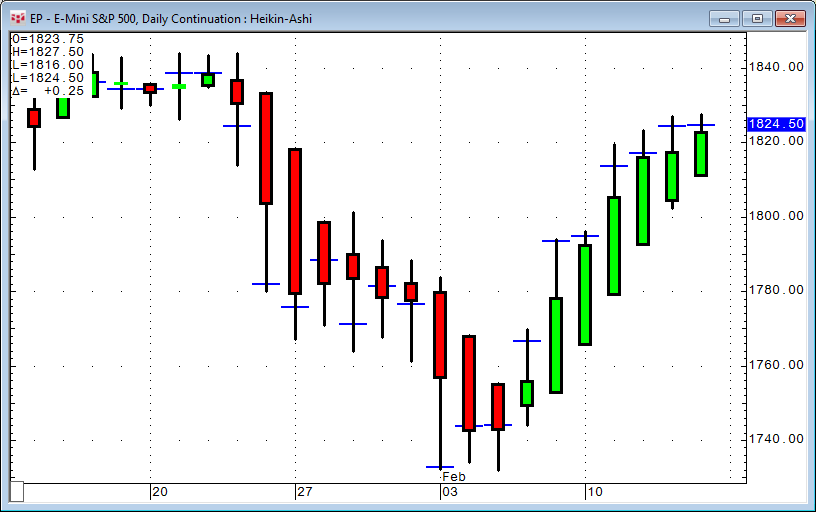
Here is an example what can happen:

After the second green candle (candle 1) the trading system initiates a long trade. Nothing happens on candle 2. On candle 3 the market comes down hard. On the next candle (number 4) the current bid/ask (red/green line) is actually still near the low of candle 3, the trading system exits the trade, but it uses the "calculated" open that is actually nine points (225€) away from the real market price. The system also initiates a short trade on the "calculated" open that looks like a winning trade on the chart, but in reality the fill real price was off nine points as well.
Heikin-Ashi charts are a chart style that filters out market noise with the goal of indicating the trend, similar to moving averages. As such, the Heikin-Ashi chart could be the basis for a trend-following system as long as you take into consideration the nature of the Heikin-Ashi chart as has been shown in this article.