After we looked into some time frame considerations in my last article, the next logical question is to ask if CQG can "optimize time." CQG Trade System Optimizer (TSO) does not allow us to optimize a trade system by answering the question on which chart interval it would work the best, but here is a little idea on how to get around this. This is only a starting point for your further investigation, but I wanted to point out what actually is doable within CQG.
To understand the concept of using cross time frame indicators, it is highly recommended to review an earlier article of this series.
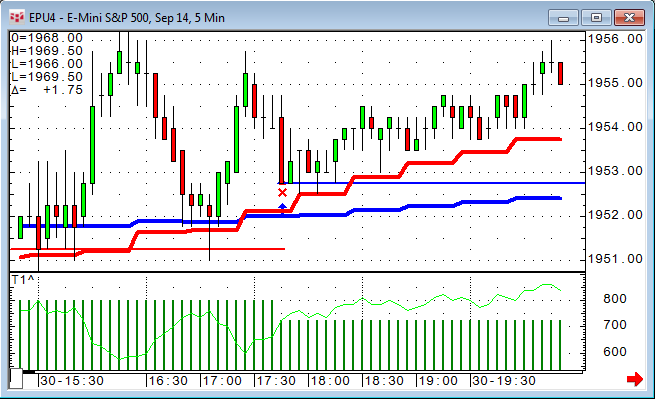
We are able to force an indicator to be calculated from the chart data coming from a higher timeframe and display it on a smaller time frame chart by simply adding the time frame to the code. Here is an example of a twenty-one-period moving average based on a sixty-minute chart:
MA(@,Sim,21),60
Inside a trading system, we would parameterize the period of the moving average as well as the time frame on which it is based.
This way we are able to receive the actual entry signal from a higher time frame, but we can run our trailing exits and money management on the smaller time frame.
As the first step, I would try this with a simple trading system and also build the indicators I am using with that cross-time-frame function. It is important to very closely check every entry and exit the trading system does to verify that it actually works correctly before continuing. If you run the trading system on a five-minute chart using a thirty-minute indicator, it would be a good starting point to compare it with the simple version of the trading system running on a thirty-minute chart with a thirty-minute indicator. Trades will not always match100%, but they should be very close!
A little side note on entry quantity based on Average True Range (ATR): If you use this concept for your trading size, this must be adjusted, too. The smaller time frame usually does have a smaller ATR; therefore, you would trade a higher number of contracts in the five-minute chart than the thirty-minute chart.
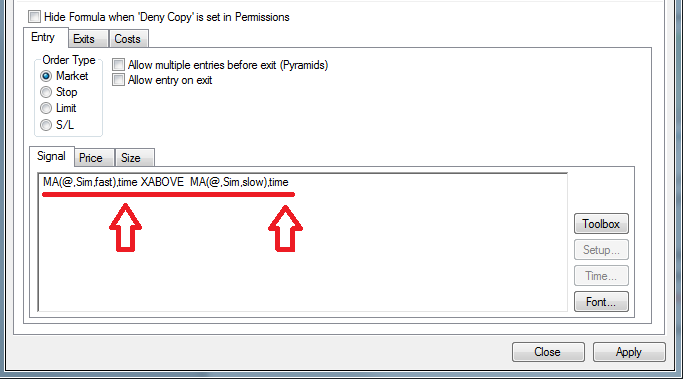
If you are really confident with the result of your trading system, the next step is to put it into CQG's TSO.

Just like any other parameter, the time can be optimized as well. To save on the number of calculations, I don't see the need to have every possible minute tested. Also, I would like to use natural multiplications of the base time frame, i.e., on a five-minute chart I want test the indicator between five, ten, fifteen, twenty, and so on up to sixty minutes. I try to avoid odd numbers that would not be in sync with the chart.

When comparing results, you also need to keep in mind that you probably get less signals the longer the indicator time frame gets. Just comparing total net profit may not do the trick. I would also look at the other statistics.
As mentioned already above, this is only a starting point for your own experiments.
Let me know if you have any interesting findings you want to share with the community.