For this post we are looking at Larry Williams Ultimate Oscillator and the Marc Chaikin Oscillator.
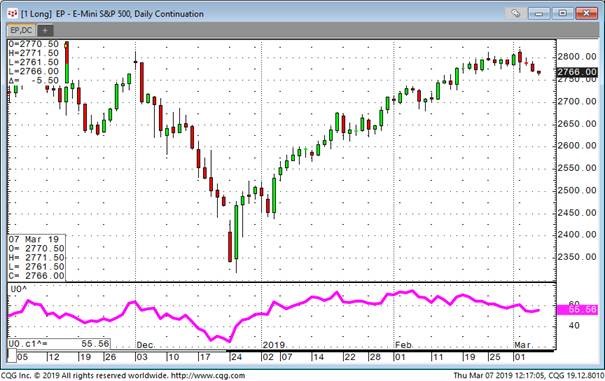
Developed by Larry Williams the Ultimate Oscillator is a momentum oscillator designed to capture momentum across three different timeframes. The multiple timeframe objective seeks to avoid the pitfalls of other oscillators. The Ultimate Oscillator attempts to correct this fault by incorporating longer timeframes into the basic formula. Williams identified a buy signal a based on a bullish divergence and a sell signal based on a bearish divergence.
The formula looks like this:
BP:= Close(@) - Minimum(Low(@),Close(@)[-1]);

TR:= Maximum(High(@),Close(@)[-1]) - Minimum(Low(@),Close(@)[-1]);

AV7:= Sum(BP,7) / Sum(TR,7)  ;

AV14:= Sum(BP,14) / Sum(TR,14)  ;

AV28:= Sum(BP,28) / Sum(TR,28)  ;

UO:= 100 * ((4*AV7)+(2*AV14)+(AV28))/7;
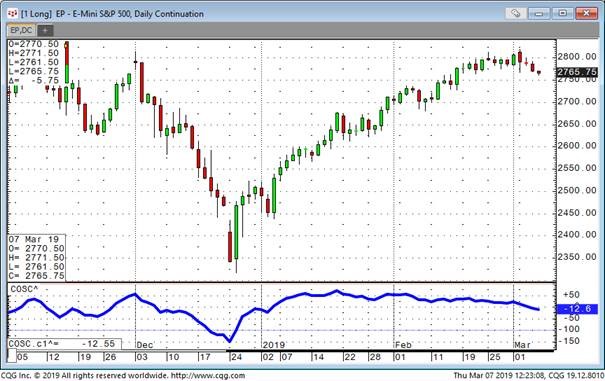
Developed by Marc Chaikin, the Chaikin Oscillator measures the momentum of the Accumulation Distribution. This makes it an indicator of an indicator. The Chaikin Oscillator is the difference between the 3-day EMA of the Accumulation Distribution Line and the 10-day EMA of the Accumulation Distribution Line.
Like other momentum indicators, this indicator is designed to anticipate directional changes in the Accumulation Distribution Line by measuring the momentum behind the movements. A momentum change is seen as the first step to a trend change. Anticipating trend changes in the Accumulation Distribution Line can help chartists anticipate trend changes in the underlying market.
As CQG already has the AD Study available, the formula is really simple:
MA(A_D(@),Exp,EMA1) - MA(A_D(@),Exp,EMA2)
While we are talking about Chaikin, one of his widely spread indicators is the Chaikin Money Flow index, which I have added to the pac as well.
Chaikin Money Flow measures the amount of Money Flow Volume over a specific period. Money Flow Volume forms the basis for the Accumulation Distribution Line. Instead of a cumulative total of Money Flow Volume, Chaikin Money Flow simply sums Money Flow Volume for a specific look-back period, typically 20 or 21 days. The resulting indicator fluctuates above/below the zero line just like an oscillator.
Formula:
MFM:= ((Close(@)-Low(@))-(High(@)-Close(@)))/(High(@)-Low(@));

MFV:= MFM*Vol(@);

CFM:=Sum(MFV,SUMPeriod)/Sum(Vol(@),SUMPeriod);

CFM
