As some kind of review for the last year, I would like to present a few indicators that were coded partly as customer requests or my own research. We had something similar a few years ago: https://news.cqg.com/blogs/coding/2019/01/most-wanted-7-studies-plus-bon...
This time we want to look into:
- Fear and Greed
- Ehler Fisher Transform
- Manual weighted Average
- Acceleration Bands
- Disparity Index
- Accumulated Volume
Fear and Greed
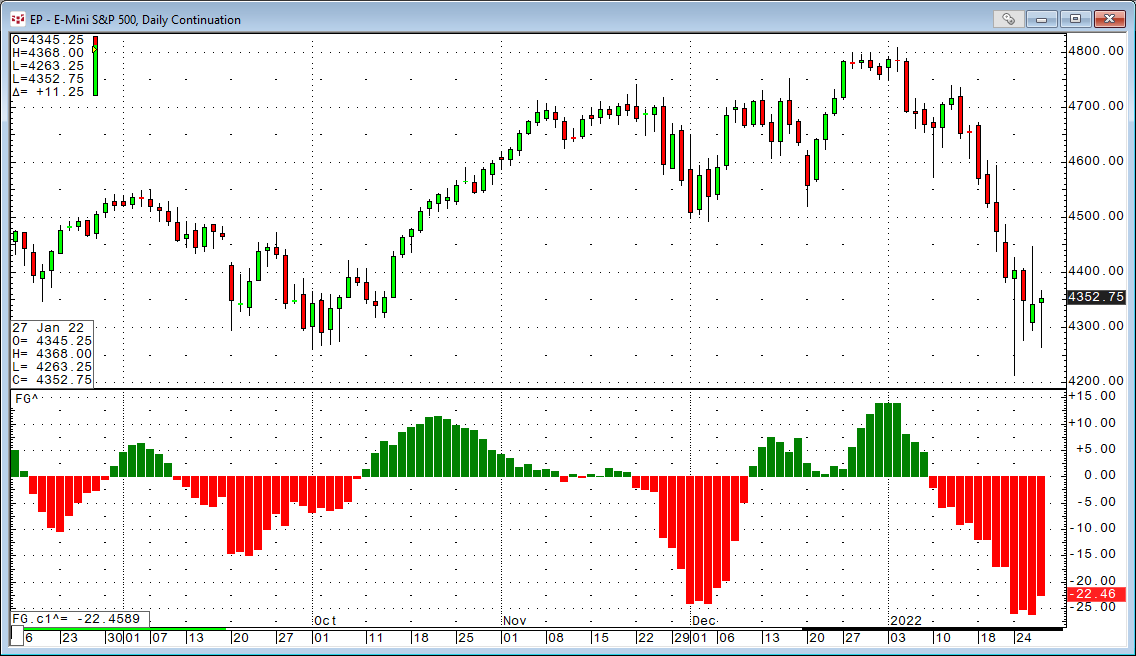
The Fear and Greed indicator is the difference of two moving averages of the True Range.
It is calculated in a way that it oscillates on the zero. The indicator provides different potential signals:
- A buy signal is generated when Fear (red) turns to Greed (green) and a sell signal is generated when Greed (green) turns to Fear (red)
- Divergence - when price trends lower and fear reaches higher lows or when price trends higher and greed is at a lower high. These are signs of an exhausted trend.
- When fear or greed spikes to extreme levels it is signaling the start of a top or bottom
The code is simple:
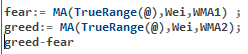
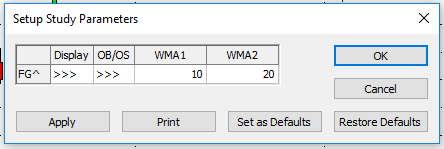
As parms you can set the length of the fear and greed periods. Default is 10 and 20.
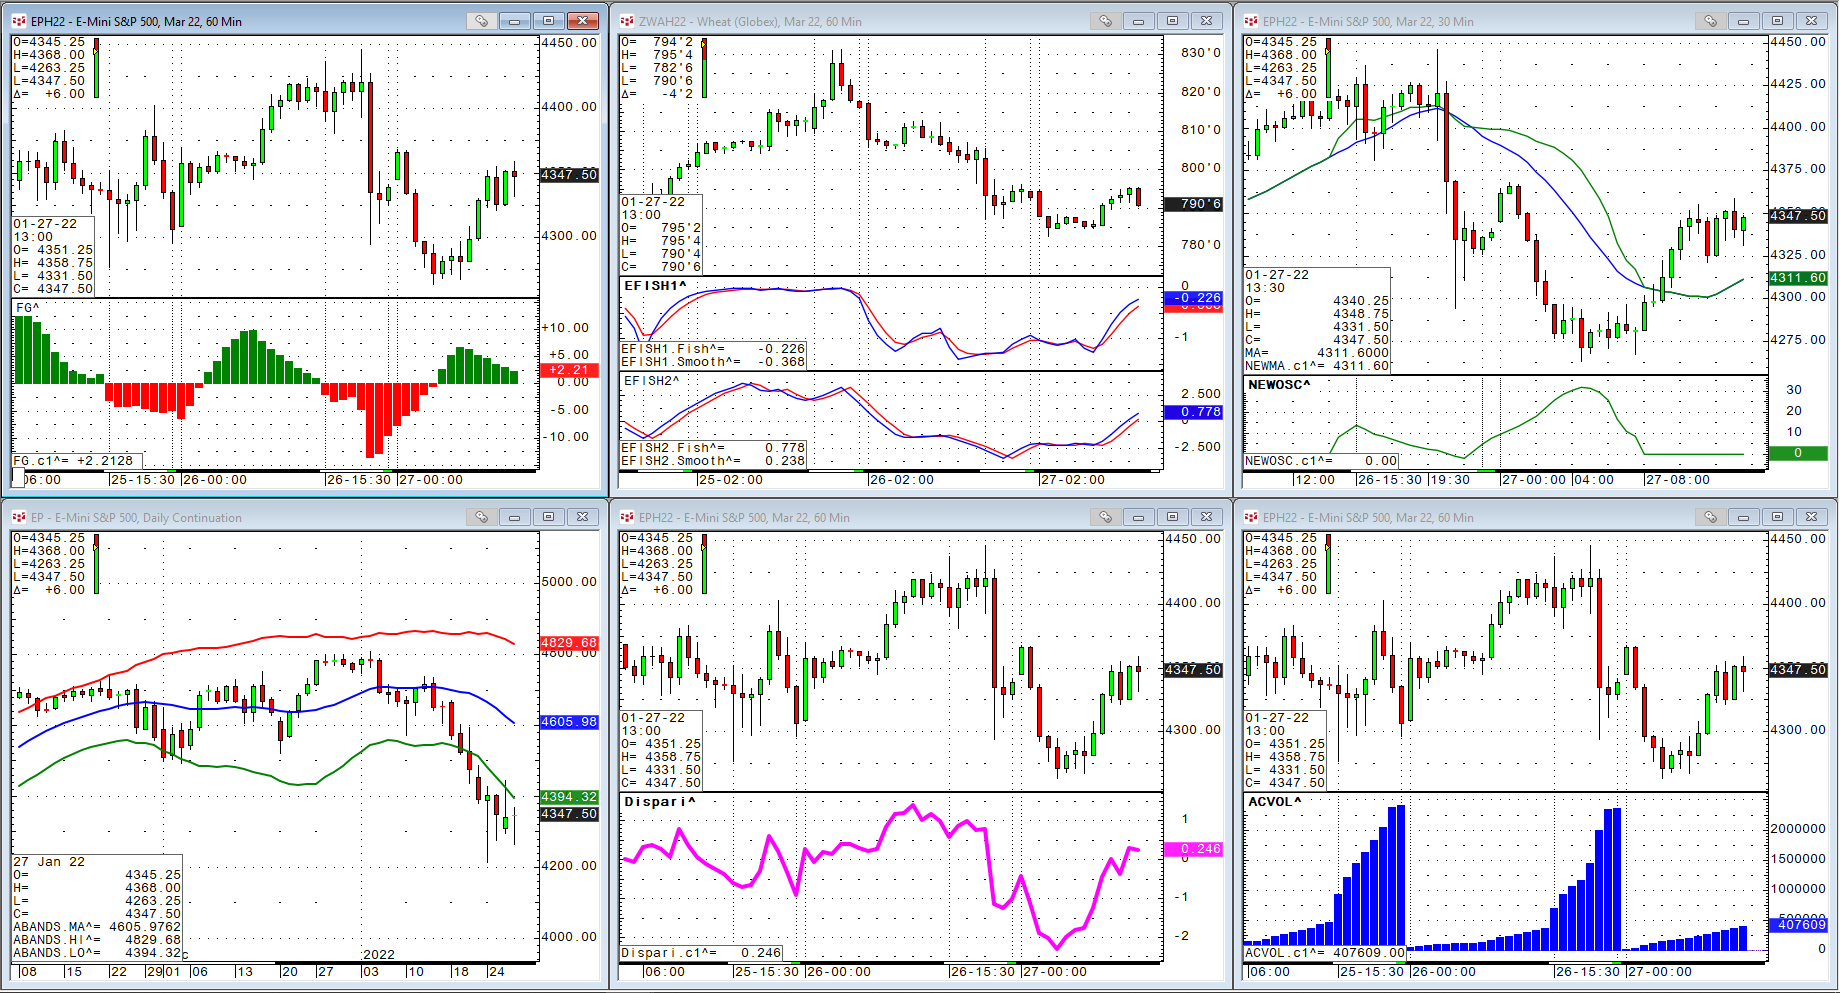
Ehler Fisher Transform
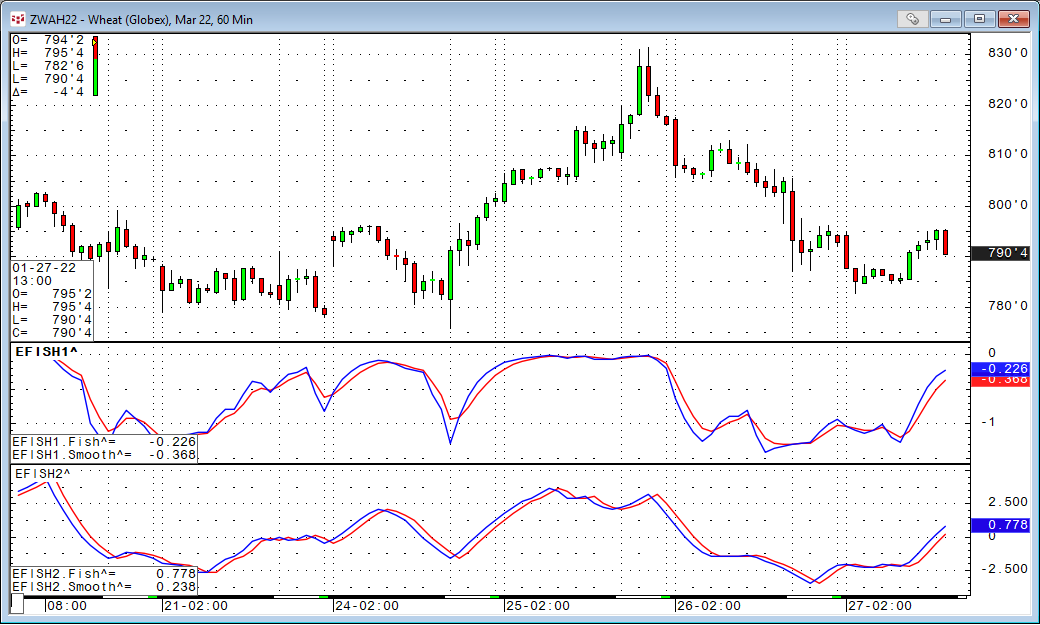
During my research in the internet for this one I found two different formulas, so I decided to build both versions for CQG.
Ehler Fisher Transformation indicator tries to identify significant price reversals by normalizing prices over a user-specified number of periods. A reversal signal is suggested when the two lines cross.
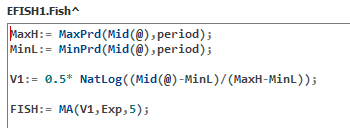
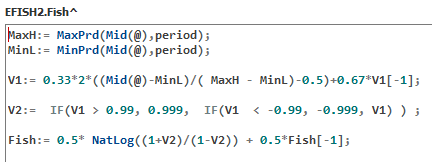
Both are also using different methods for the second curve. At the end of the article you can download all indicators and test for yourself which of the Ehler Fisher approaches you like the most.
Manual Weighted Moving Average
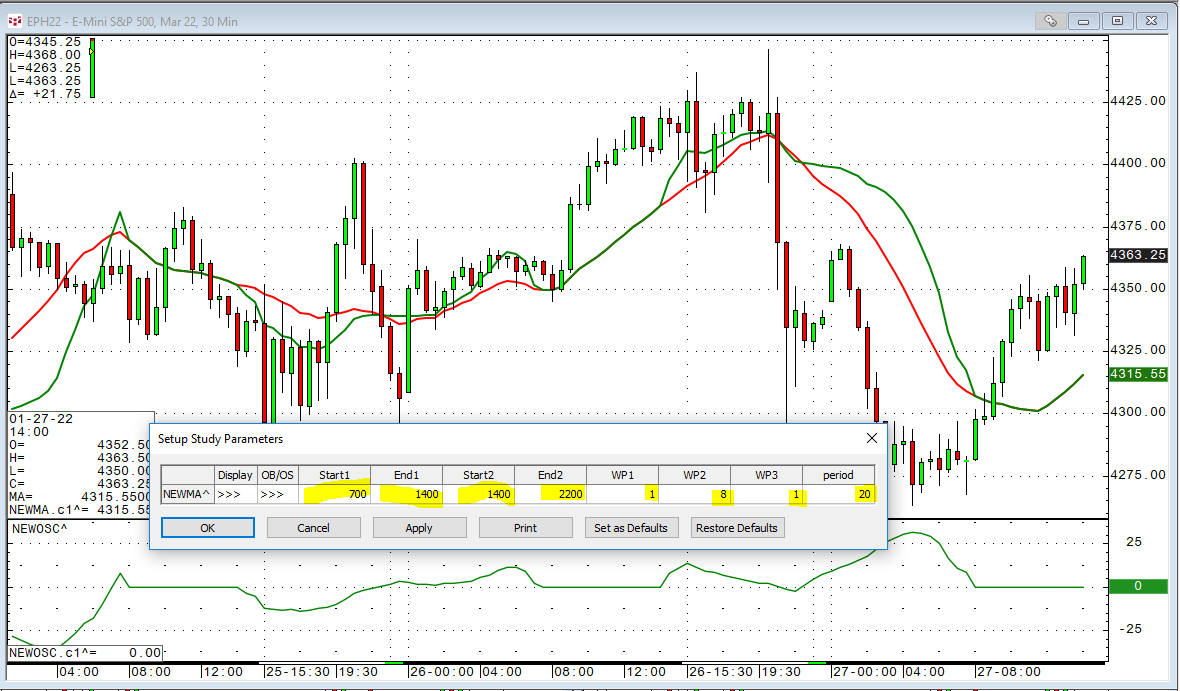
The idea behind this indicator is to cut the day into three time periods. Period1, Period2 and the rest. Then we weight the data in these time periods with different values from 1-10 for example. The other parameter is the length of the MA. In the zone with a weighting of 1 it would be in line with the normal MA und it departs in times with different weightings. To make that visible I put both indicators on the same chart. Red = Standard MA and Green = Manual Weighted MA.

Acceleration Bands
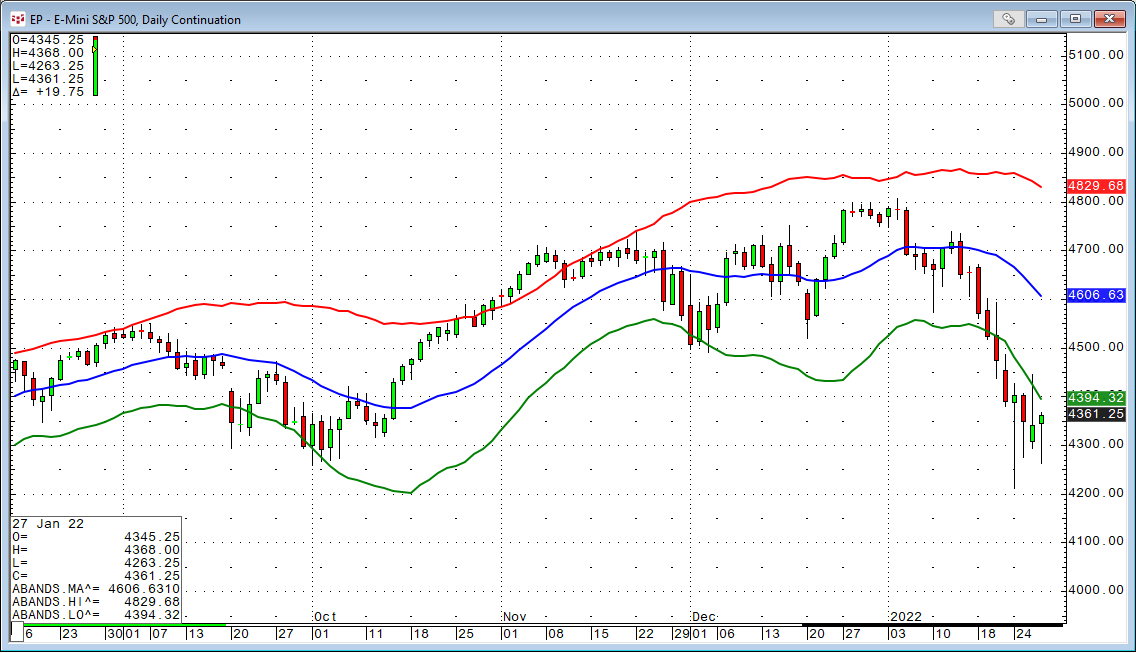
The Acceleration Bands (ABANDS) created by Price Headley plots upper and lower envelope bands around a simple moving average. The width of the bands is based on the formula below.
MA(High(@)*(1+4*(High(@)-Low(@))/(High(@)+Low(@))),Sim,period)
MA(Low(@)*(1-4*(High(@)-Low(@))/(High(@)+Low(@))),Sim,period)
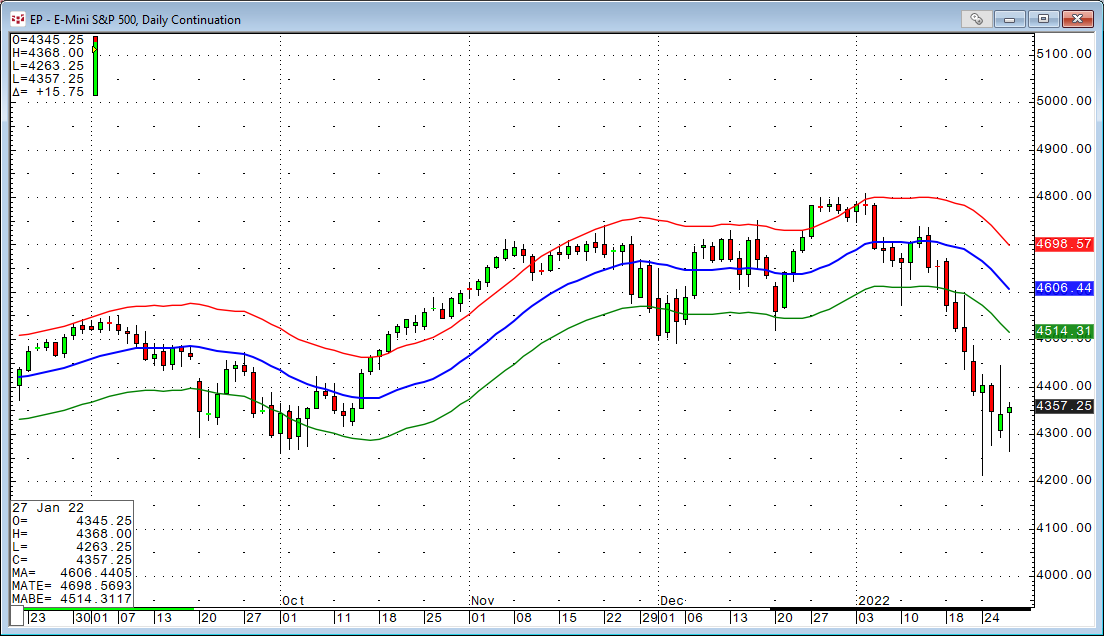
In comparison, classic MA Bands will keep the same precentral distance to the MA itself.
Disparity Index
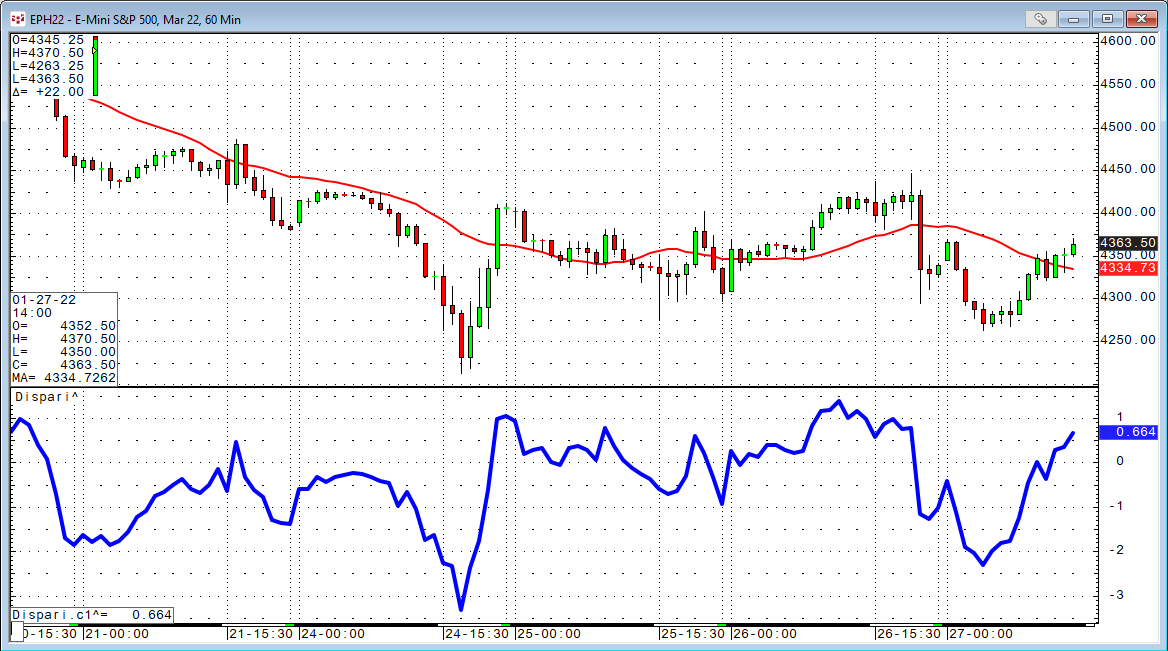
The disparity index is a technical indicator that measures the relative position of an asset's most recent closing price to a selected moving average and reports the value as a percentage.
The introduction of the disparity index is attributed to Steve Nison, who discussed it in his book Beyond Candlesticks: New Japanese Charting Techniques Revealed (John Wiley & Sons, 1994). "A widely used Japanese tool is the disparity index," he wrote.
(Close(@)- MA(@,Sim,period)) / MA(@,Sim,period)*100
The only parameter is the length of the moving average to compare it with.
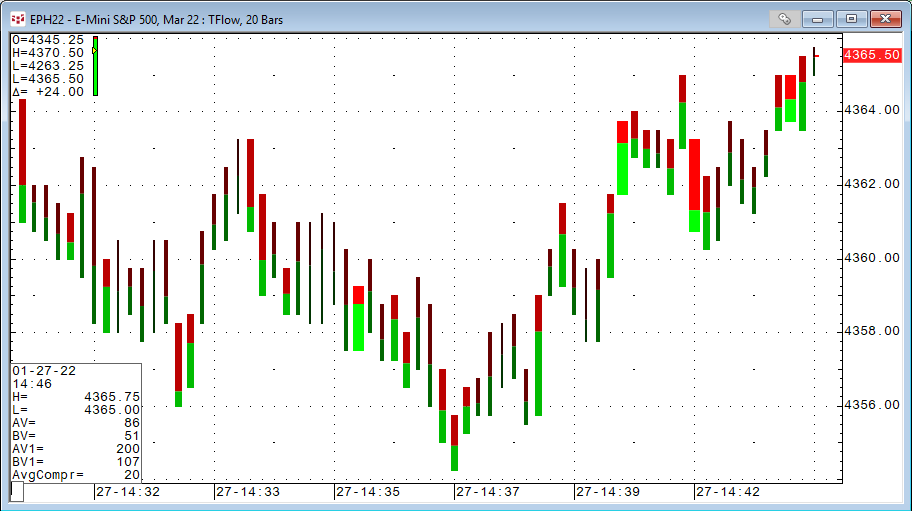
Accumulated Volume
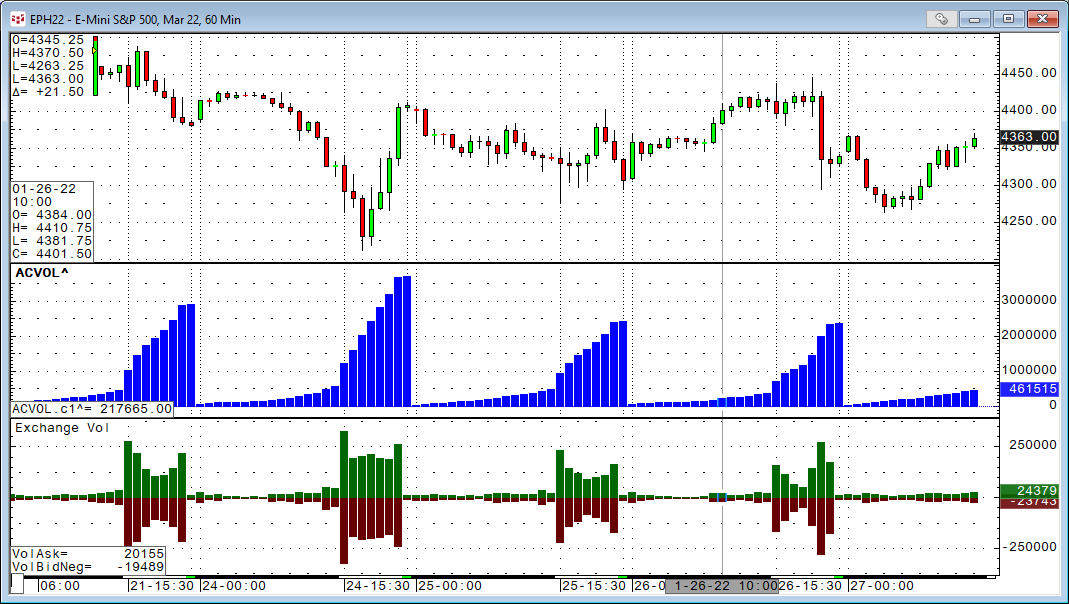
Accumulated volume (blue) adds all trades together from the start of the day. This is very interesting putting this in relation to the volumes per candle i.e. per time period.
The red and green study is the exchange volume by time period divided into bid and ask volume as introduced with CQG TFlow charts.