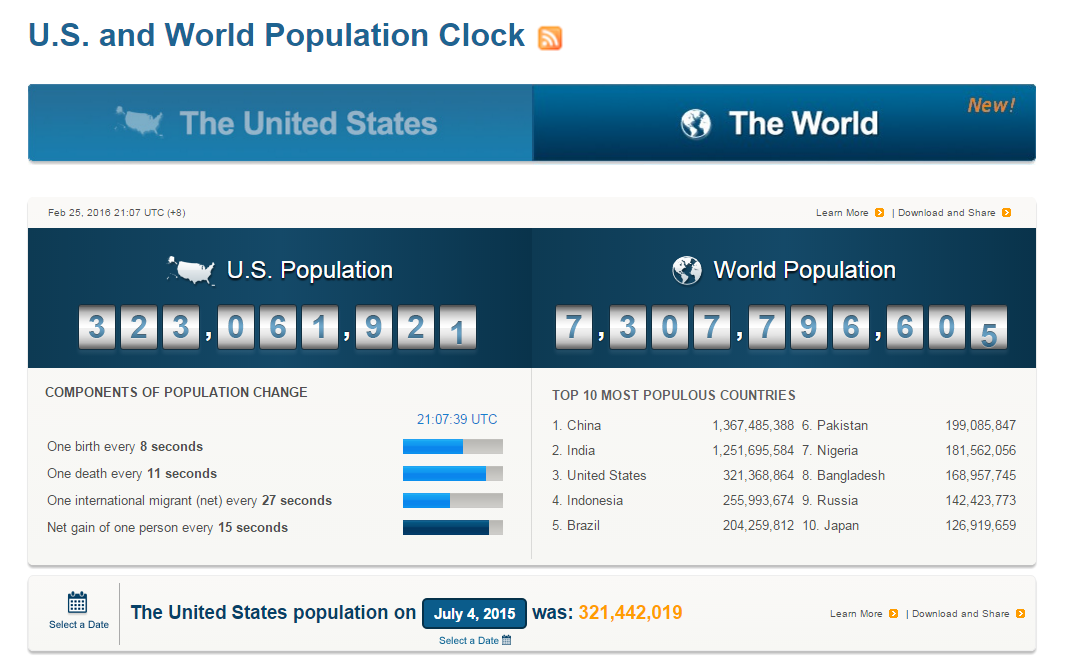
As it is now the beginning of March, the spring season is fast approaching. Across the fertile farmlands of the United States, farmers are preparing to seed their acreage for the 2016 crop year. In the world of agricultural commodities, each year is a new adventure. Mother Nature is the ultimate arbiter of crop yields that result in fall from the planting and growing seasons that occur during spring and summer. While it is possible to store commodities like metals, minerals, and energy for years, if not decades, agricultural staples are different. These commodities have limited shelf life as they will deteriorate or lose important nutritional value over time. Given population growth, demand for foodstuffs has grown exponentially over recent decades. With almost 7.4 billion inhabitants on planet earth, the world has become dependent on big crop yields.
The population clock highlights exponential growth. In years where there are shortfalls, like we saw in 2012, the prices of corn, soybeans, and wheat exploded higher.
Three Years of Bumper Crops
Since the drought of 2012, there have been three straight years of bumper grain crops. Crop yields for corn, soybeans, and wheat have been so good that supply has overwhelmed demand and inventories have steadily increased, in some cases to record levels. However, each year is a new adventure in the world of grain production and crop output over the past three years does not guaranty anything for the 2016 season. As we head into the spring planting season, all bets are off and it will be the weather that determines price action over the coming months.
Prospects for Corn
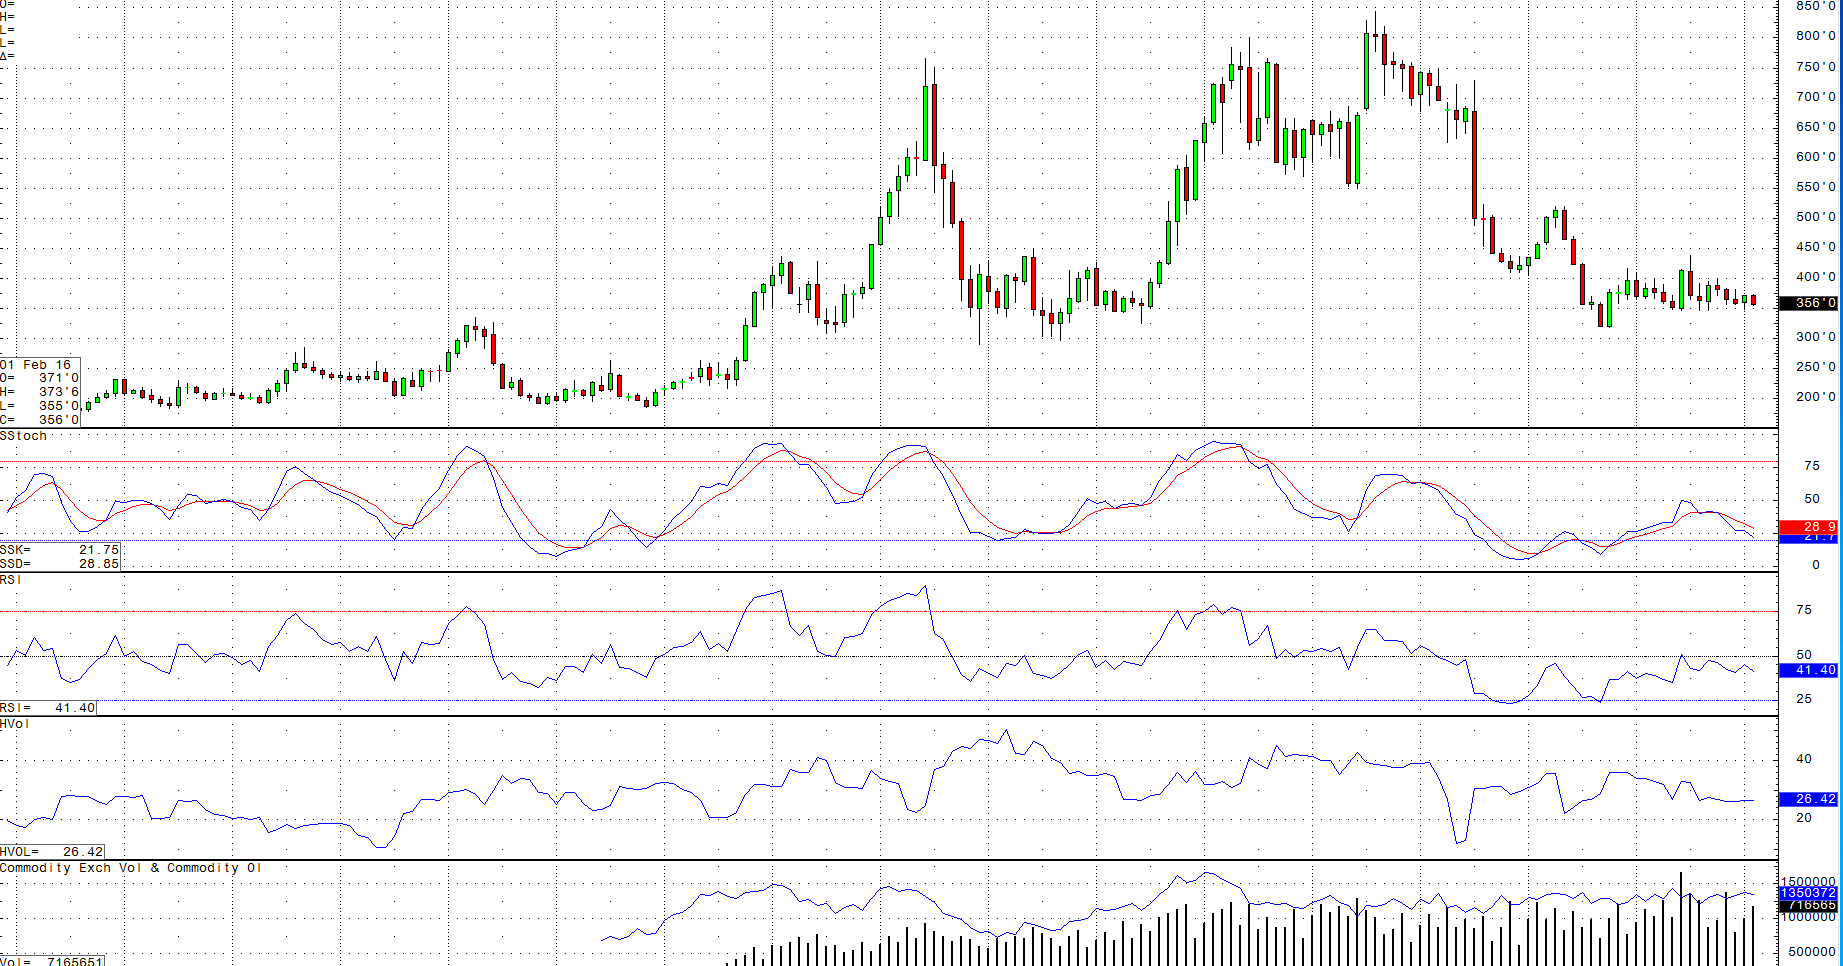
The price of corn traded to all-time highs of above $8.40 per bushel in 2012. Recently the price was around $3.60, some 57% below the highs just a few short years ago.
The monthly corn chart highlights the current price picture as we move into this new planting season. On the fundamental side, inventories remain high. The USDA recently told us that global corn production is expected to fall around 3.9% from last year to 970.1 million tons. The US is the world’s number one producer and exporter of corn. The US is likely to produce 345.5 million tons of the grain this year, which is down 4.3% since last year. Decreases in production are likely due to lower price,s which the USDA projects will trade between $3.35 and $3.85 per bushel.
Corn is the chief input in the production of ethanol in the US. The price of this bio-fuel has also fallen with the price of corn and other energies.
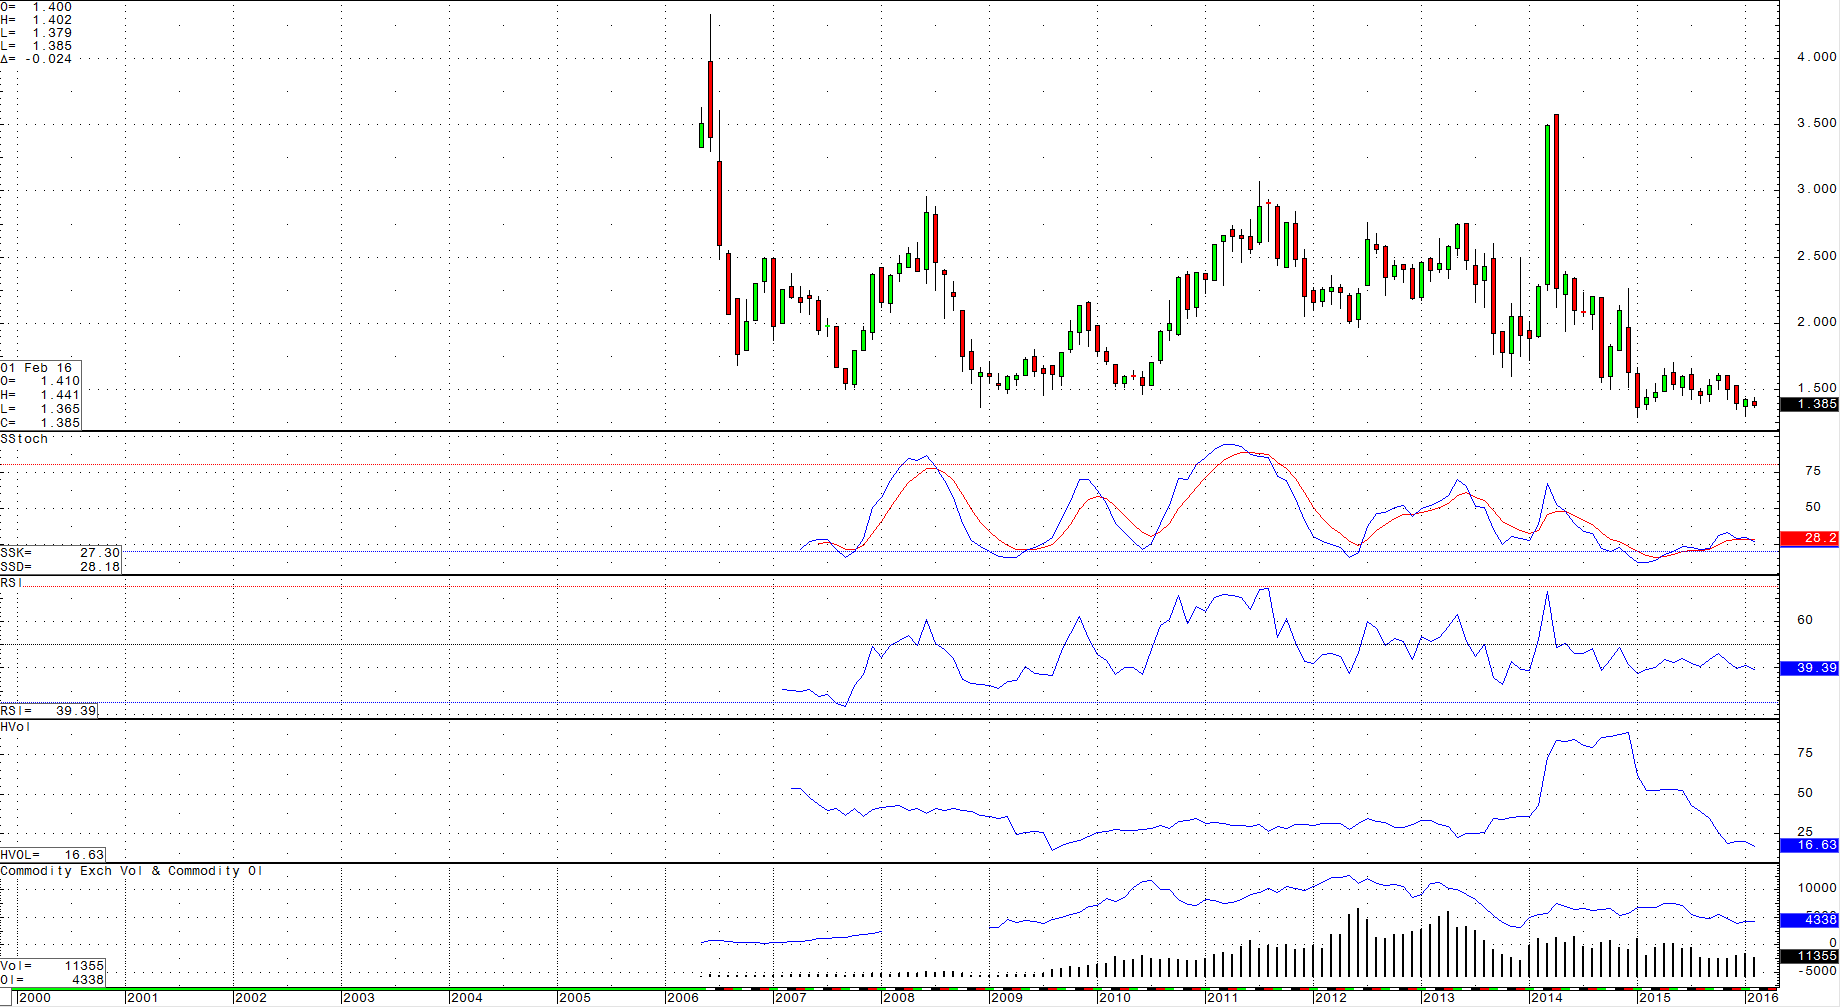
As the monthly charts of the ethanol futures contract highlights, ethanol prices have fallen from over $3.50 per gallon in 2014 to just under $1.40. This has put additional pressure on the price of corn.
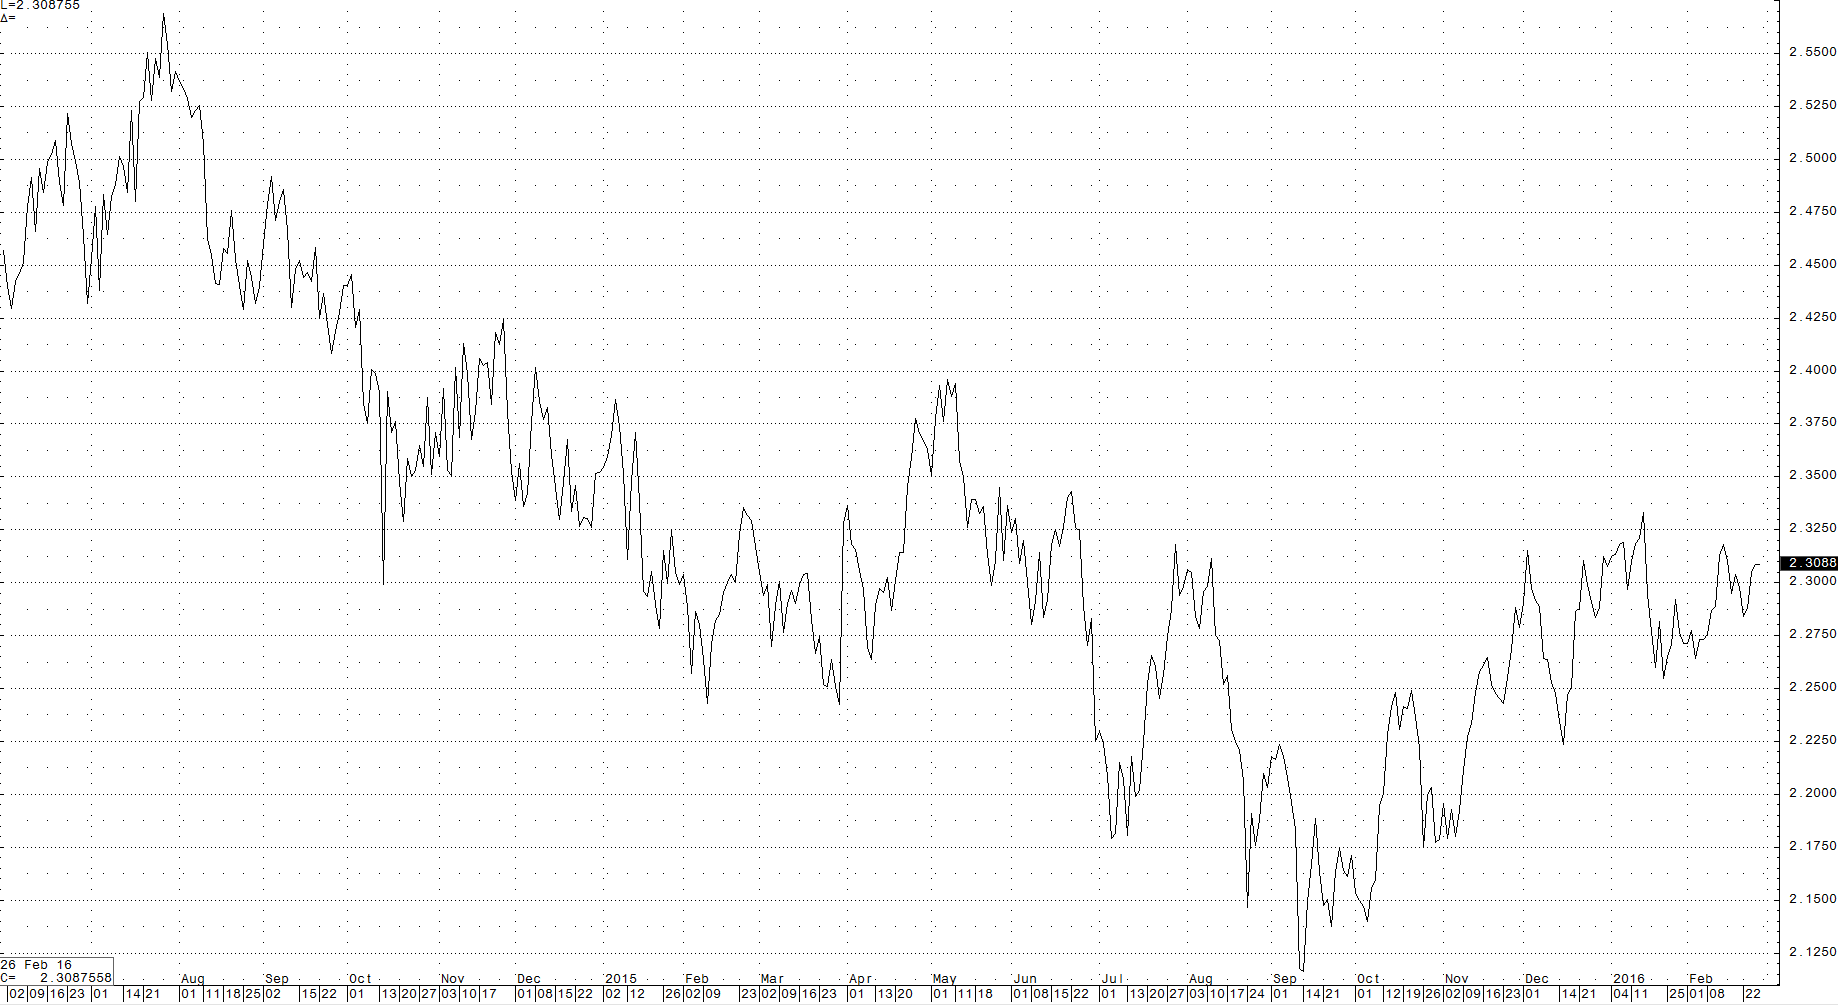
It is likely that farmers will plant more corn than soybeans this season as the new crop corn-soybean spread is trading below the long-term mean level of 2.4:1.
At the end of February 2016, this spread was trading around 2.3:1, which means that corn is more valuable than soybeans on a relative basis. Farmers are business people and as such, they tend to plant the crop that yields the best economic result for their acreage. This year it looks like corn is that crop. Therefore, we can expect another year of big corn planting in the US. This is not positive for the price of corn moving forward on a fundamental basis.
Prospects for Beans
When it comes to soybeans, the USDA in its most recent missive told us that world soybean production is estimated at 320.5 million tons for the coming year, which is an increase of 0.5% from last year. Like corn, the US is the world’s largest producer and exporter of beans and is expected to produce 107 million tons of the grain.
The USDA projects that the soybean price will range between $8.05 and $9.55 in 2016, which is down 13% from 2015 projections. The monthly chart highlights the bearish price action in beans over recent years corresponding with bumper crops.
Consumers do not buy raw soybeans, rather they consume soybean products: meal and oil, which are used for animal feed and cooking or food ingredients respectively.
The monthly chart of the synthetic soybean crush spread shows that the margins for crushing soybeans into products have decreased over recent years. This tells us that supplies of these products have increased and/or demand has decreased. This is not a positive sign for the price of soybeans as product prices translate to the very heart of demand fundamentals for raw beans.
Prospects for Wheat
Wheat production is ubiquitous compared with other grains. While the US is an important producer and exporter, it does not have the same position that it does in the corn and bean market. The USDA estimates world production of 735.8 million tons of wheat for the coming year, up only 0.1% from their last report estimate. The US will produce 55.8 million tons and Canadian production will be around 27.6 million tons. Canadian production will fall by 6.2% from last year due likely to lower price. Global wheat inventories now stand at record levels given the past three years of bumper harvests around the world.
The USDA has projected that wheat will trade in a range between $4.90 and $5.10 per bushel, which is down 16.5% from last year. However, wheat recently closed below that price and below the $4.50 level on the active month CBOT wheat futures contract.
Opportunity, but it is All about the Weather
As we plow into planting season in the US over the next few weeks, grain prices are trading at the lowest level in years. The price direction this year will depend on weather in key growing regions in the US and around the world. Given growing population, there are more mouths to feed every year; therefore, big crop yields become more and more important each new season. Keep your eyes on the weather this year in terms of identifying opportunities in these grain markets. Given current price levels, the downside is limited and the upside could be explosive if droughts, floods, or other unexpected weather or crop events present themselves during the growing season of 2016. Also, keep your eyes on the monthly USDA World Agricultural Supply and Demand Estimates Reports (WASDE). These reports tend to move agricultural markets when issued. The dates of these reports are as follows:
USDA WASDE Reports: Growing/Planting/Harvest season releases:
- March 9, 2016
- April 12, 2016
- May 10, 2016
- June 10, 2016
- July 12, 2016
- August 12, 2016
- September 12, 2016
- October 12, 2016


