In the world of commodities futures, crude oil is the most closely watched and heavily traded market. We are all oil consumers in some form as we drive cars, heat our homes during the cold season, buy products that travel in trucks powered by diesel fuel, fly on airplanes, and directly or indirectly utilize oil to power our daily lives. On July 31, 2017, the price of nearby NYMEX crude oil futures settled at $50.17 per barrel, which is a sweet spot for the energy commodity.
The $50 Pivot Point
In June 2014, the price of active month NYMEX futures peaked at over $107 per barrel. In mid-February 2016, the price declined to the lowest level since 2003, at $26.05. After trading to such extremes over recent years, crude oil settled into a trading range in 2017 with a pivot point at the $50 level. This $50 level has become a sweet spot for the energy commodity, perhaps because it is half the price it was in June 2014 and almost double the February 2016 lows. The bottom line is that it is a price with which both consumers and producers around the world can live after the extension of the recent year.
A New Low for 2017 in June
June was a tough month for the price of crude oil. The biannual meeting of OPEC at the end of May disappointed the market as the cartel did not further trim output and only extended production quotas to the end of the first quarter of 2018. Crude oil fell through the $50 per barrel level in late May and did not look back until the final day of July.

As the weekly NYMEX crude oil chart highlights, technical support for the energy commodity was at $42.20 per barrel, the November 2015 lows. On June 21, the price fell below that level by only 15 cents, but many analysts called for oil to keep falling, some looking for a decline below the $40 per barrel level. However, for those of us watching, oil products were screaming 'not so fast.'
Products Told Us That Oil Reached a Bottom
Individual consumers of energy rarely, if ever, buy raw crude oil as they purchase the oil products that power daily lives. Crack spreads represent the economics of processing a barrel of crude oil into gasoline and heating oil. Gasoline is perhaps the most ubiquitous oil product, given the number of people driving cars around the world each day. Heating oil is a distillate and has similar characteristics to jet and diesel fuels. Therefore, the rise or fall of product prices often signals the relative demand for oil, which is the primary input in the refining process.
In June, when oil fell to its lowest level of the year at $42.05 per barrel, the prices of oil products were outperforming the energy commodity.
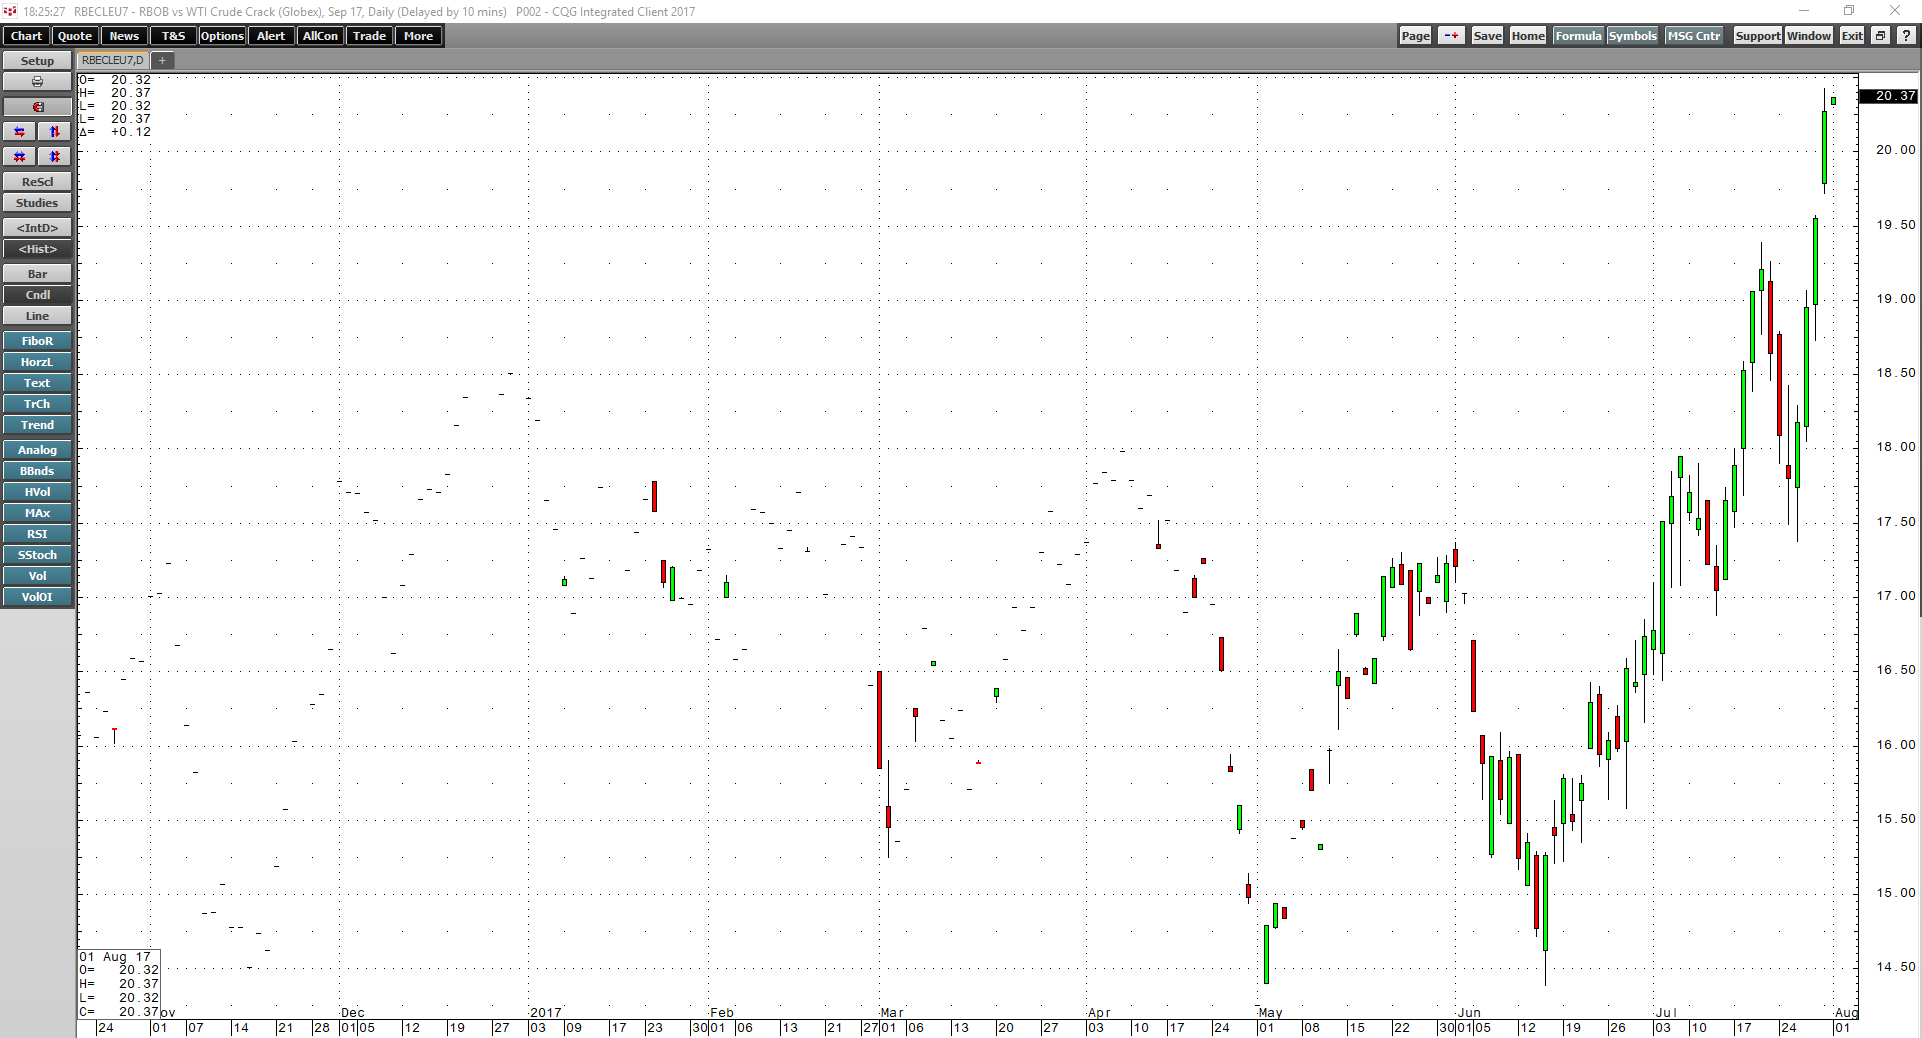
As the daily chart of the September gasoline crack spread illustrates, it hit a low of $14.39 per barrel on June 15, and by the time oil hit its low on June 21, the crack was already above $15.50 per barrel.
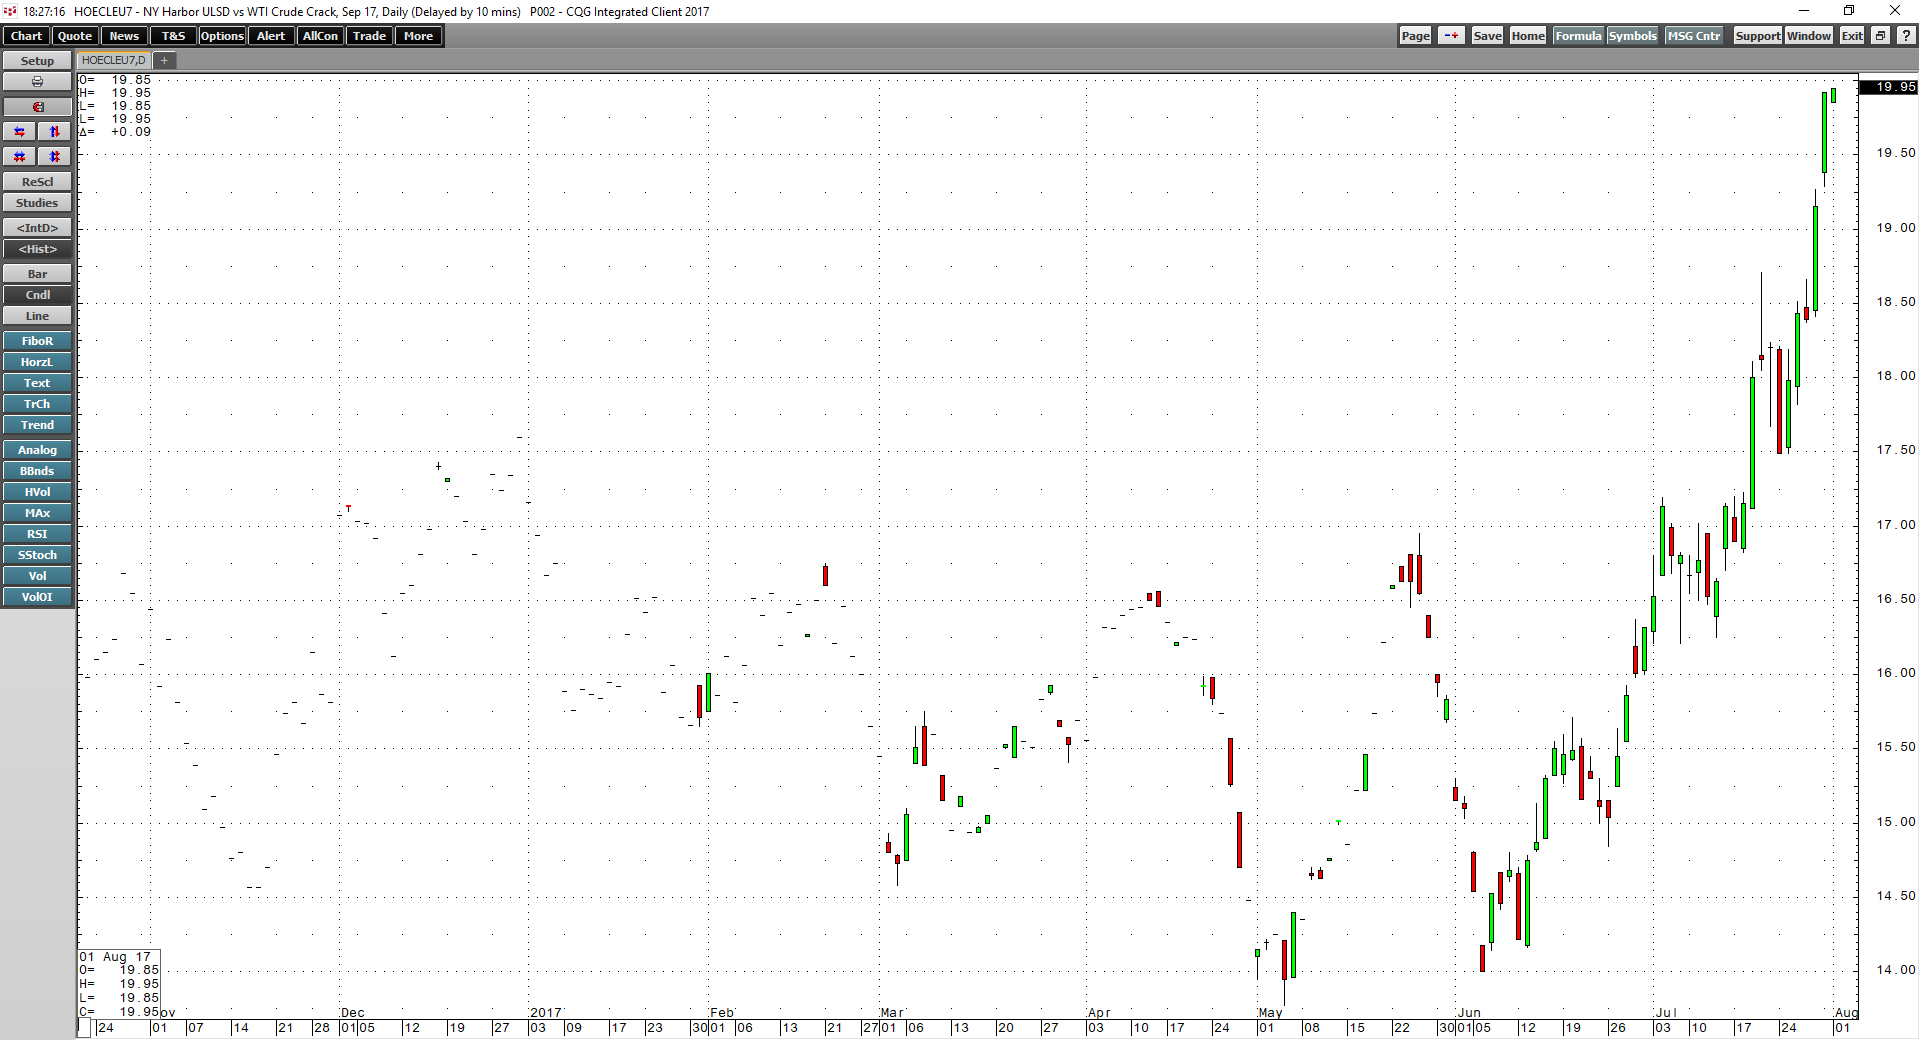
The heating oil crack spread hit its low at $14 even earlier on June 6, and the day that oil hit bottom, it was trading at over $15 per barrel. Oil products had outperformed the price of raw oil in a sign that demand increased at lower prices. The bottom line was that crack spreads told us that the downside in crude oil was limited in the low $40s.
Oil Bounces to $50
June 21 marked the lows for crude oil so far in 2017. The price reversed and turned higher over future sessions and continued to rally throughout July, reaching the $50 sweet spot on the final day of the month.
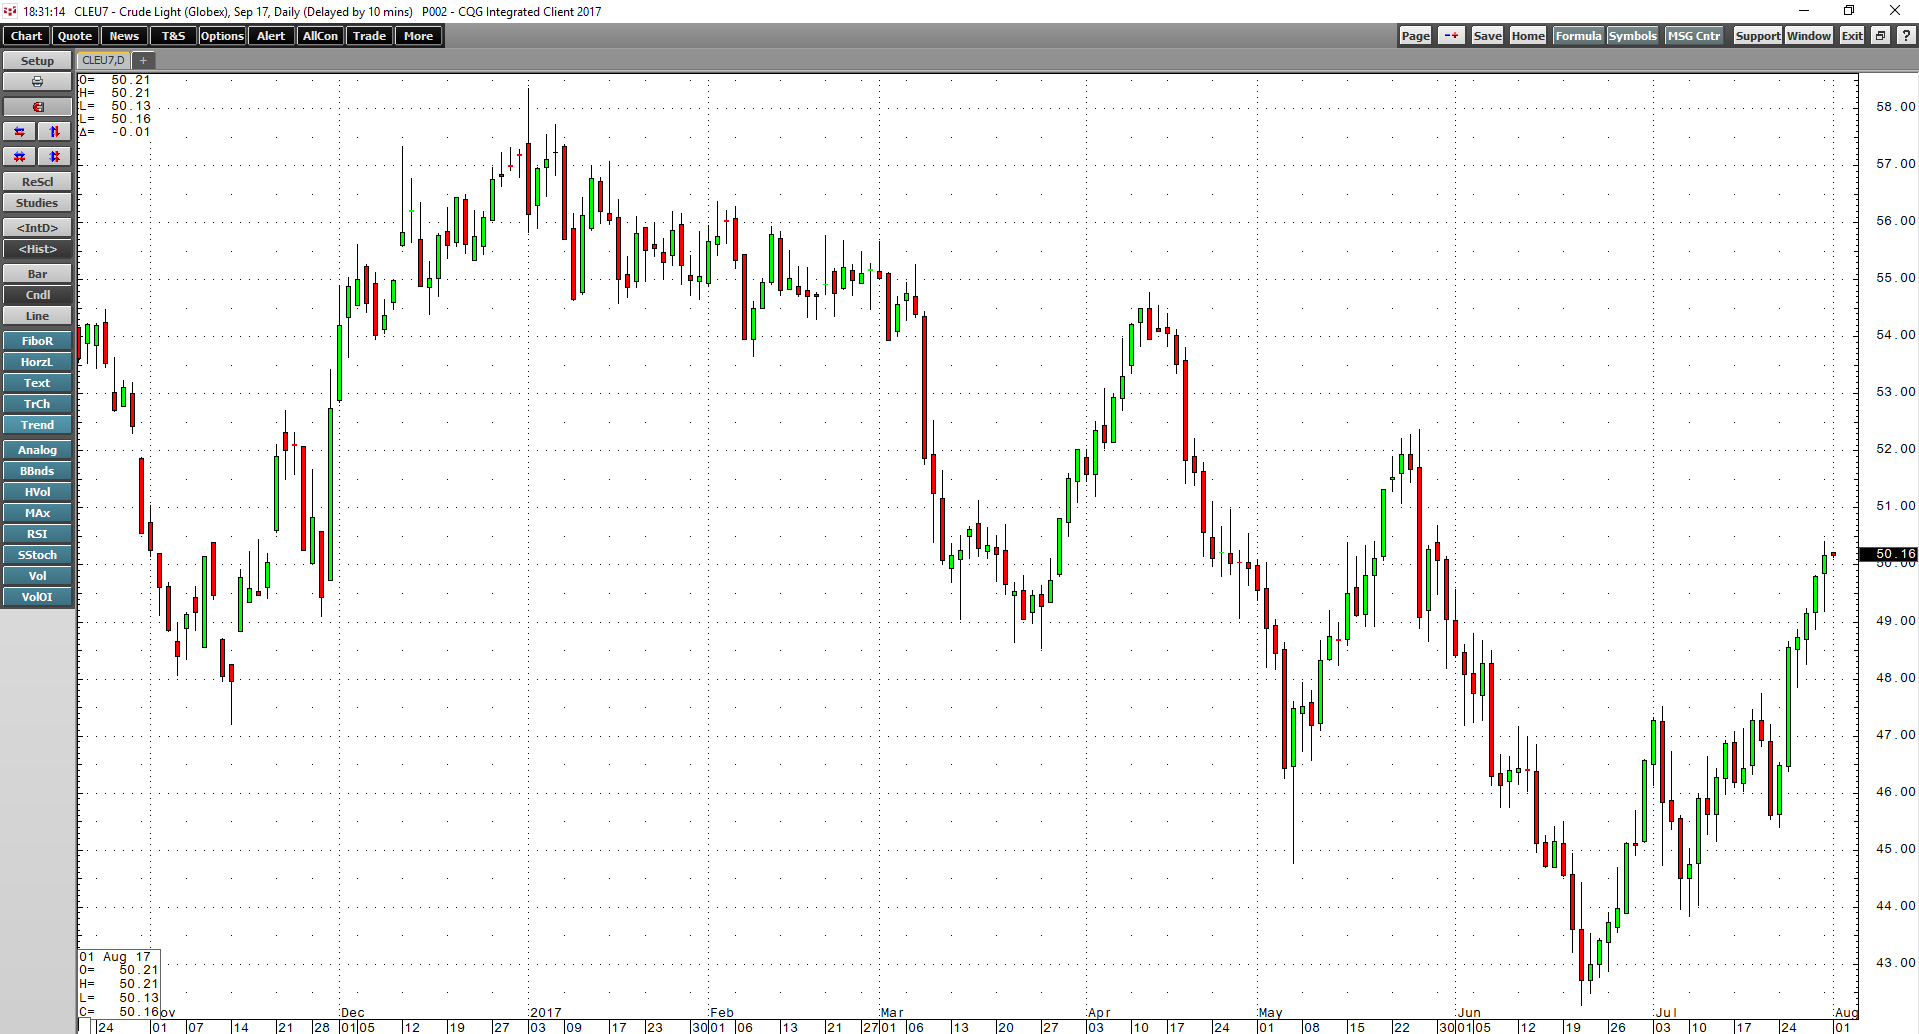
As the daily chart of NYMEX September crude oil futures shows, the price has rallied back to its pivot point. Technical resistance now stands at the May 25 highs of $52.38 per barrel. While crude oil has done yeoman’s work to get back to fifty bucks, products may still be telling us that the rally is not yet over. The gasoline crack spread surged to over $20, and heating oil cracks were just below that level on July 31. The cracks are a representation that the prices of oil products continue to outperform crude oil, even after its price recovery, which could bode well for a continuation of the July rally into August.
The Range for the Rest of 2017
Newton’s third law of physics states that for every action there is an equal and opposite reaction. In June, crude oil fell to the lowest price of the year at $42.05 per barrel, which was 15 cents below technical support at the November 2016 lows. If the price of oil were to now head to the same level when it comes to technical resistance, it would trade at $55.39 per barrel, 15 cents above the highs established in January of this year.
Crude oil has returned to its sweet spot and was trading at that level at the end of July. Momentum in the oil market remains bullish, and the price action in the product markets continue to support more gains in the price of the commodity that is the input in their production. Keep an eye on crack spreads; they are likely to help us when it comes to identifying the next high in the oil price.