Prices for the actively traded July 2021 CME Group soybean oil futures reached all-time new highs in recent trading sessions (see Figure 1), spurred by increasing demand from the biofuels industry, a big piece of President Biden’s call to cut carbon-emission levels in half by 2030. Further, according to the USDA’s May, 2021 monthly supply and demand report, the biofuels sector is expected to consume 12 billion pounds of soybean oil in the 2021-2022 marketing year (up from an estimated 9.5 billion in 2020-2021). ADM, Cargill and many others are increasing their soybean crushing production capacity in order to meet this increased demand.
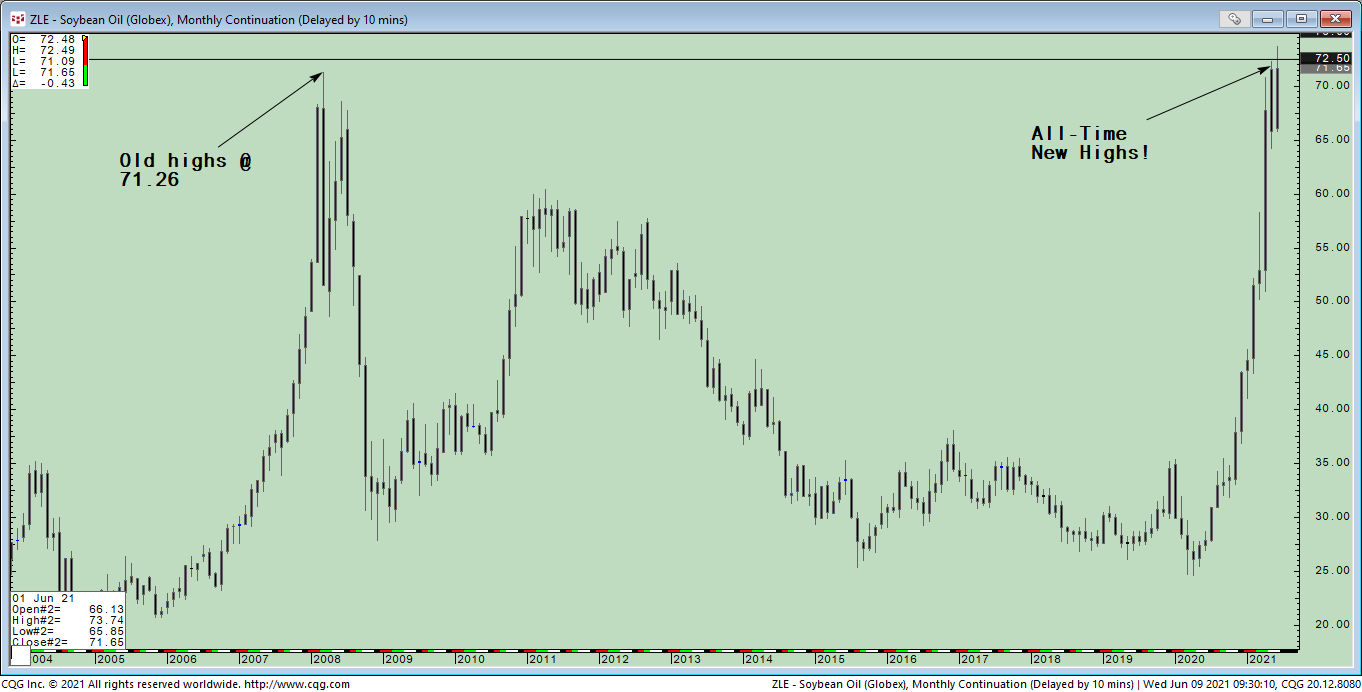
Figure 1. Monthly Continuation Chart for CME Group Soybean Oil
Despite this bullish news, so far, the market seems to be consolidating around the old 2008 highs (as opposed to sky rocketing higher). If biodiesel is truly to generate a paradigm shift in the value of soybean oil, then a speculative “play” would be to buy soybean oil and sell soybean meal. The formula used to chart this speculative trade is:((ZLE*11)/((ZLE*11)+(ZME*2.2)))*100.This formula allows us to examine the soybean oil share of the crush price versus oil and meal together (See Figure 2). In other words, a soybean oil share of 25% means that the remaining 75% of the crushed feedstock (soybeans) are coming from the price of the other by-product of soybeans, soybean meal. If we are experiencing a paradigm shift in soybean oil, then the oil share price of the crush spread should increase and the soybean meal share should decrease (accurately graphing the long oil/short meal products spread).
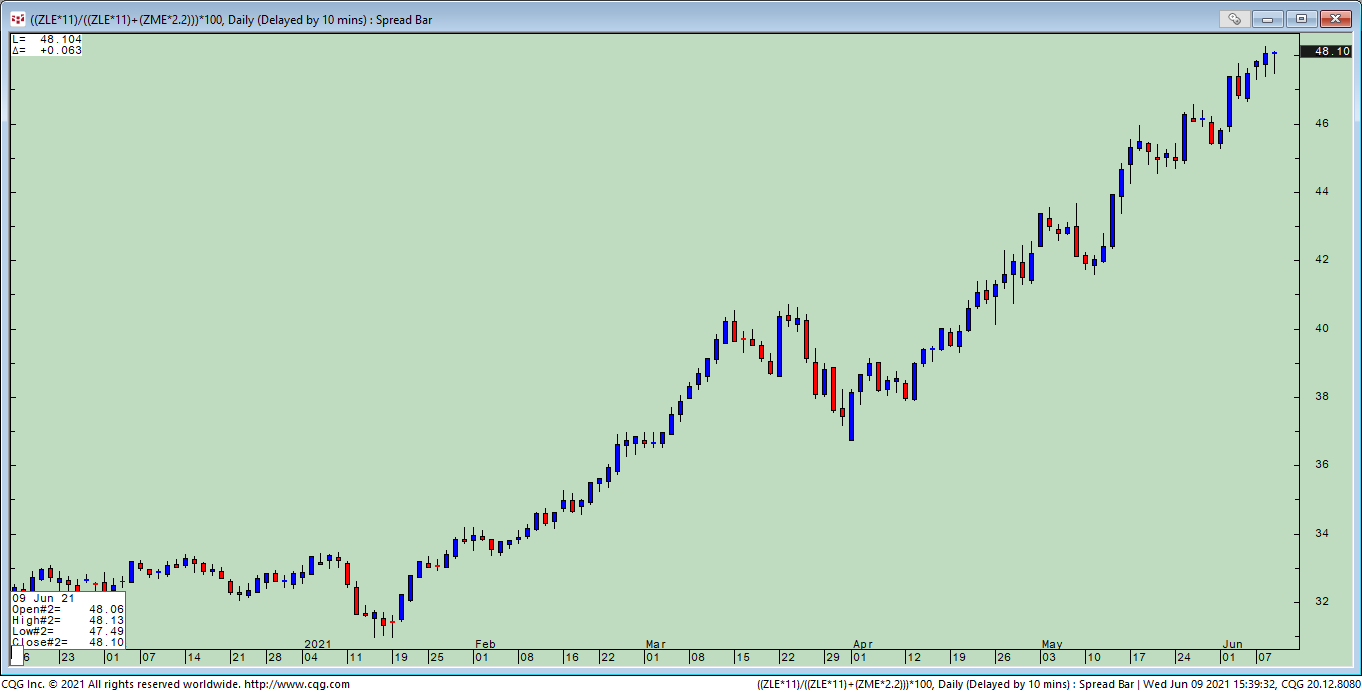
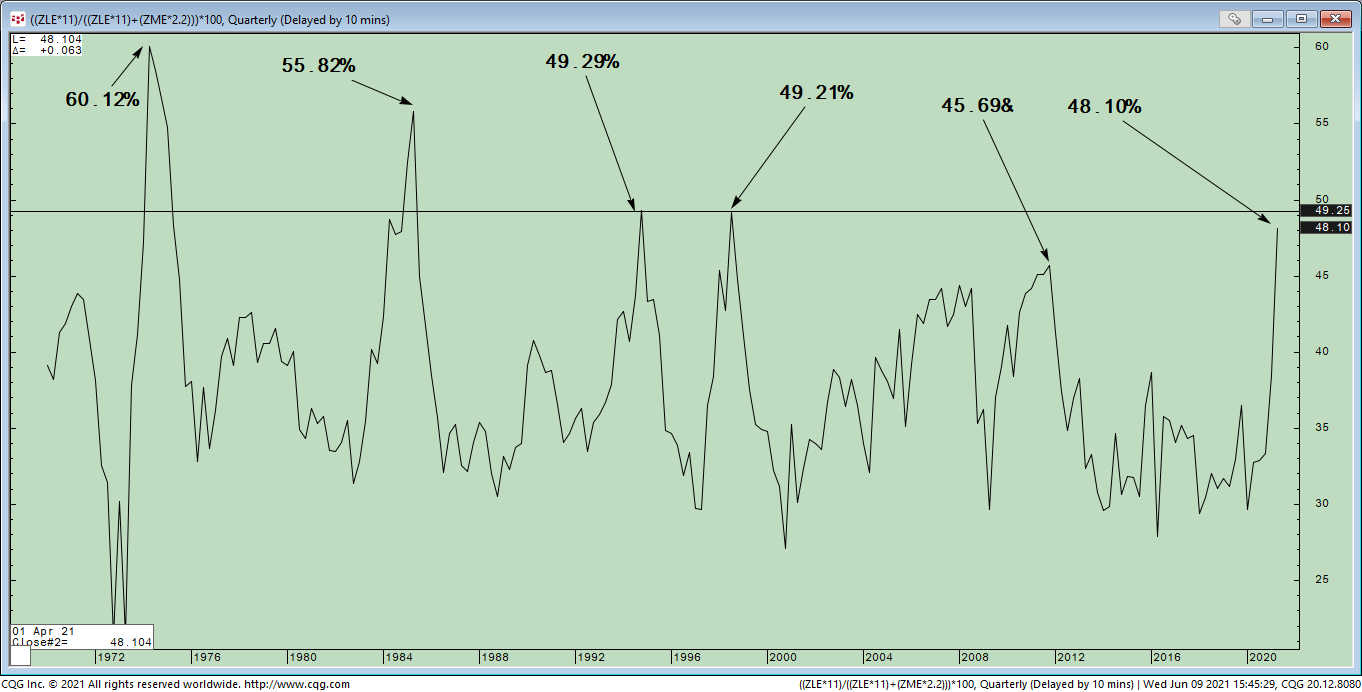
Figure 3. Quarterly spread chart of the Soybean Oil share of the vs. Oil + Meal