Each Wednesday this article will be updated with the current seasonal study using CQG’s Seasonal analysis applied to the Soybean, Wheat and Corn markets. You can download the CQG pac providing the studies and charts here.
Seasonal analysis is about price direction or the trend.
Soybeans
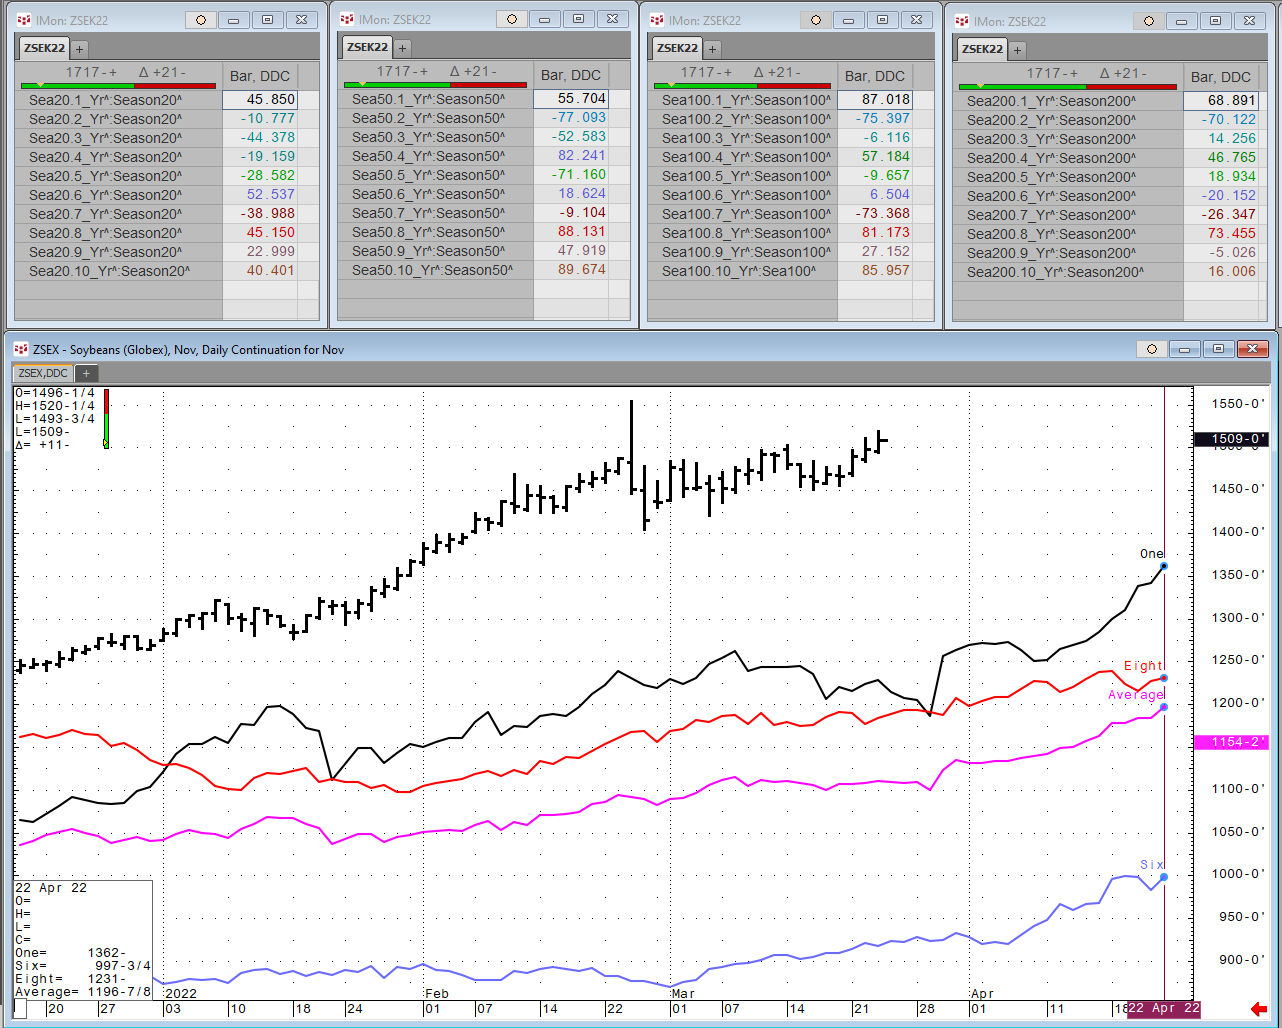
| Correlation Lookback (Days) | 20 | 50 | 100 | 200 |
| Seasonal Year Back with | 6_Yr | 8_Yr | 1_Yr | 8_Yr |
| the Highest Correlation | 52.58 | 88.13 | 87.02 | 73.46 |
Wheat
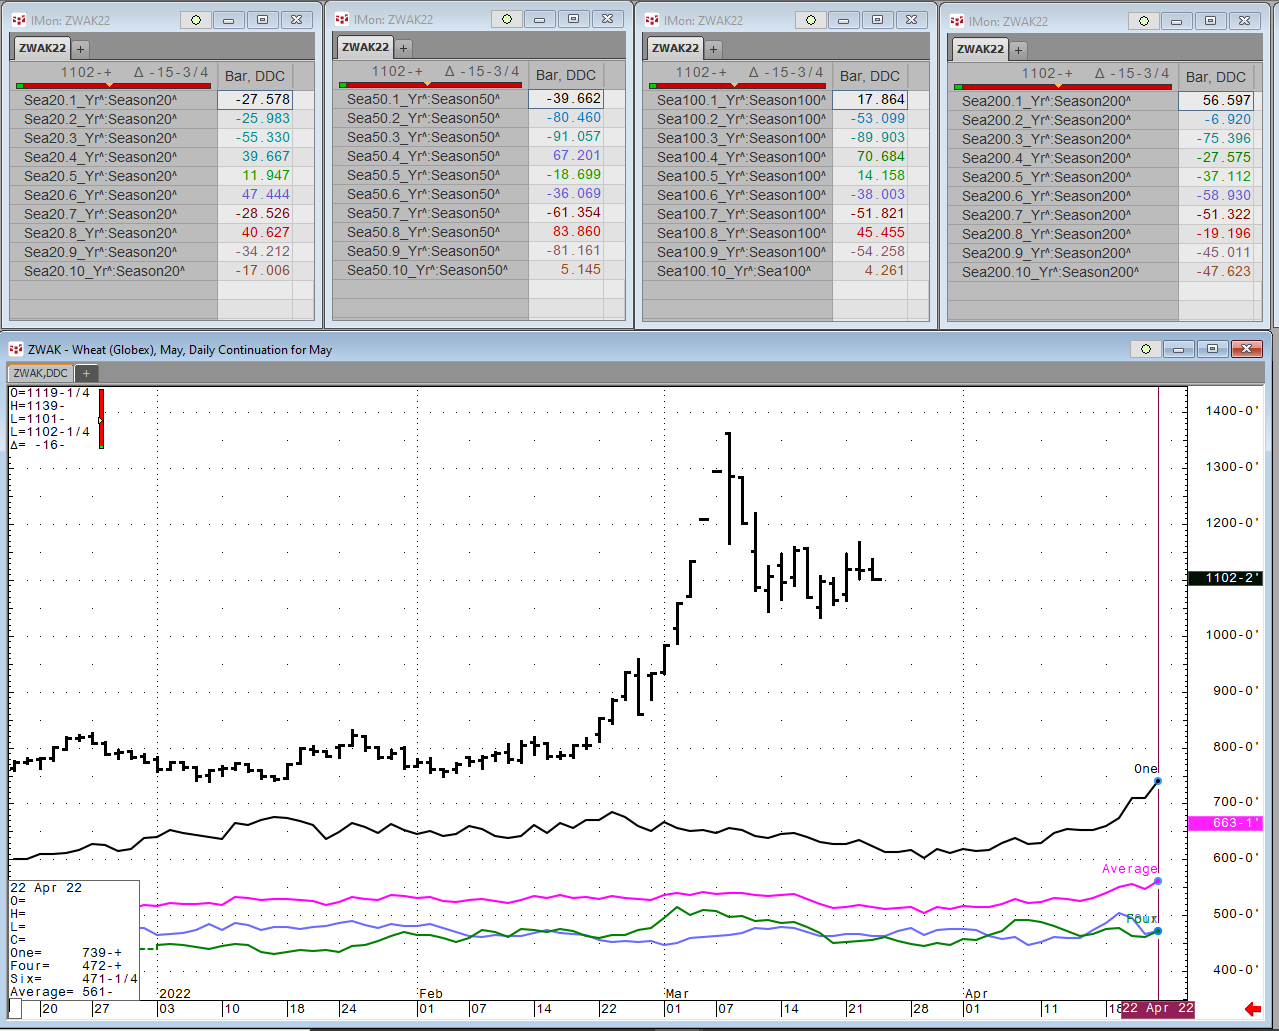
| Correlation Lookback (Days) | 20 | 50 | 100 | 200 |
| Seasonal Year Back with | 6_Yr | 4_Yr | 4_Yr | 1_Yr |
| the Highest Correlation | 47.42 | 70.65 | 70.64 | 56.58 |
Corn
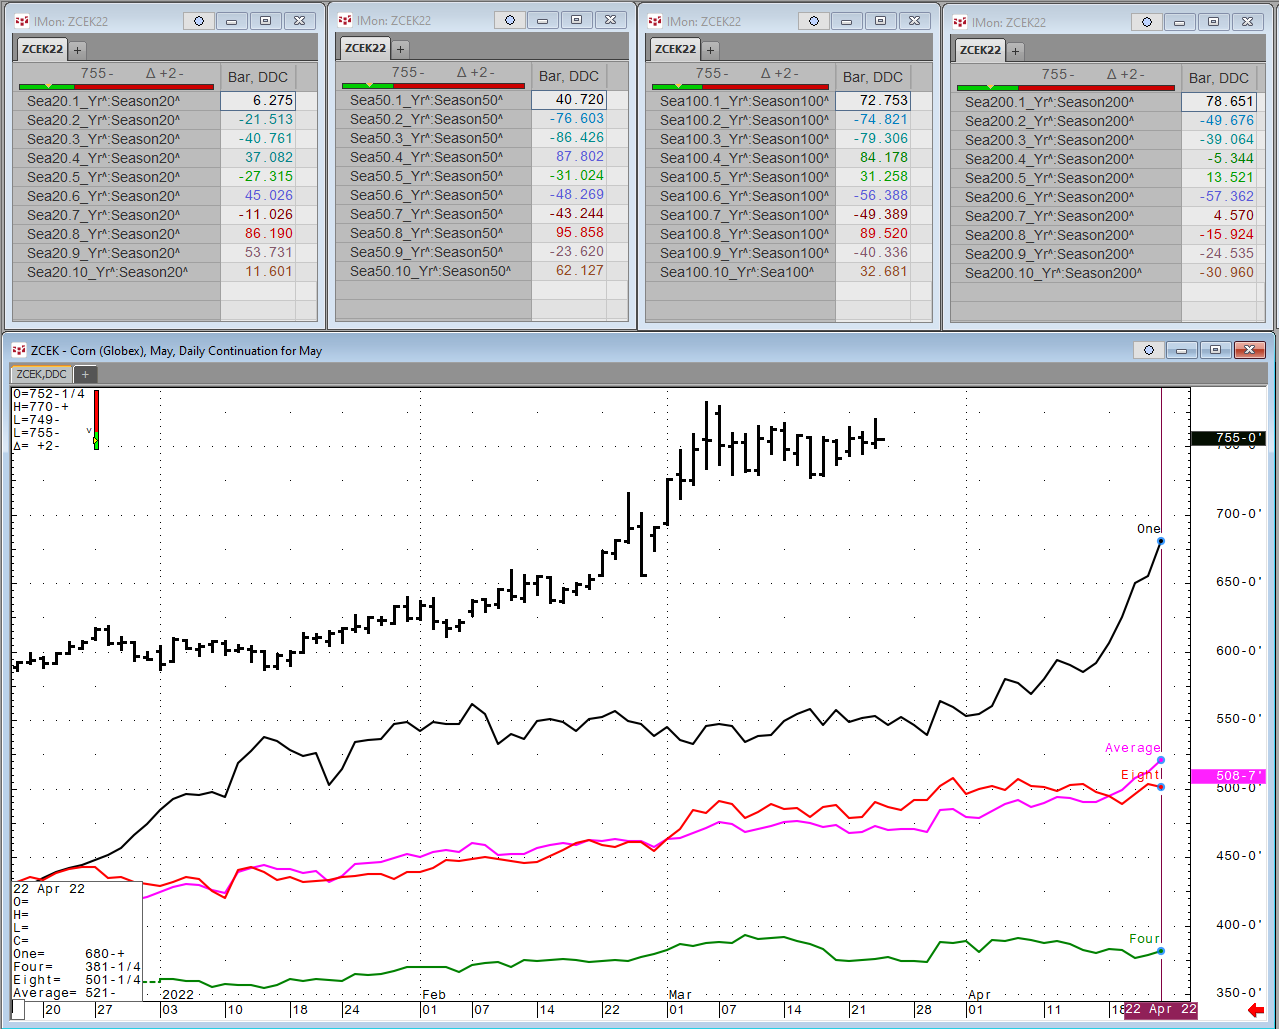
| Correlation Lookback (Days) | 20 | 50 | 100 | 200 |
| Seasonal Year Back with | 8_Yr | 8_Yr | 8_Yr | 1_Yr |
| the Highest Correlation | 86.25 | 95.86 | 89.52 | 78.65 |