In early March, crude oil prices rose to their highest levels since 2008 when nearby NYMEX futures rose to $130.50, and Brent futures hit $139.13 per barrel. While crude oil reached a fourteen-year high, oil products did even better, soaring to record prices.
The rallies came on the back of Russia’s invasion of Ukraine, causing concerns about global supplies. However, the energy commodity had already been moving steadily higher since the April 2020 lows when NYMEX futures fell below zero for the first time, and Brent crude oil dropped to the lowest price of this century.
Crude oil prices backed off the highs and have been digesting the multi-year peak. The price has been consolidating at over the $110 level, and one key indicator is screaming that the next leg higher that will challenge the 2008 record highs is on the horizon.
The real-time indicators of demand
Crack spreads reflect the margins refineries receive for processing one barrel of crude oil into oil products. Consumers directly or indirectly purchase oil products, including gasoline and distillates. Distillates include heating oil, jet, diesel, and other fuels.
West Texas Intermediate crude oil from the US and North America is a light and sweet petroleum, meaning it has a lower sulfur content than other crude oils. The WTI futures that trade on the CME’s NYMEX division is the preferred crude oil for gasoline refining. WTI is the benchmark pricing mechanism for approximately one-third of the world’s crude oil.
Meanwhile, Brent North Sea crude oil is the benchmark for two-thirds of the world’s petroleum. Brent futures trade on the Intercontinental Exchange. While Brent is also a light sweet crude oil, it has a slightly higher sulfur content than WTI, making it more efficient for processing into distillate products.
Higher crack spread prices often reflect rising demand for crude oil products, and when they decline, it is a sign of weakening demand.
The gasoline crack spread reached a new record high
Gasoline futures prices have risen to new all-time highs in 2022, and the refining margin for processing a barrel of crude oil into the fuel did the same.
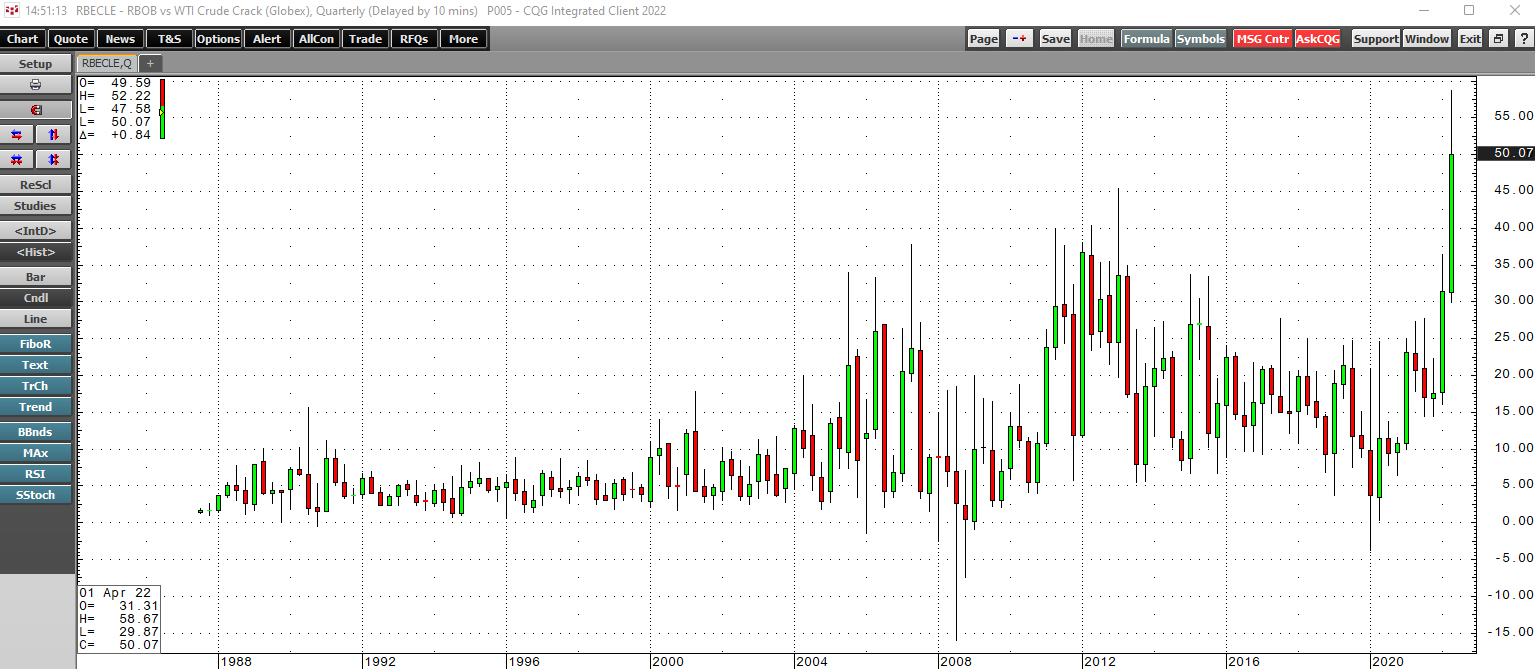
The quarterly chart highlights the bullish trend in the gasoline crack spread that took it to an all-time high of $58.67 per barrel in May. At just over the $50 per barrel level on May 31, the gasoline crack remains above the previous 2013 $45.40 per barrel record peak.
Consumers are paying more at the pump than ever before. State and Federal gasoline taxes only exacerbate the sky-high prices. In California, a gallon of gasoline costs over $7 in some areas. While gasoline price has exploded higher, distillates are even more expensive.
The distillate crack did the same
OPEC and Russian production use the Brent benchmark. The war in Ukraine, sanctions on Russia, and Russian retaliation has caused Brent prices to trade at a premium to WTI crude oil futures. As of May 31, August Brent crude oil commanded a $3.72 per barrel premium to WTI crude oil for August delivery.
Meanwhile, the war has caused shortages of Brent crude oil to develop as OPEC+ policy is squeezing US, European, and worldwide consumers. Heating oil futures are distillates and serve as a proxy for other distillate fuels like jet and diesel fuels. The heating oil crack spread exploded higher in 2022.
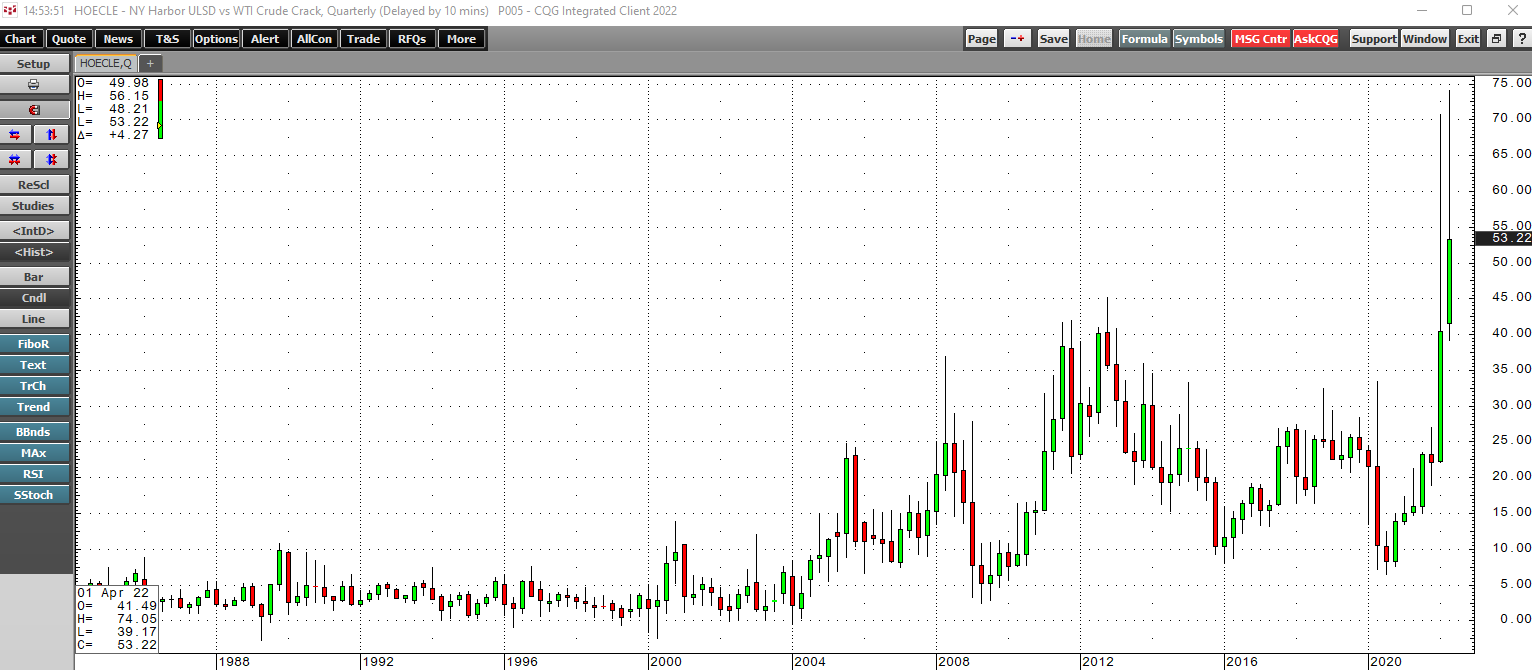
The chart shows the rise in the distillate crack spread that took the refining margin to $74.05 per barrel in May 2022. The previous high was at the $45.12 level in 2012. At $53.22 per barrel on May 31, the distillate crack remained above the prior all-time high.
Crack spreads are a real-time indicator of the demand for crude oil, the input in the refining process. They are also an indicator of refinery earnings. As the crack spreads support their earnings shares of companies like Valero Energy (VLO) and Marathon Petroleum (MPC), leading US refiners, reached record highs last week.
Crude oil is consolidating
Crude oil prices reached the highest price since 2008 when nearby NYMEX WTI futures reached $130.50 in early March 2022.
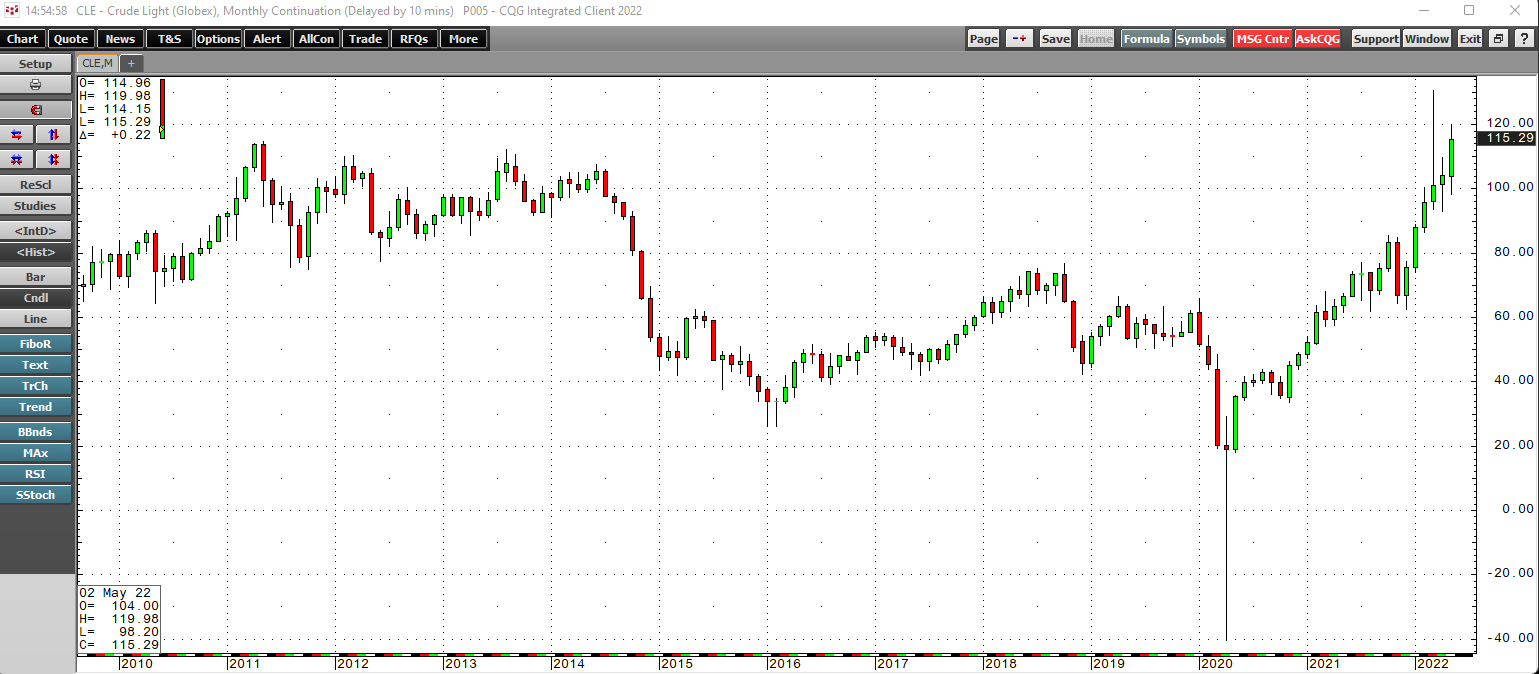
The chart shows WTI futures corrected from the early March high, probing below the $100 per barrel level in April and May. However, the trend of higher lows since April 2020 remained firmly intact. NYMEX WTI for July delivery settled at over the $114 per barrel level on May 31. Crude oil is digesting the move to over $130 per barrel and is consolidating with prices trading at well over the $100 per barrel level.
At the end of May, July Brent futures settled at the $122.84 level, at a premium to the WTI petroleum futures. The August Brent futures were at over the $116 per barrel level.
Look out above
Crack spread levels are screaming that the demand for crude oil products remains robust, and higher highs in the energy commodity that powers the world are on the horizon. US energy policy supports alternative and renewable fuels and inhibits fossil fuel production and consumption, and the geopolitical landscape supports higher crude oil prices. In May, US President Biden said that the US is undergoing a painful but necessary transition away from hydrocarbons in the quest to address climate change.
The fact is that fossil fuels continue to power the world, and a transition to a greener energy path will take years, if not decades. In May, Saudi Aramco surpassed Apple as the publicly traded company with the world’s largest market cap. The bottom line is that crude oil prices continue to be in a bull market, with geopolitical dynamics and supply-demand fundamentals supporting higher prices. The upside target for WTI is the 2008 $147.27 record high and the 2008 $147.50 peak for Brent crude oil. The oil market could be looking down at those levels as technical support over the coming months. Crack spreads tell us that new record high oil prices are coming soon.