- A bullish trend since the 2020 low
- Silver rises to the highest price in fourteen years- The 2011 and 1980 highs are the upside targets
- Fundamentals support higher silver prices
- Gold supports rising silver prices
- Expect volatility and new highs as investment and speculative demand are critical
At the turn of this century, nearby COMEX silver futures prices were $5.413 per ounce. After trading as low as $4.02 in November 2001, silver prices began a slow ascent, reaching $49.82 a decade later, in April 2011. The 2011 peak was slightly below the record 1980 high at $50.32 per ounce.
Silver corrected from the 2011 high, but the price remained above the $10 level, trading to a low of $11.64 in March 2020 as the global pandemic weighed on prices across all asset classes. Silver quickly recovered, rising to over $20 four months later in July 2020.
In September 2025, silver futures are closing in on a challenge to the 2011 and 1980 peaks, and all signs indicate that those levels could soon become technical support rather than resistance.
A bullish trend since the 2020 low
The continuous COMEX silver futures contract reached a low of $11.74 per ounce in March 2929 as the global pandemic gripped markets across all asset classes.
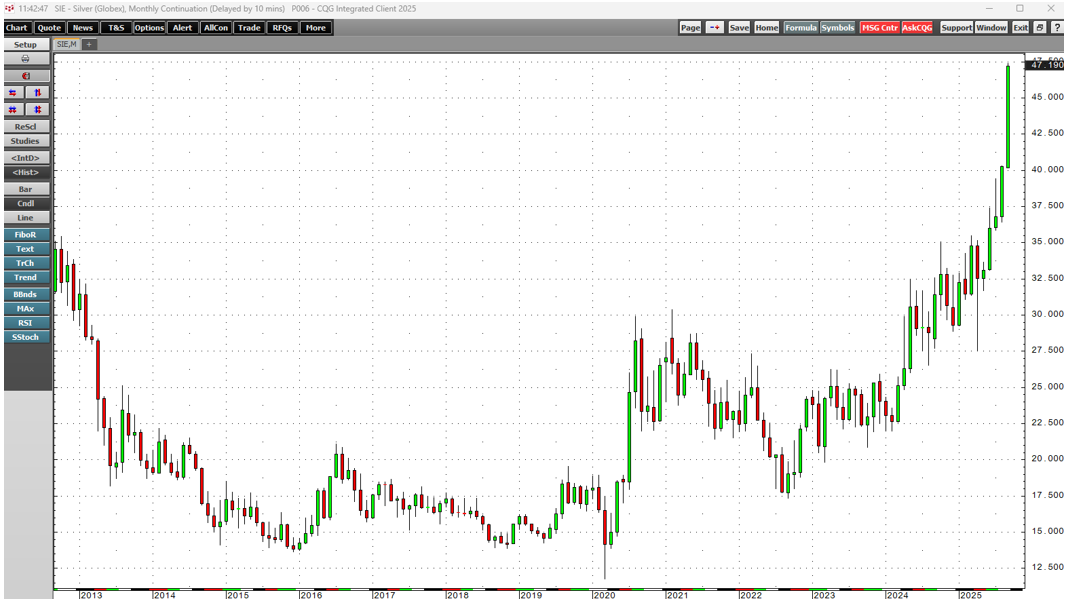
The monthly chart highlights silver's bullish trend, taking the price to its most recent high of $47.410 in September 2025.
Silver rises to the highest price in fourteen years - The 2011 and 1980 highs are the upside targets
The long-term chart indicates that silver's bullish trend is approaching a challenge of significant technical resistance levels.
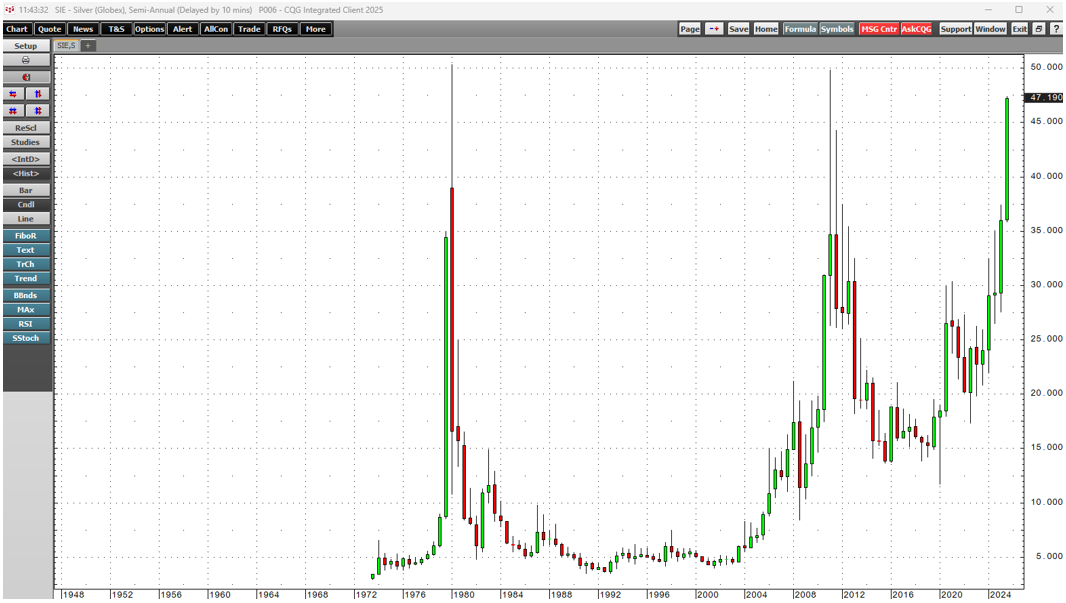
The semiannual chart shows that silver prices have reached the highest level since 2011, when the precious metal reached $49.82 per ounce. Above there, the 1980 record high of $50.36 is the ultimate technical target.
Fundamentals support higher silver prices
The Silver Institute, a trade organization, in its April 2025 World Silver Survey, forecast a 117.7 million ounce fundamental deficit for 2025, with demand outstripping supplies. In 2024, the silver market experienced a 149-million-ounce deficit, and 2025 is the fifth consecutive year when demand exceeds supplies.
While silver industrial demand is growing, one of the most significant factors for the path of least resistance of silver prices is investment and speculative demand. Silver's technical breakout above the February 2012 high of $37.58 per ounce has likely increased investment and speculative demand, causing the 2025 deficit to increase above the Silver Institute's April 2025 estimates.
Gold supports rising silver prices
Gold and silver are sister metals. While gold is a reserve asset, replacing the euro as the second-leading asset held by worldwide central banks, few central banks, governments, and monetary authorities own silver as a reserve asset due to its price volatility and speculative nature. However, with thousands of years of history, silver prices tend to follow those of gold.
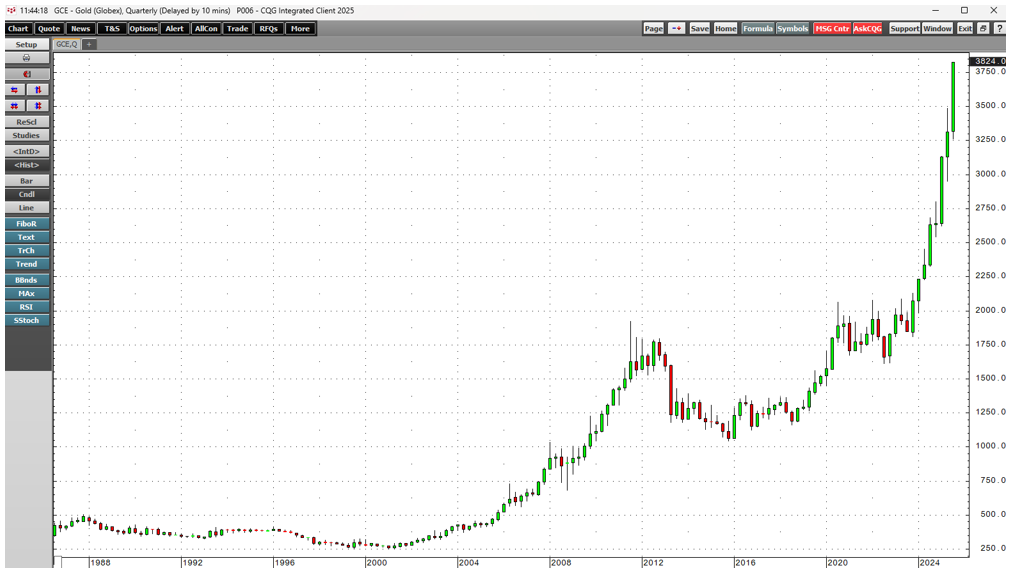
The quarterly chart illustrates gold's bullish and parabolic price action, which has driven the leading precious metal to new highs for the past eight consecutive quarters. Gold's most recent high was above the $3,825 per ounce level, which is amazing considering it began this century below $300 per ounce.
The silver-gold ratio measures the value of silver relative to gold.
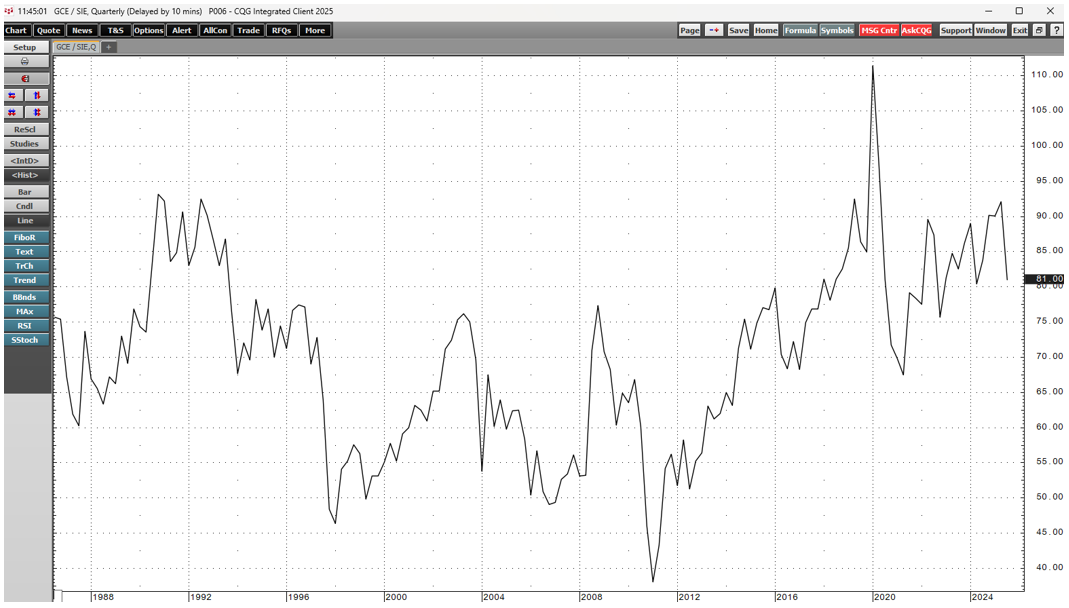
The quarterly continuous chart of COMEX gold futures divided by COMEX silver futures shows that after trading to a 2020 high of nearly 111.5 ounces of silver value per ounce of gold value, the ratio has declined to around the 81 level in late September 2025. The bearish price action reflects that silver prices are catching up with gold prices.
Expect volatility and new highs as investment and speculative demand are critical
Silver prices tend to be far more volatile than gold prices.
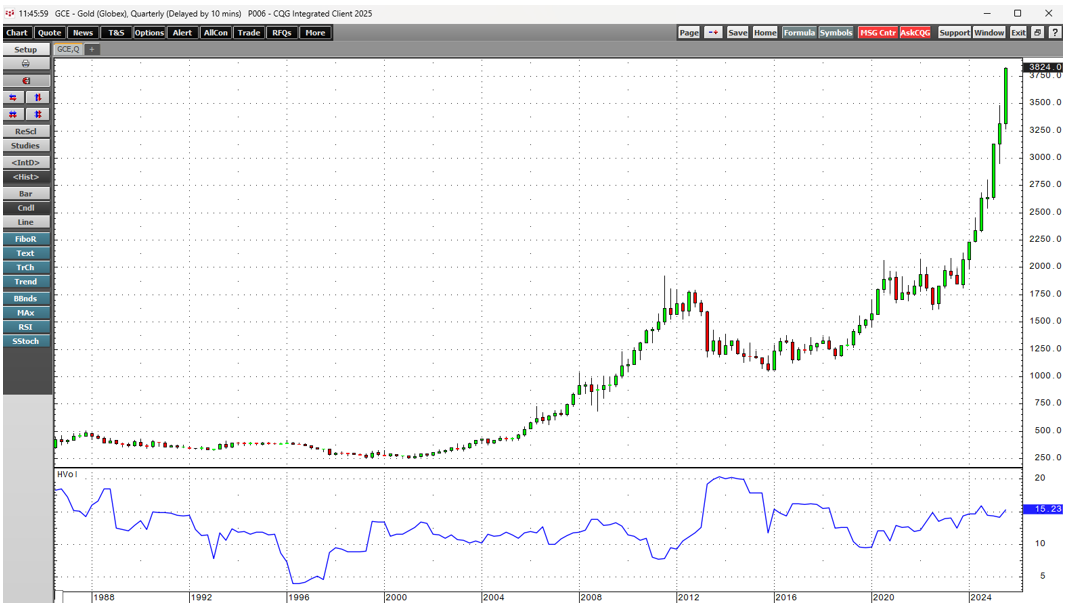
Quarterly historical volatility in gold is at the 15.23% level.
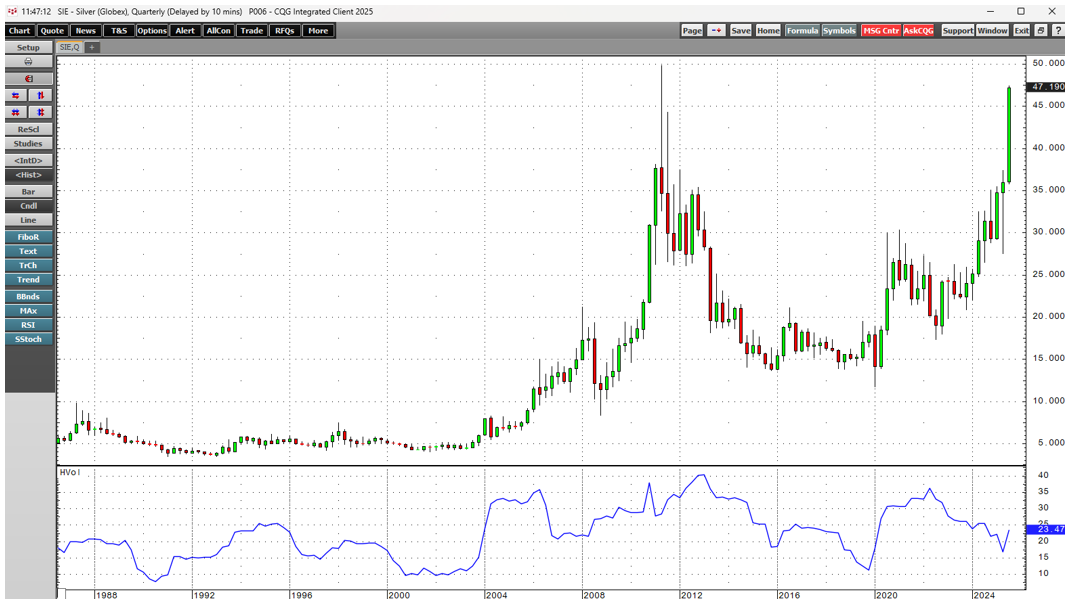
Silver's quarterly historical volatility of nearly 23.47% indicates that silver prices experience significantly greater price swings. In late September, the monthly gold historical volatility was 13.87%, compared to 26.56% for silver. The weekly measure for gold was 10.82% and for silver, it was 18.53%.
Silver appears to be on an express train to challenge the highs and critical technical resistance levels from 2011 and 1980, supported by technical and fundamental factors. However, higher volatility in the silver market suggests that the road higher could be choppy. Therefore, buying silver on price weakness is likely the optimal approach.