Within my role at CQG, one of the primary was to assist customers in Building Systems. Very quickly it became apparent that the vast majority placed most of the emphasis on the entry point and then built the exits and risk management around it. This always seemed non-sensical to me as my experience of being a Market Maker in the highly volatile Fx and Precious markets back in the 80s, was that I had little or no control of my entry point and invariably would just keep on getting hit on the same side. This meant that risk and position sizing was far and away the most important aspect and I built some short-term technical tools to aid me in whether I should hedge immediately or not.
This knowledge and the Systems I was asked to build created some ground rules and conclusions.
- It is extremely difficult to build a trading model that is all things to all market conditions and markets.
- In an automated environment, this need not matter as the costs and logistics of deploying multiple models, across multiple markets in multiple timeframes are acceptable.
- Therefore, instead of looking for a single silver bullet, be prepared to accept a fistful of lead ones.
Potential traps and pitfalls
- Over fitting – curve fitting models to history which is easy when fixated on the entry point. Making many small changes to variables or adding layers of code to improve the results
- Optimisation abuse – balancing capital on a pin. Trade System Optimizer will check
- Sequences – dependence upon a certain order. Monti Carlo Testing will confirm or deny
- Synchronicity – keeping in step. It's surprisingly easy to build code around something that hasn't happened yet. If the results look to good to be true, they probably are. Use Training Mode on the system to check.
Diversification is the Key
- By Timeframe – applying the same model logic across multiple timeframes
- By Parameter – combining different parameter sets for the same model
- By Model – combing models based upon methods that have non (or lowly) correlated returns. Trend Following, Reversal and Sideways
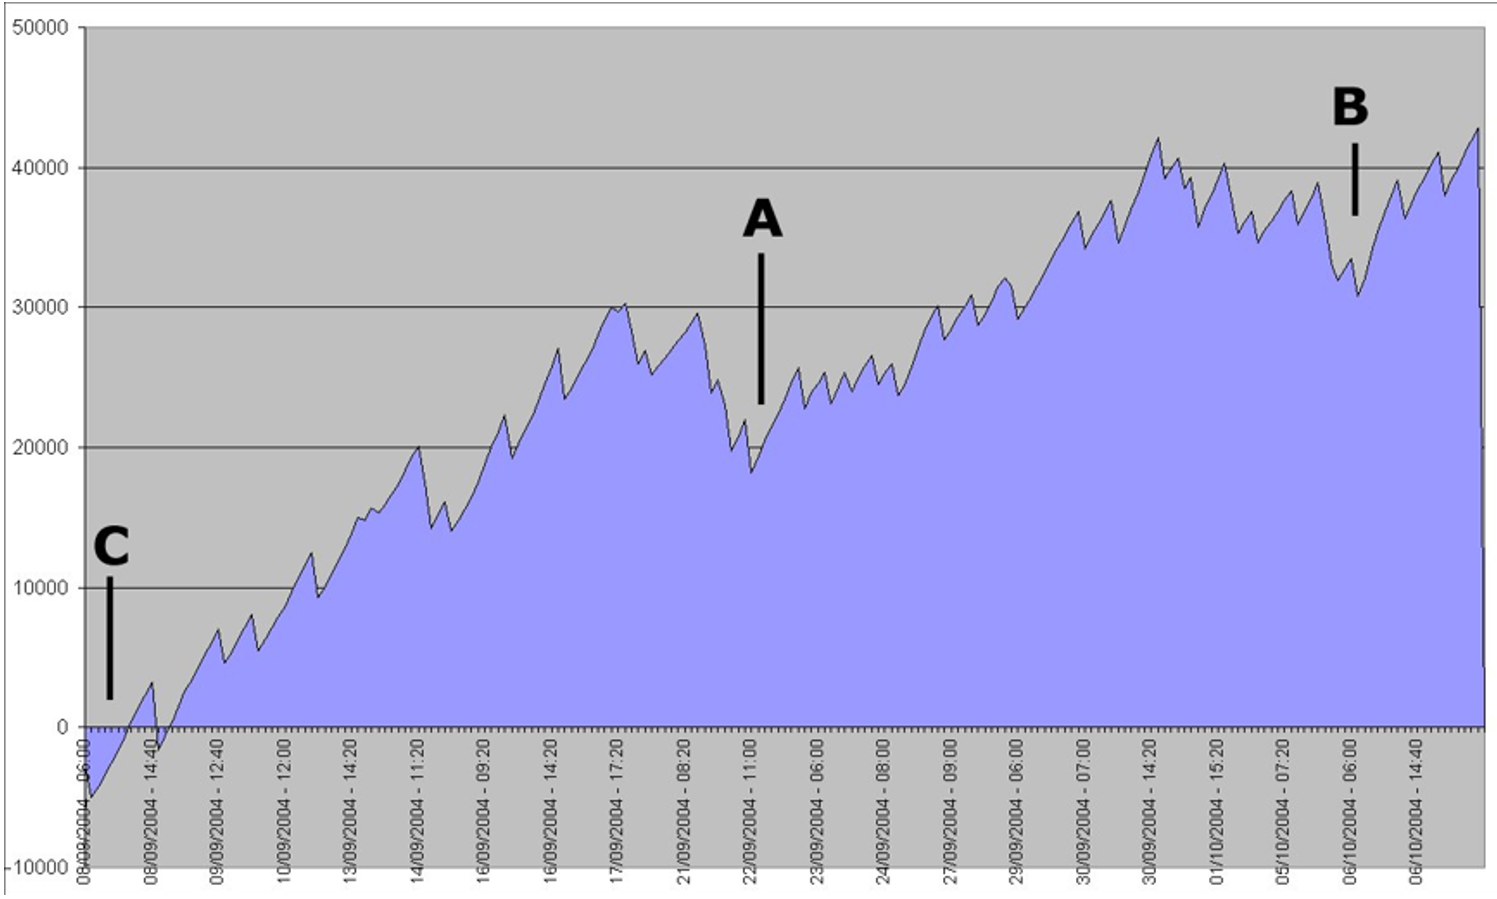
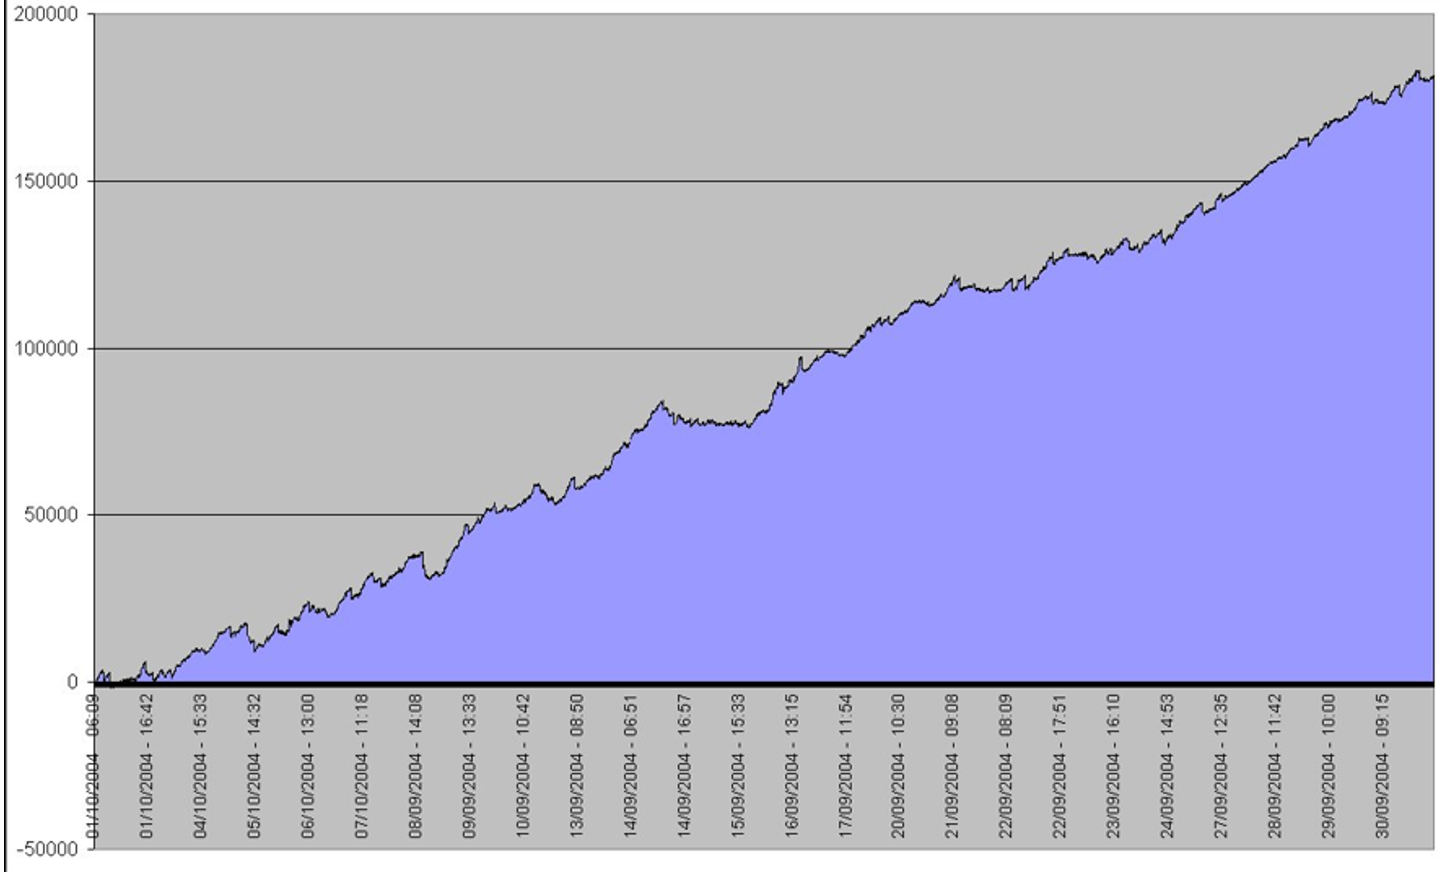
The chart below is the P&L of a 20-minute system on Cable. Note there are three drawdown periods.
Adding the same logic to a 1 Minute chart smooths the curve out and increases overall profit.
Trend and Sideways Model. Neither survive on their own but complement each other. The Sideways system is very simple. It takes the entry of the 5,3,3 Slow Stochastic crossing over, applies a tight money management, but larger profit target and Time-Based Exit. The sensitivity of the Slow Stochastic also acts as a Stop and Reverse. Note that there are only 4 elements. The simpler the system, the easier it is to understand it.
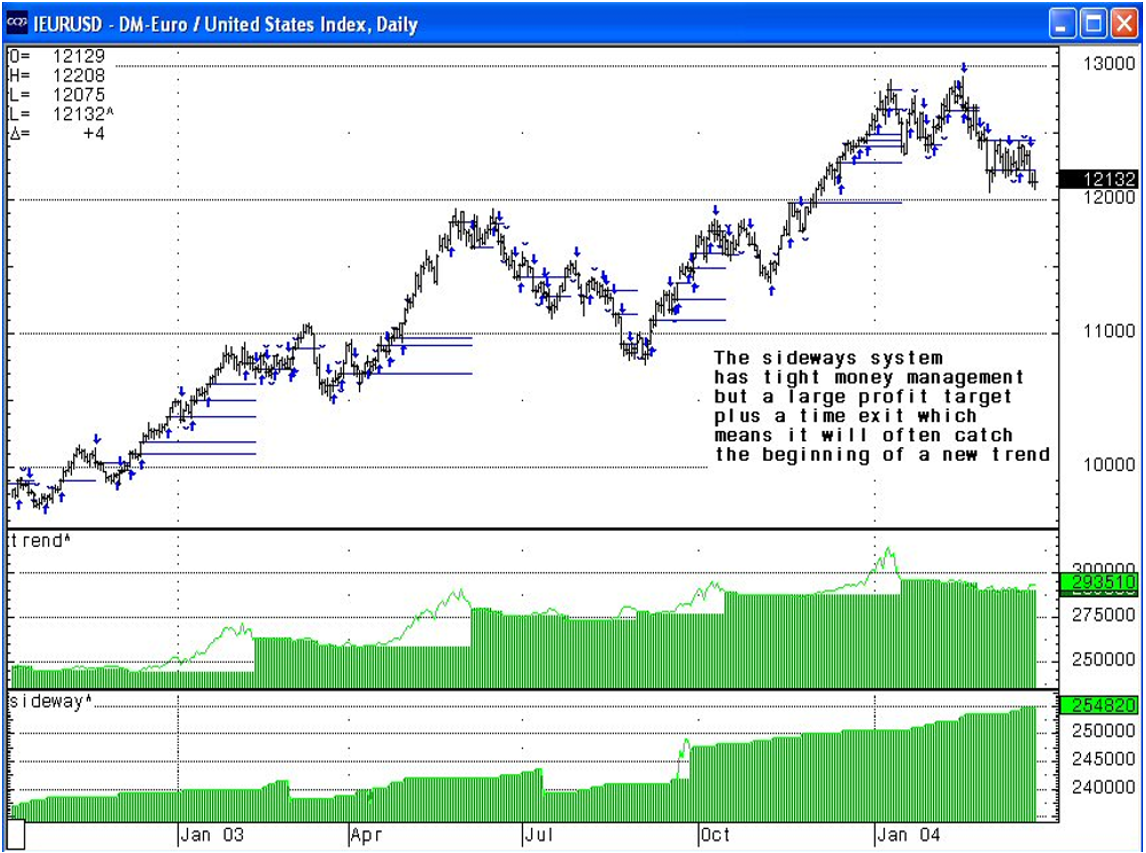
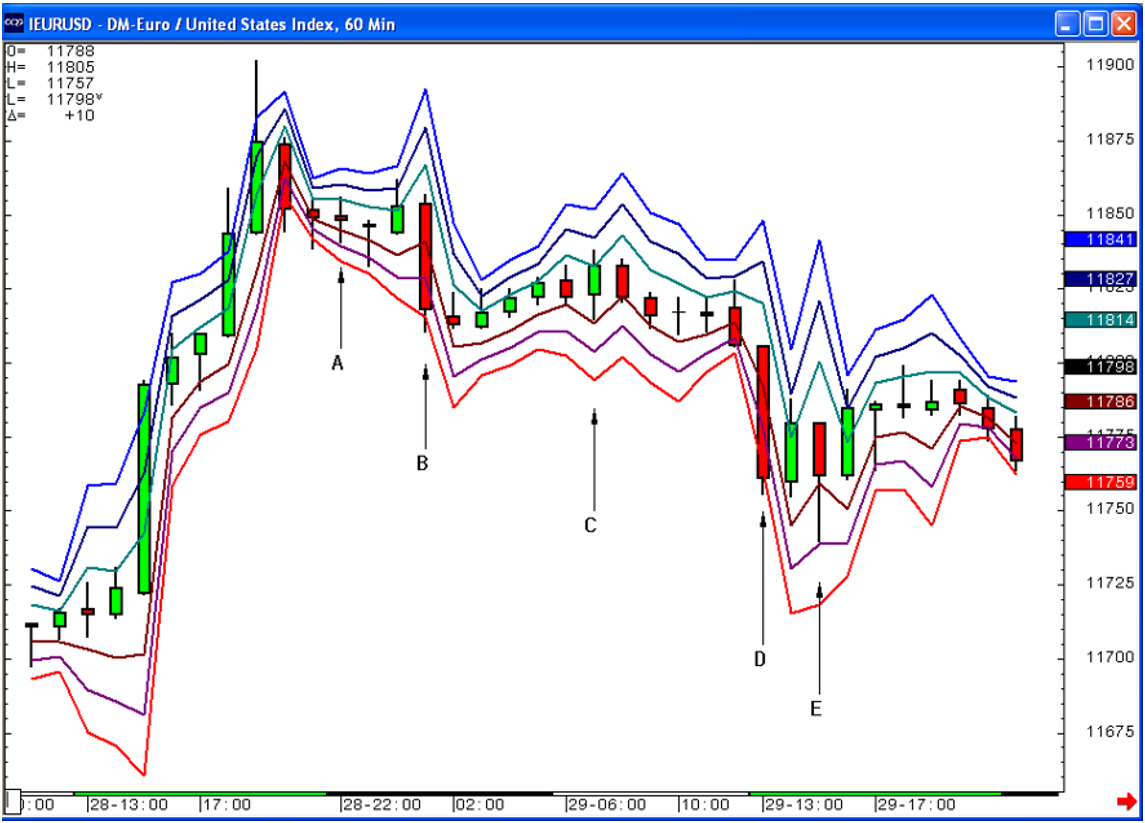
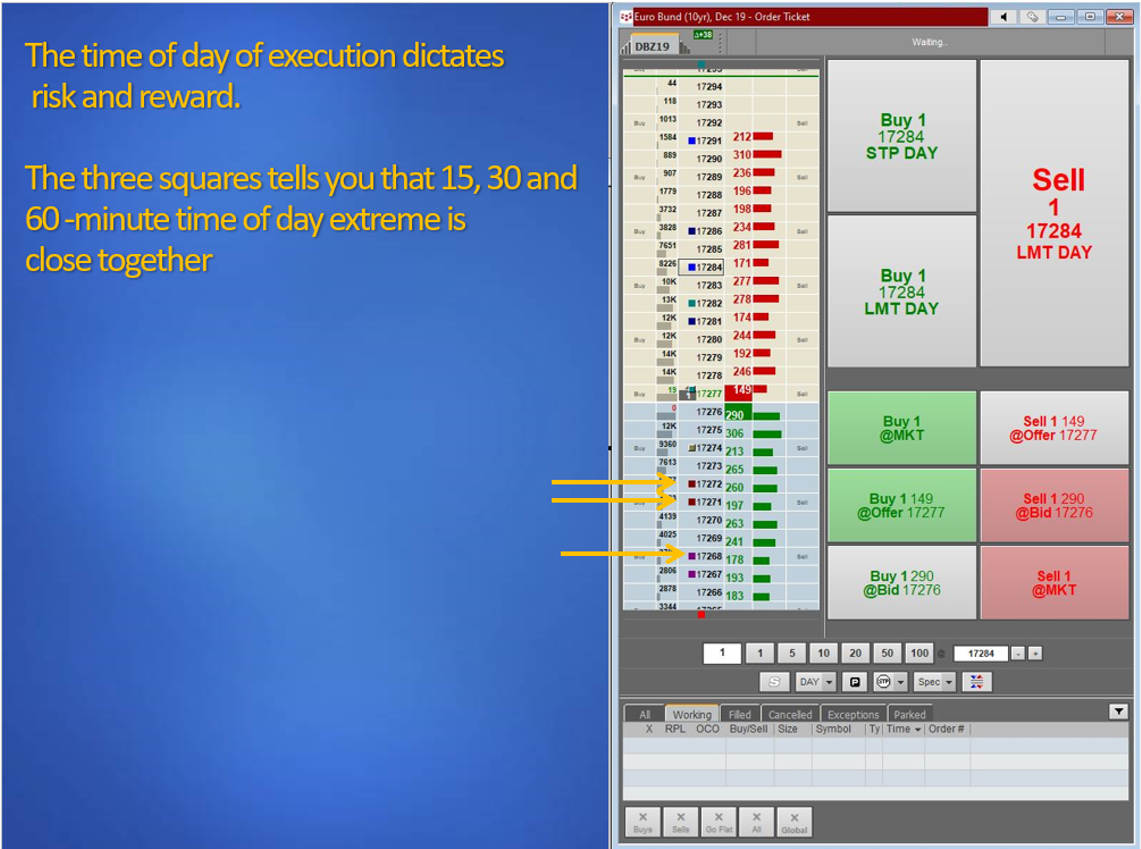
On short-term systems, the time of day of the entry dictates risk and reward. The entry point is often dependent on the technicals themselves and therefore usually has some sort of random element of what can be expected in terms of profit. Therefore understanding what can be expected allows for flexible profit targets and risk parameters. The Volatility Time Bands computes the 1, 2 and 3rd Deviation for the Time of Day. Note in the chart below how the variance in ebb and flow dictates what can be expected. The Bands must be based on the Opening Price so that the values are fixed for that timeframe. Placing them on the close would create an example where your system logic is based on something that hasn't happened yet.
This logic can be extended to multiple timeframe systems looking for confluence of short-term extremes. The study values can also be placed on the Dom Ladder for manual execution.
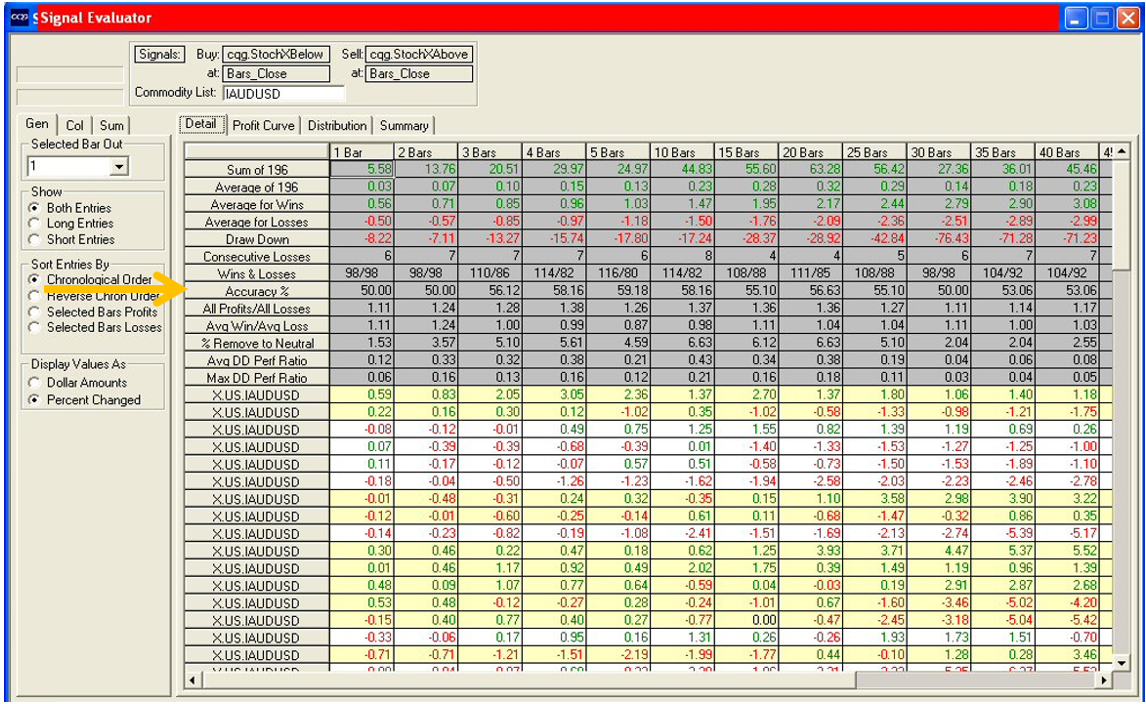
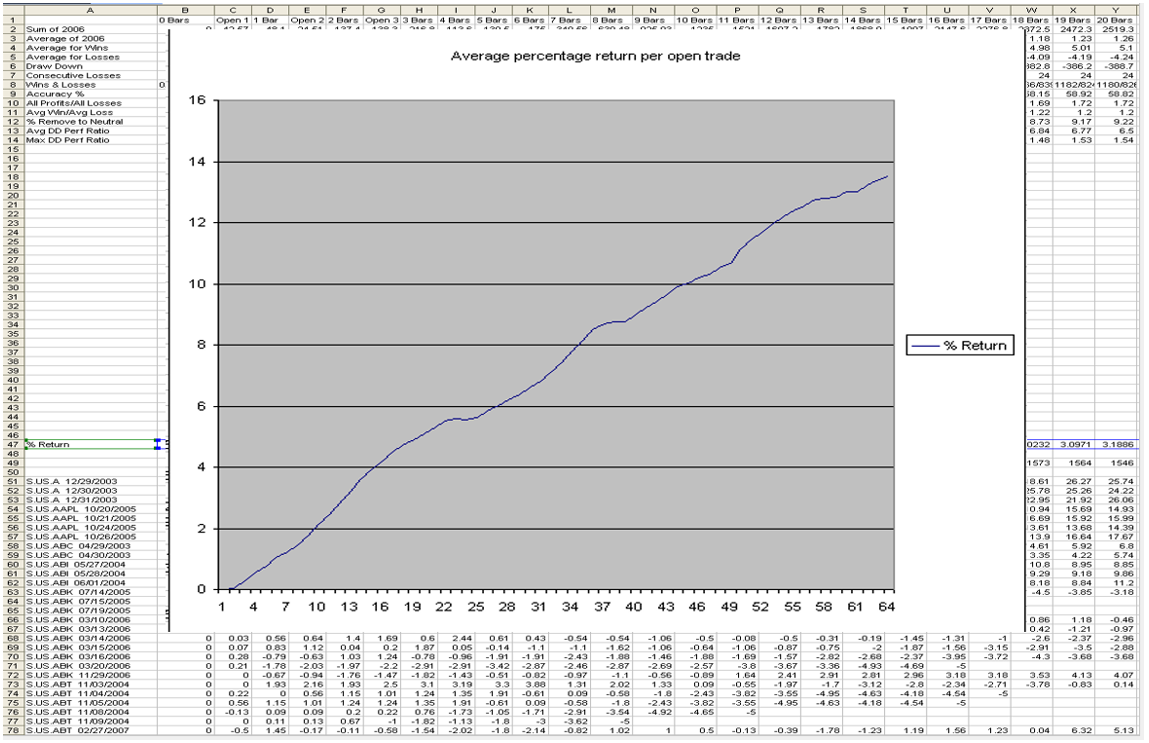
Entry Signal Evaluator is my first port of call when beginning the process. Trading is all about Timing and this tool allows to gauge the raw accuracy up to 100 bars after the code was triggered. There is no money management or buy sell offset if testing both sides at the same time. Therefore it is giving you the best- and worst-case scenario. What is does tell you is whether it has a positive statistical bias.
The table below shows that there is a bias out to the first 10 bars into the high 50's%. This means it is worth pursuing further.
From there:
- The timing of any entry point and technical exit code should be tested first
- Where are you exiting and/exiting the trend?
- What is your risk profile over the first 5 bars?
- How Long should your trade last?
- Assess entry code over the first 5 bars for analysis of the initial stop loss and look back period of the entry itself (Are you getting in too early or late?)
- Analyse every 5 bars from then on
- Do not use rollovers or active/equalised active rollovers
- Did losers turn into winners?
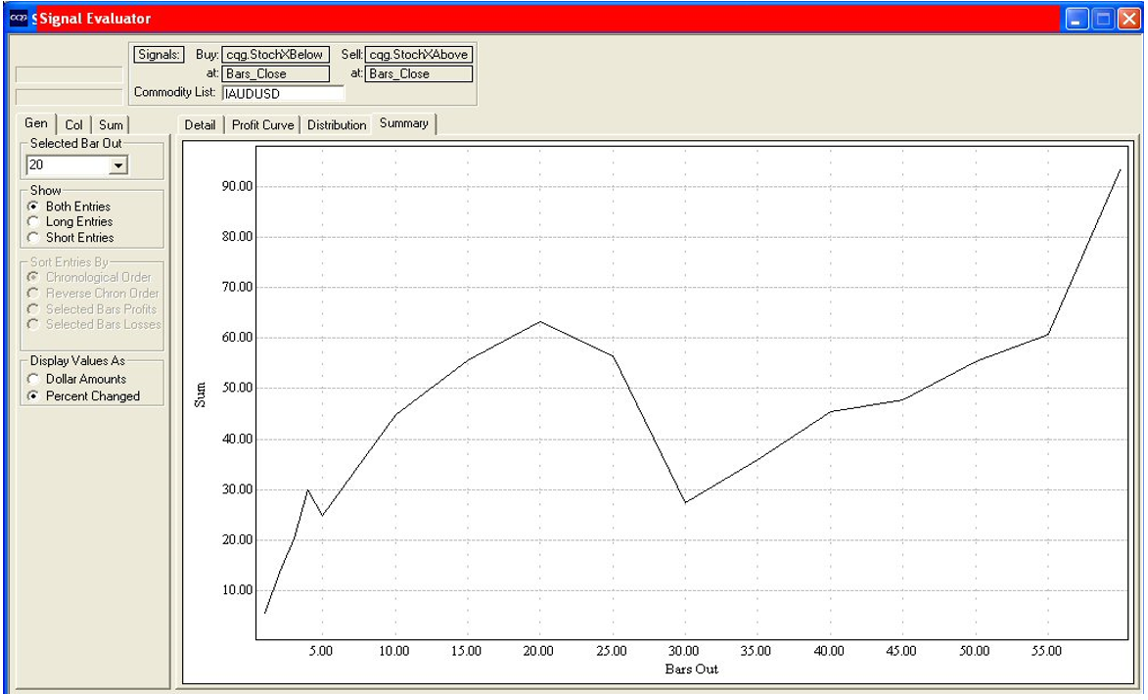
The summary below shows the performance over time. Profits peak at 20 bars after entry which from experience I know that the entry is close to the beginning of the trend. It then dips back and restarts. This knowledge aids any time-based exit code.
Entry Signal Evaluator provides the tools to understand timing
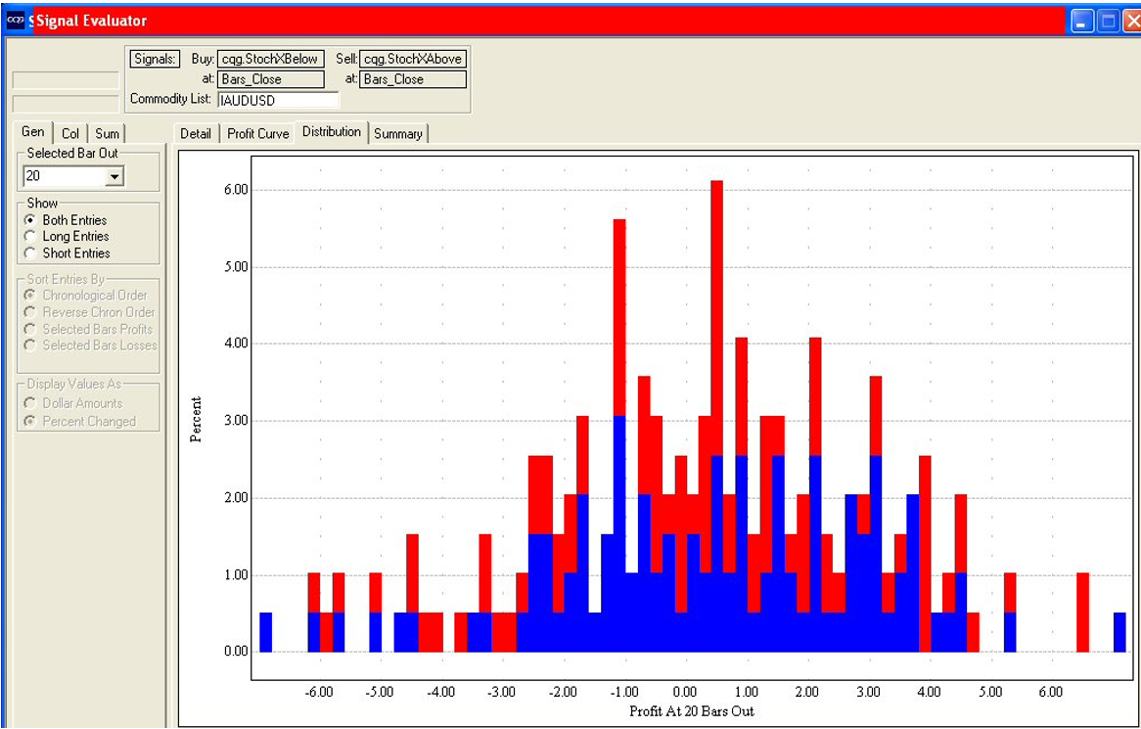
- Is my distribution curve a teardrop skewed positively to the right?
- Does the summary provide clues in creating new systems?
- Does changing the parameters randomly make a huge difference?
- Is an intraday system distorted by overnight risk if not exiting on the close?
- Can different money management tools be applied to time?
A typical teardrop distribution is shown below
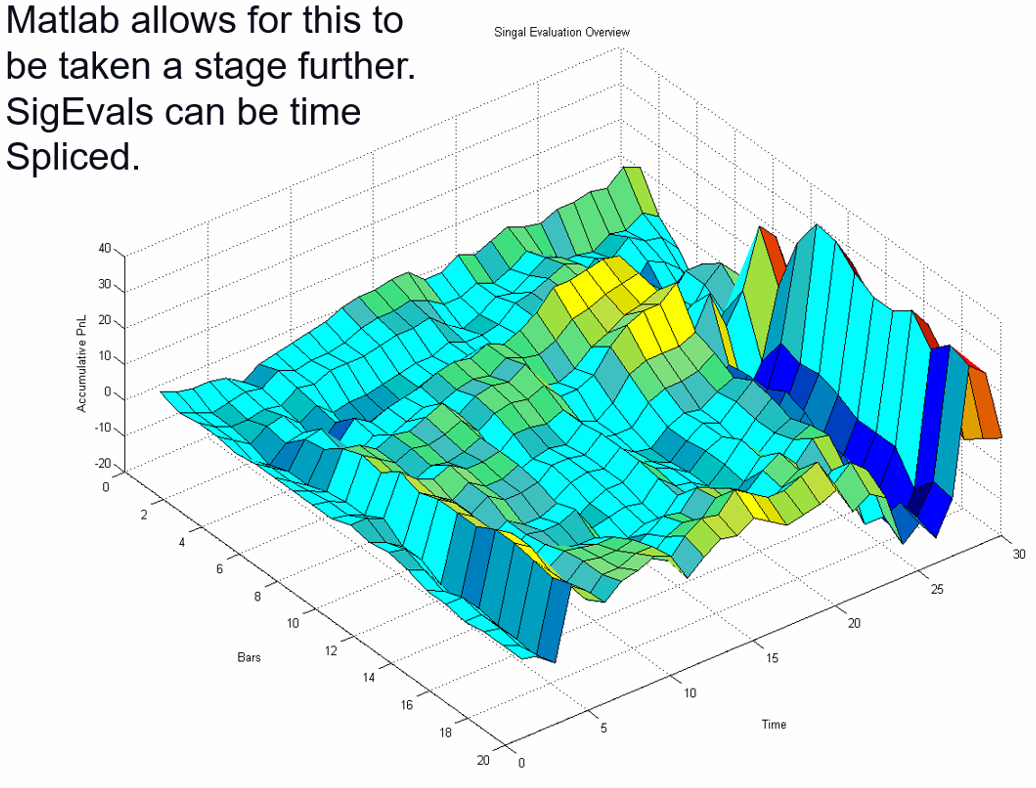
Sig Eval stats can be downloaded into Excel and a macro built that allows you to add a trailing percentage stop. This provides a clearer picture of what can be achieved before adding further exits.
Next time we will look at advanced concepts.
