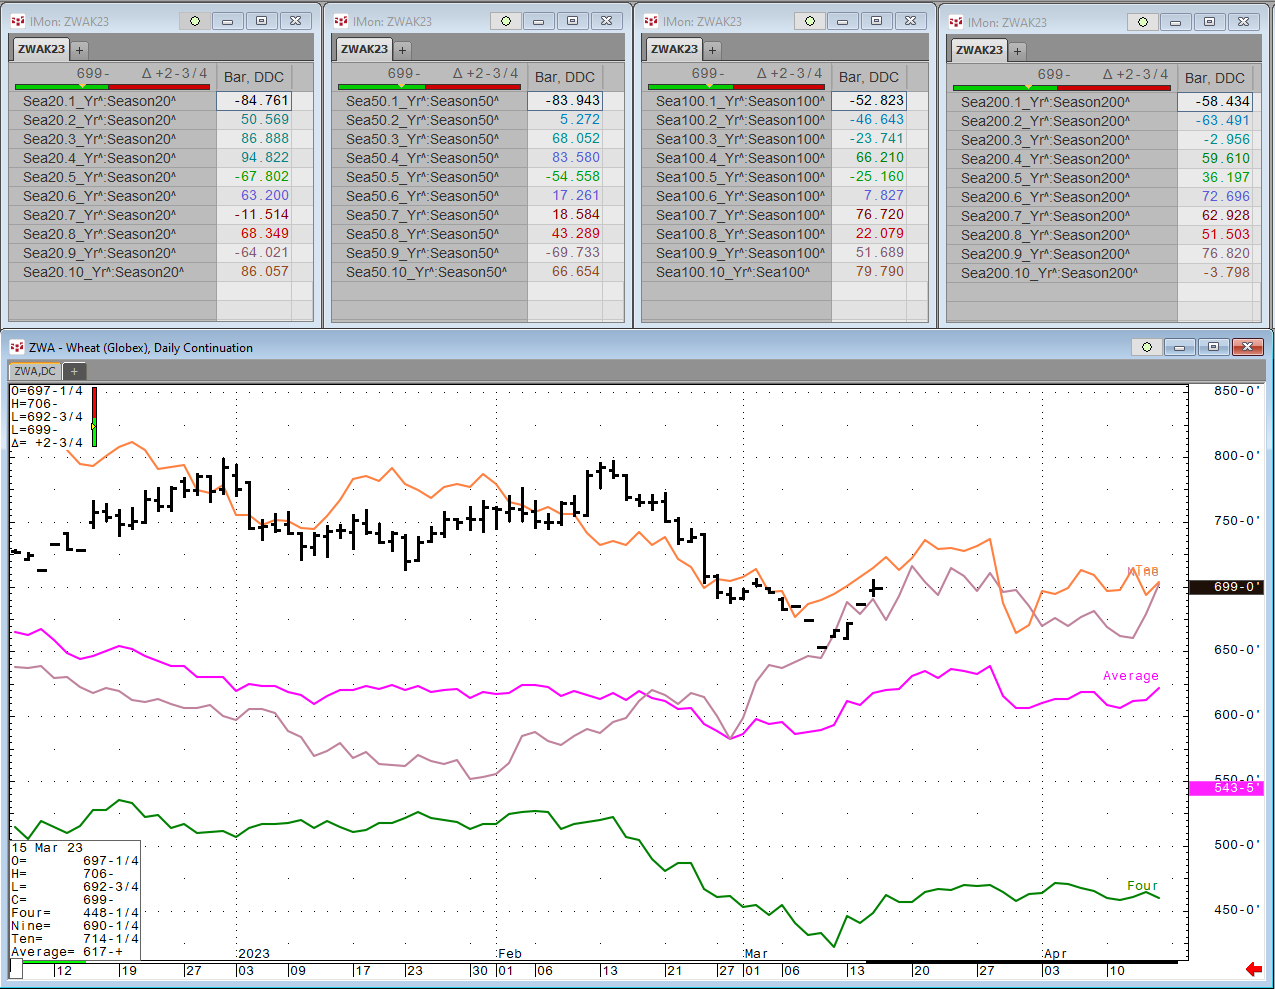
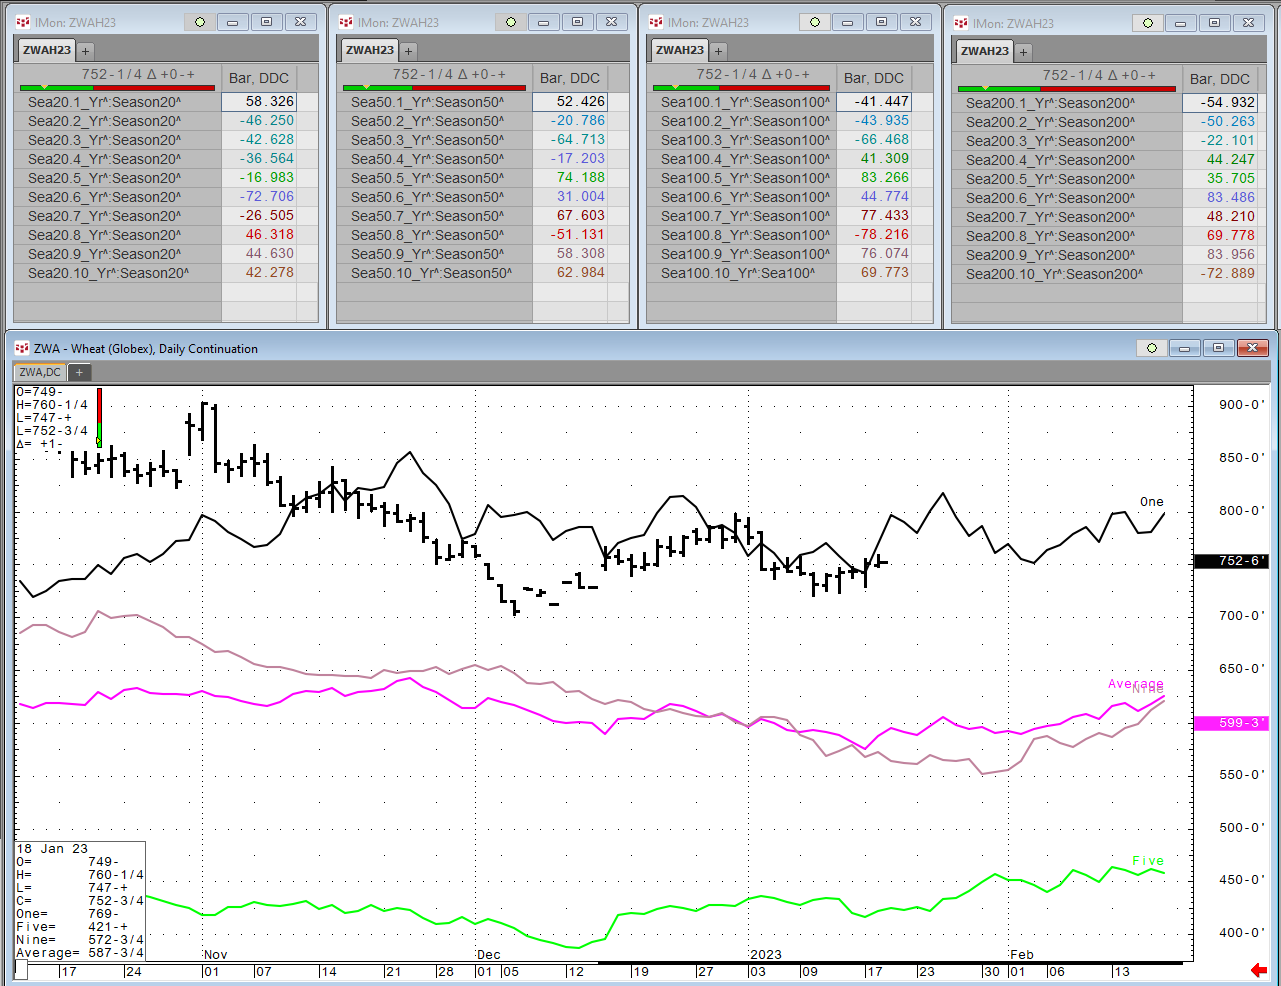
Each Wednesday this article will be updated with the current seasonal study using CQG's Seasonal analysis applied to the Soybean, Wheat and Corn markets. You can download the CQG pac providing the… more
Thom Hartle
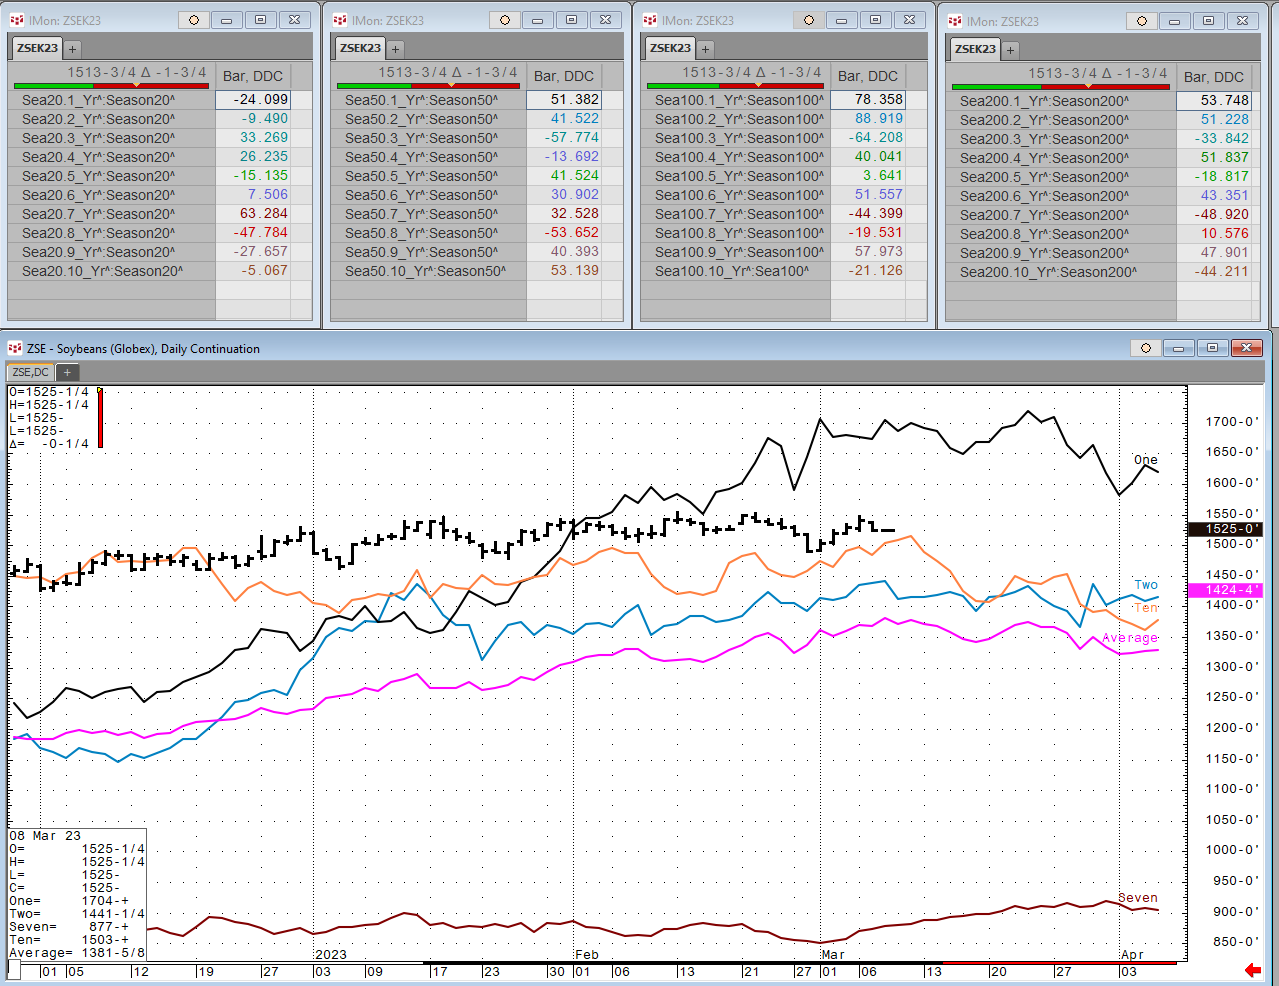
Each Wednesday this article will be updated with the current seasonal study using CQG's Seasonal analysis applied to the Soybean, Wheat and Corn markets. You can download the CQG pac providing the… more
Each Wednesday this article will be updated with the current seasonal study using CQG's Seasonal analysis applied to the Soybean, Wheat and Corn markets. You can download the CQG pac providing the… more
Each Wednesday this article will be updated with the current seasonal study using CQG's Seasonal analysis applied to the Soybean, Wheat and Corn markets. You can download the CQG pac providing the… more
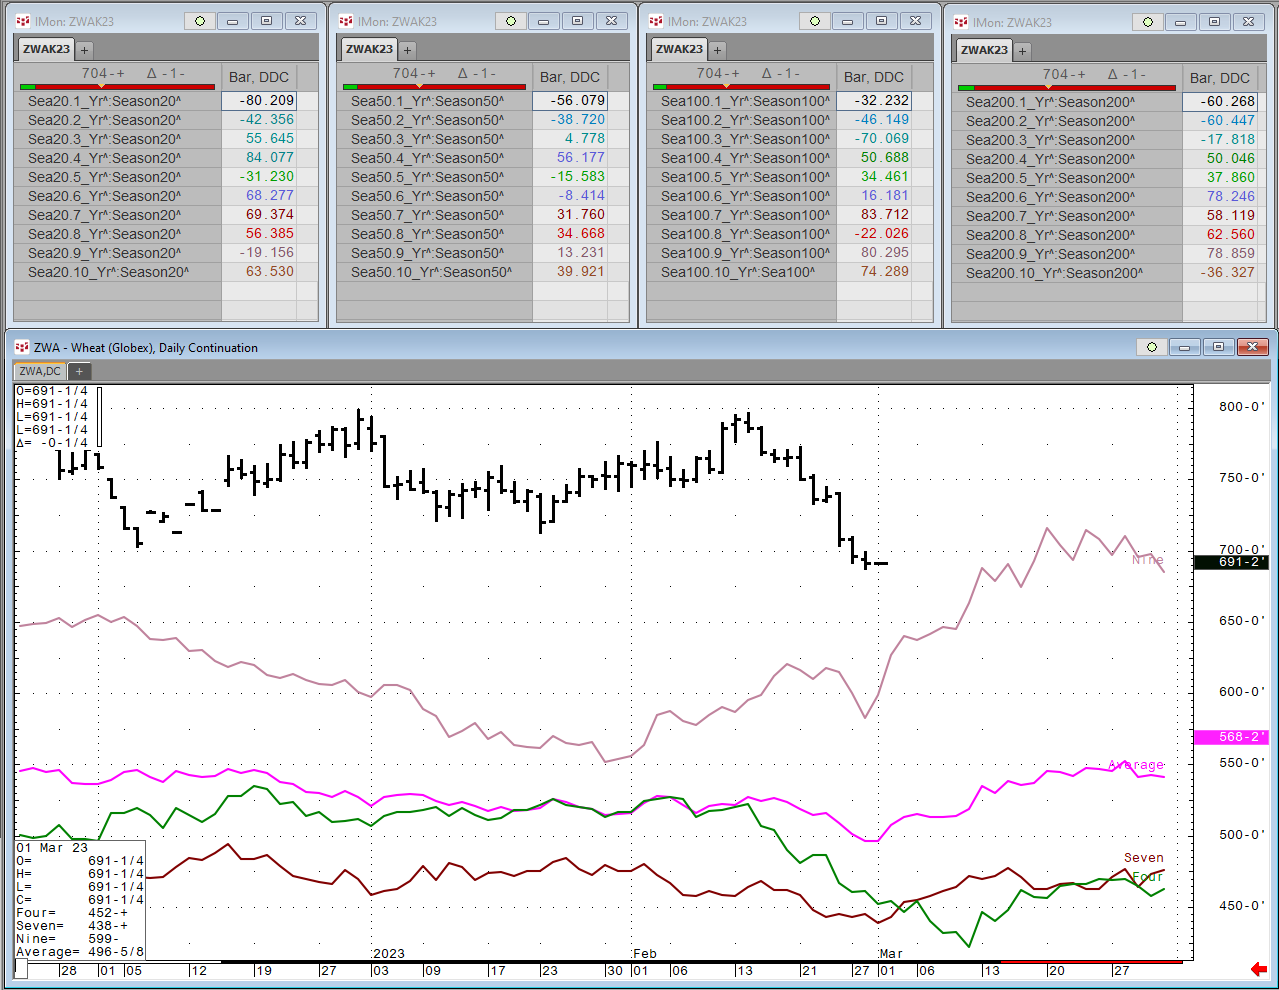
Each Wednesday this article will be updated with the current seasonal study using CQG's Seasonal analysis applied to the Soybean, Wheat and Corn markets. You can download the CQG pac providing the… more
Each Wednesday this article will be updated with the current seasonal study using CQG's Seasonal analysis applied to the Soybean, Wheat and Corn markets. You can download the CQG pac providing the… more
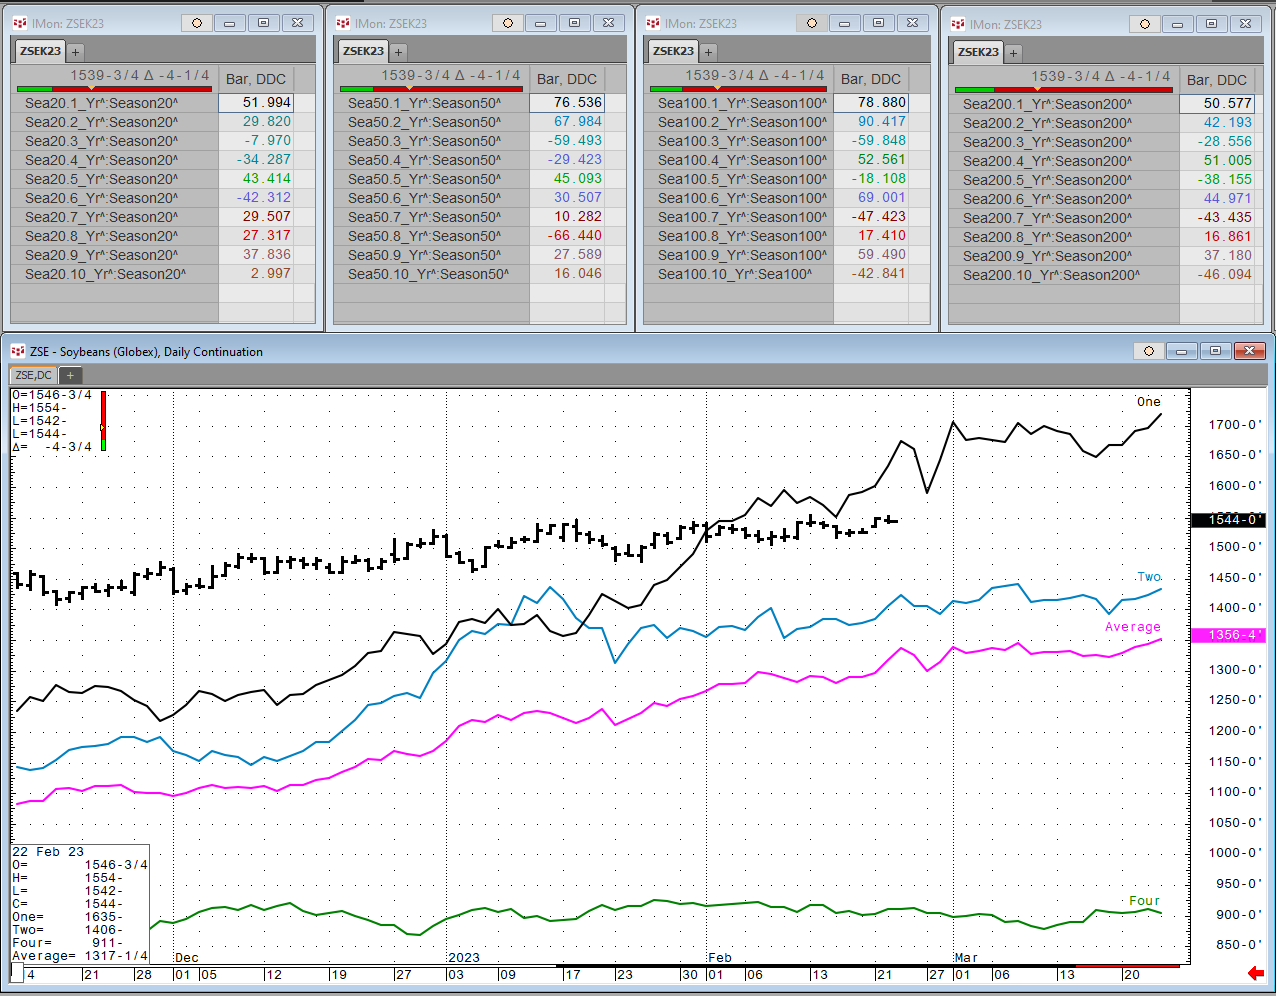
Each Wednesday this article will be updated with the current seasonal study using CQG's Seasonal analysis applied to the Soybean, Wheat and Corn markets. You can download the CQG pac providing the… more
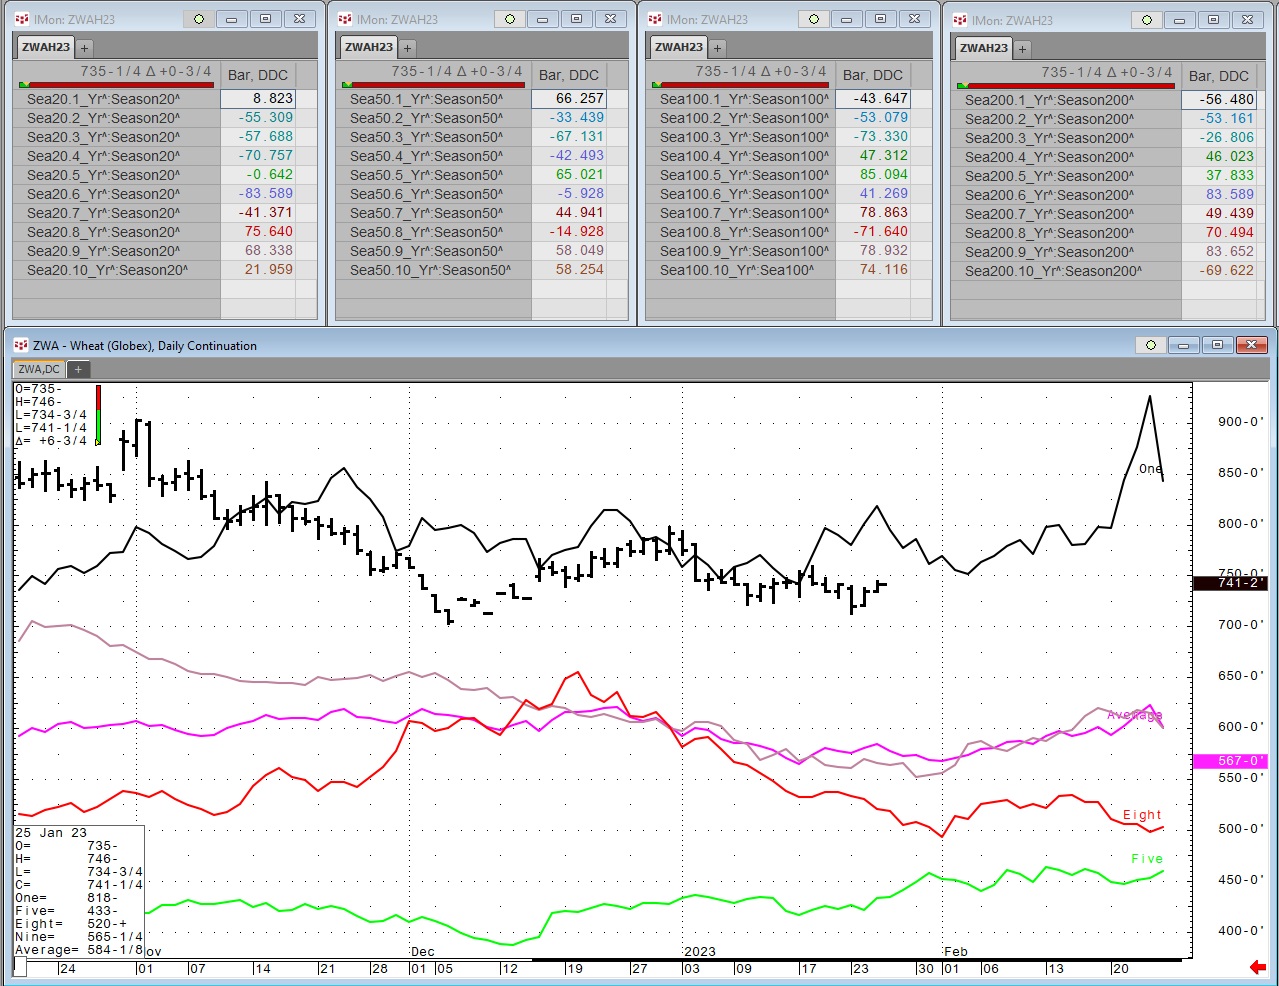
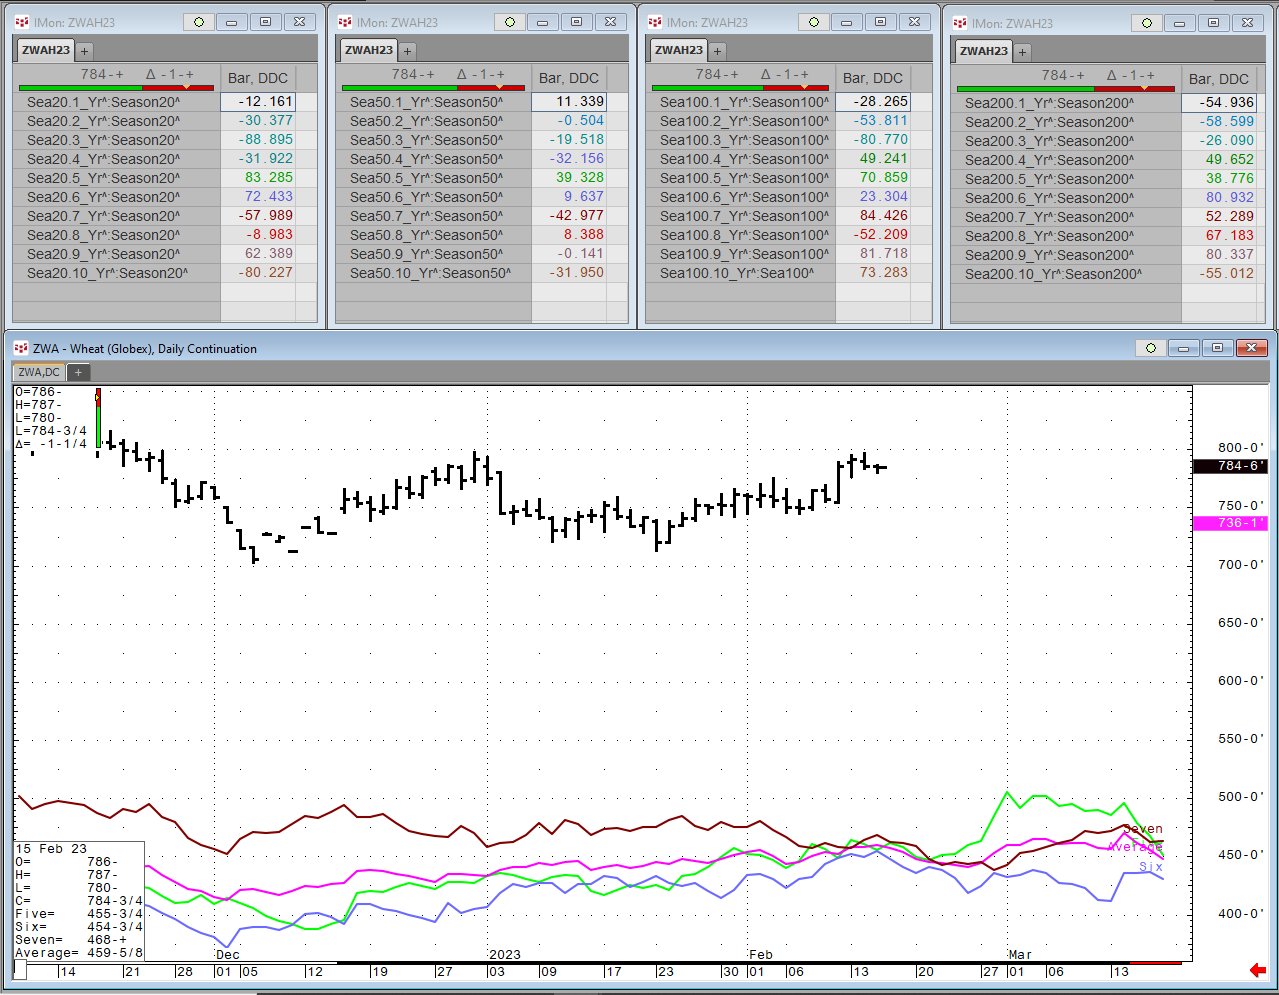
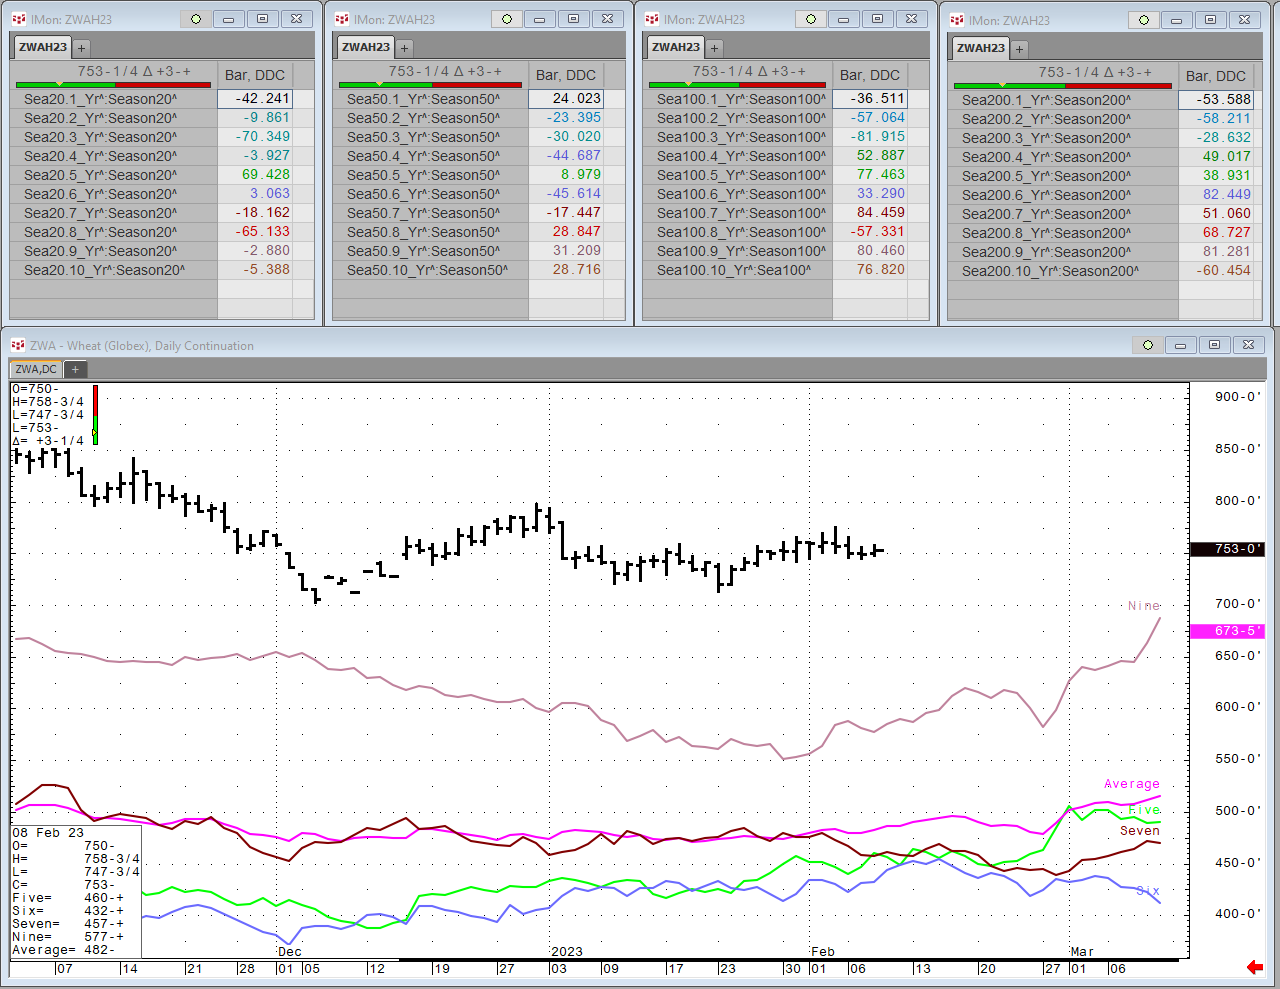
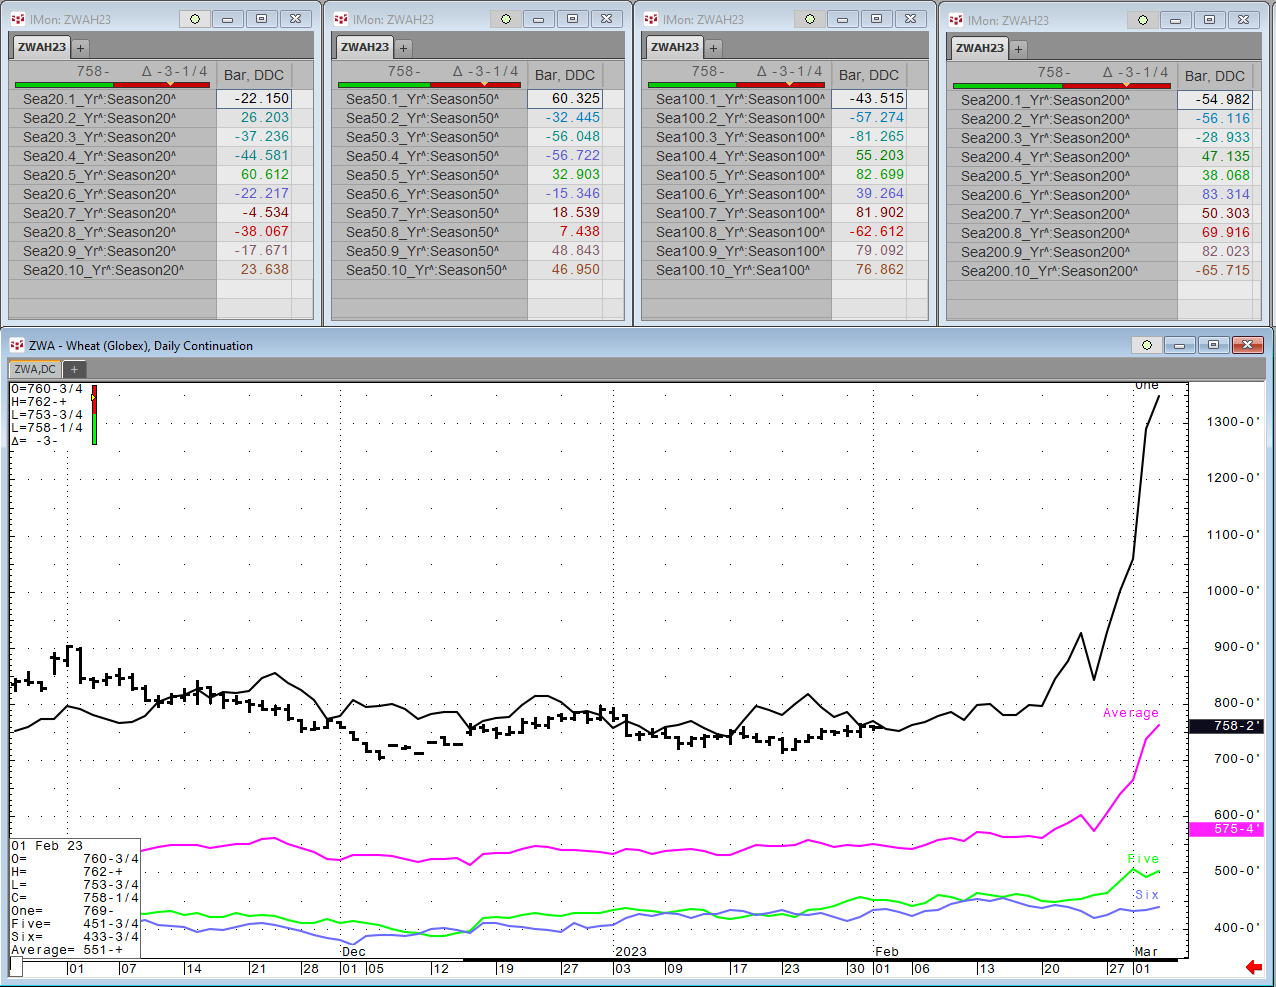
Each Wednesday this article will be updated with the current seasonal study using CQG’s Seasonal analysis applied to the Soybean, Wheat and Corn markets. You can download the CQG pac providing the… more
Each Wednesday this article will be updated with the current seasonal study using CQG’s Seasonal analysis applied to the Soybean, Wheat and Corn markets. You can download the CQG pac providing the… more
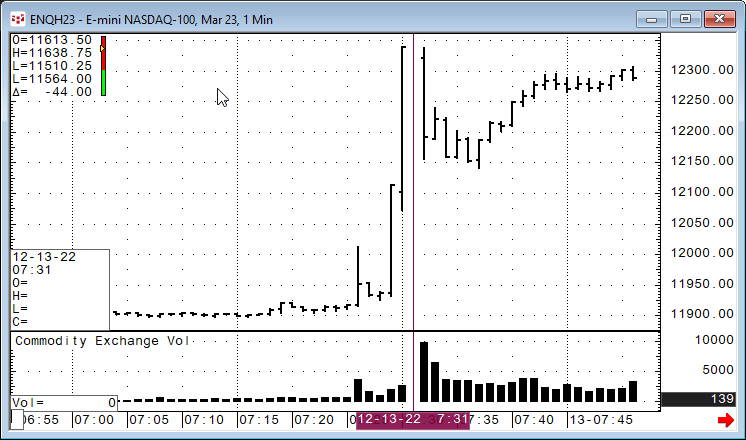
On December 13, 2022 the November Consumer Price Index was released and the reported readings were lower than expected as detailed here in the CQG IC Calendar of Events.
The equity… more