COMEX gold futures reached a record high in 2011 at $1,911.60. After a four-year correction, the price reached a bottom at $1046.20 in late 2015. In August 2020, the price eclipsed the 2011 high, soaring to $2,063, and in March 2022, a higher high at $2,078.80.
Since the March all-time peak, gold futures have made lower highs and lower lows, falling to $1,678.40 on July 21. A technical pattern that day suggests that the leading precious metal may have found a bottom, clearing the path for another rally, perhaps to a higher high.
Gold reaches a bottom at a higher low and puts in a bullish reversal pattern on the daily chart
After trading to a high of $2078.80 on the nearby COMEX futures contract in early March 2022, gold prices turned lower, and the correction took the yellow below $1700 per ounce.
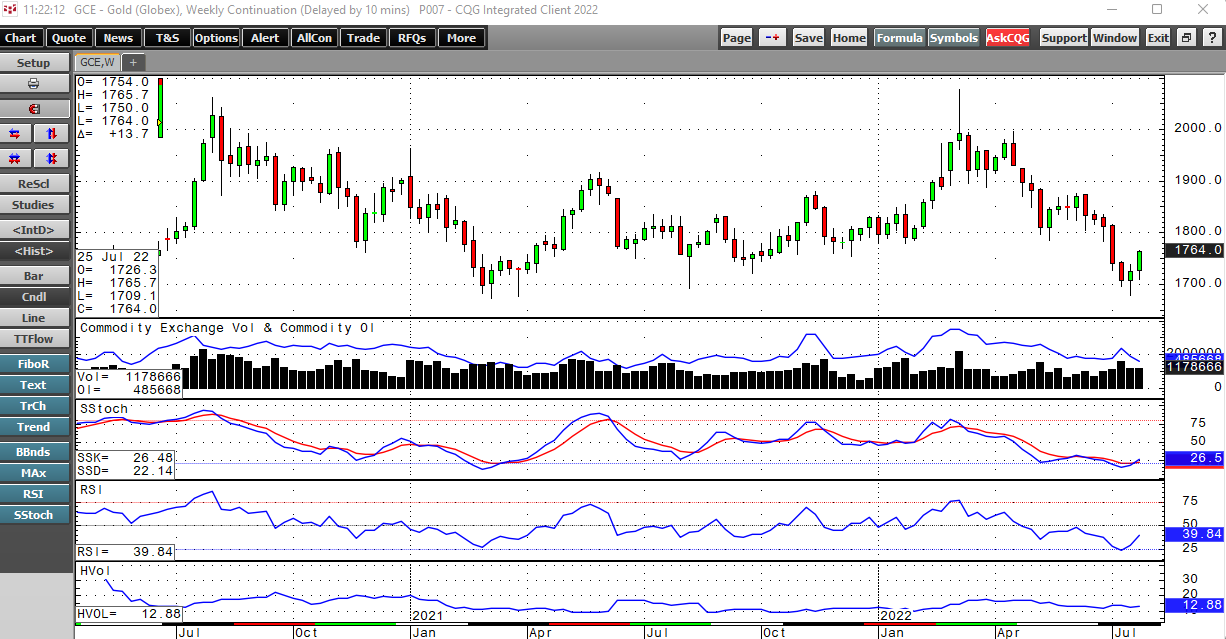
The weekly chart shows the decline that took the COMEX futures to a low of $1678.40 during the week of July 18. Open interest fell from 645,711 contracts on March 7 to 485,668 contracts in late July, a 24.8% decline as the price fell 19.3%. Declining open interest and falling prices is typically not technical validation of a bearish trend in a futures market. Meanwhile, price momentum and relative strength indices dropped to oversold territory, and weekly historical volatility moved from nearly 18% to under 13% over the period.
The technical position of the gold market was ripe for a rebound, which arrived on July 21, the day gold reached its most recent bottom.
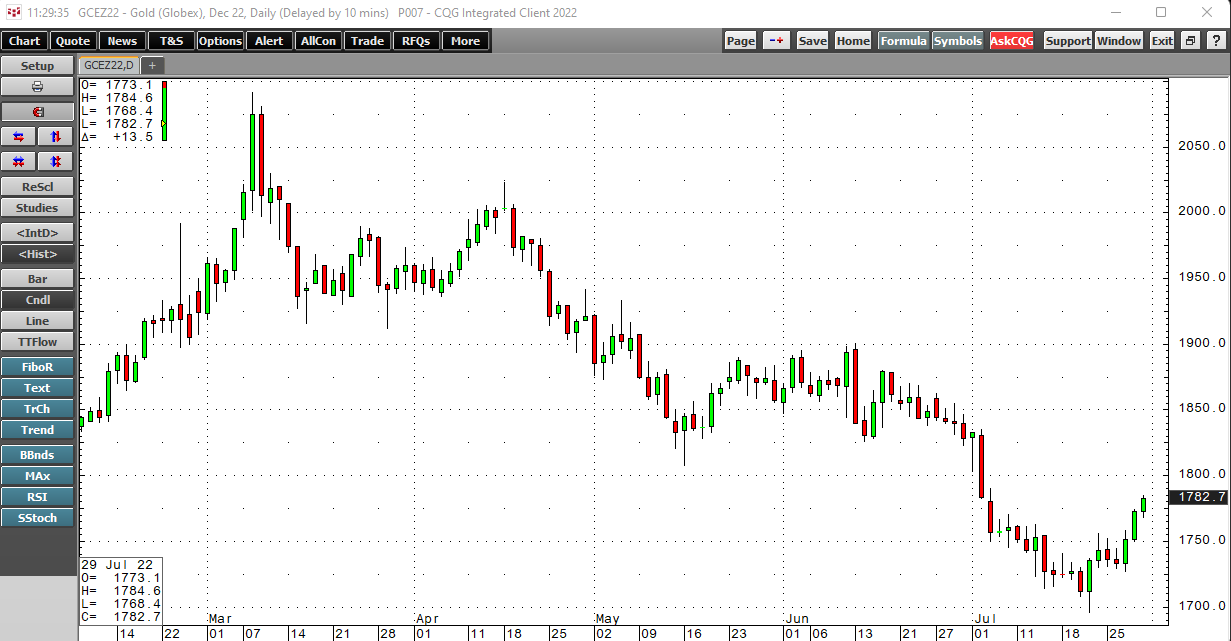
The daily chart highlights that gold fell below the July 20 low on July 21 and closed above the previous session’s high, putting in a bullish key reversal pattern on the daily chart.
Bullish price action since July 21
The daily chart shows that gold has made higher lows and higher highs since the now active month December COMEX futures contract found a bottom at $1696.10 per ounce and put in the bullish reversal pattern.
Meanwhile, the weekly chart highlights that gold’s low of $1678.40 held above the March 2021 technical support level of $1673.30 per ounce. The bullish reversal and low above a critical support area on the weekly chart have pushed the precious metal higher over the past sessions. December futures closed at the $1781.80 level on July 29, and the August contract settled at $1,762.90, $84.50 above the July 21 low.
Gold ignored the latest Fed Funds Rate hike
Rising US interest rates typically weigh on gold’s price. Since the March 2022 high, inflation at a four-decade high has caused the US Federal Reserve to increase the short-term Fed Funds rate. Last week, the FOMC hiked rates by 75 basis points for the second consecutive month, pushing the rate to 2.25% to 2.50%.
The latest consumer and producer price index data from June showed CPI accelerating by 9.1% and PPI up 11.3%. Some market participants thought the Fed could move the short-term rate 100 basis points higher, but the central bank unanimously agreed that a 75-point hike in July was sufficient to address inflation. Gold rallied in the wake of the FOMC meeting as the Fed did not take the more aggressive monetary policy route.
The Fed is in a challenging position as GDP falls in Q2
Last week, the report that the US gross domestic product fell 0.90% after a 1.6% decline in Q1 2022 was the textbook definition of a recession. A combination of the highest inflation since the early 1980s and falling GDP presents more than a challenge for the US central bank. On the one hand, inflation requires higher interest rates to slow growth, while slowing growth requires lower rates to stimulate the economy. The Fed is caught between a rock and a hard place in August 2022.
In 2021, the central bank and the Biden administration attributed rising inflation to pandemic-inspired supply chain bottlenecks, telling markets that increasing prices were “transitory.” They were wrong and reversed course late last year and in 2022 to address inflation.
Now, they are downplaying the recession signals from the last two GDP reports calling it an economic “transition” instead of a recession. With the mid-term elections on the immediate horizon, the administration’s economists cannot afford the inflation and recession that are the hallmarks of stagflation. Time will tell if the delay in recognizing the evidence pointing to a recession will cause further damage to the economy as inflation did in 2021 and early 2022.
Meanwhile, the action in the gold market tells us that the central bank will have another epiphany and slow the ascent of rate hikes over the coming months as the economy slows.
Levels to watch in the gold market in August 2022
Gold’s rebound since the July 21 bullish key reversal pattern did not cause a technical break to the upside, but the short-term trend has turned higher.
The daily chart of December COMEX futures shows the June 13 $1900.80 high is the first technical upside target for the leading precious metal. Last week, gold, silver, platinum, palladium, copper, and base metals prices all moved to the upside in the aftermath of the Fed rate hike and Q2 GDP data. Gold signals that the trajectory of rate hikes may be unsustainable as the economy slows.
Gold’s bull market began in 1999 when the futures price reached rock bottom at $252.50 per ounce. The long-term path of least resistance remains higher as we move into August 2022.


