Gold fell to a low at $1161.70 in mid-August, but silver waited until mid-November to find its bottom at $13.86 per ounce. Since the lows, the precious metals have been making higher lows and higher highs. During the week of January 22, both silver and gold put in technical formations on their weekly charts that proved to be a bullish sign of things to come for the metals. The precious metals are climbing in 2019, and at the first Fed meeting of 2019, the central bank injected even more support for the gold and silver markets.
A bullish reversal in gold
Gold told markets that the Fed was going to soften their hawkish approach to monetary policy before the FOMC meeting got underway. During the week of January 22, the gold futures market waved a bullish flag, which turned out to be an omen for markets across all asset classes.
Gold tends to rally during periods when interest rates are low, and the dollar is moving to the downside. However, strength in the dollar index at the end of 2018 did little to stop gold from making higher lows and higher highs following the August low at $1161.70 per ounce.
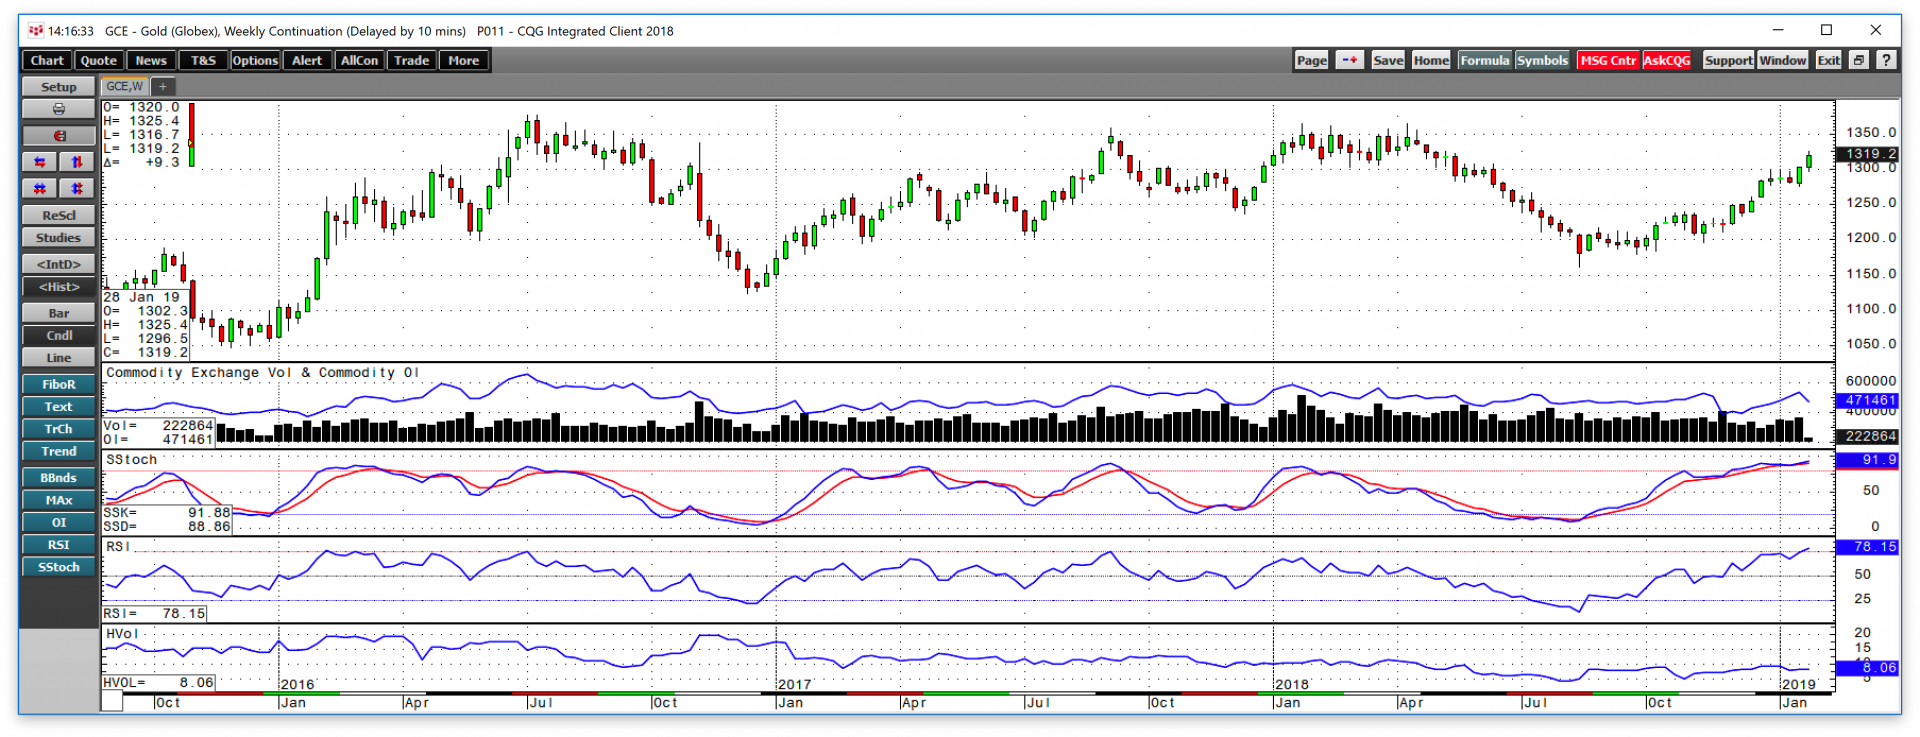
As the weekly chart highlights, during the week of October 8, gold put in a bullish reversal pattern when the price fell to a lower low than the prior week and then rallied and closed above the previous week’s high. The price action in the gold market followed through on the upside in the aftermath of the bullish signal in early October.
During the week of January 22, gold did a repeat performance with another bullish reversal. After trading down to $1275.30, it closed the week above the $1300 level, and during the final week of January, the yellow metal added to the gains. Higher trading volume during the week of the latest reversal provides technical validation for the current price trend. On the final day of January, February COMEX futures settled at $1319.70, the highest price since last May.
A bullish reversal in silver
While gold hits its low for 2018 in mid-August, silver waited until mid-November. Gold’s low came within $115.50 or 11% of the December 2015 bottom which stands as critical technical support for the yellow metal. Meanwhile, silver fell to a low at $13.86 in November, which was only 22.5 cents or 1.65% above its most significant support level at the late 2015 low in the volatile precious metal.
Silver has been lagging gold, and over the recent months, it fell to its lowest level against the yellow metal in a quarter of a century when the silver-gold ratio rose to highs at 86 ounces of silver value in each ounce of gold value. However, over recent weeks the price of silver has been catching up with its precious cousin. In late December the price of silver broke above the $15.175 per ounce level which was technical resistance dating back to November.
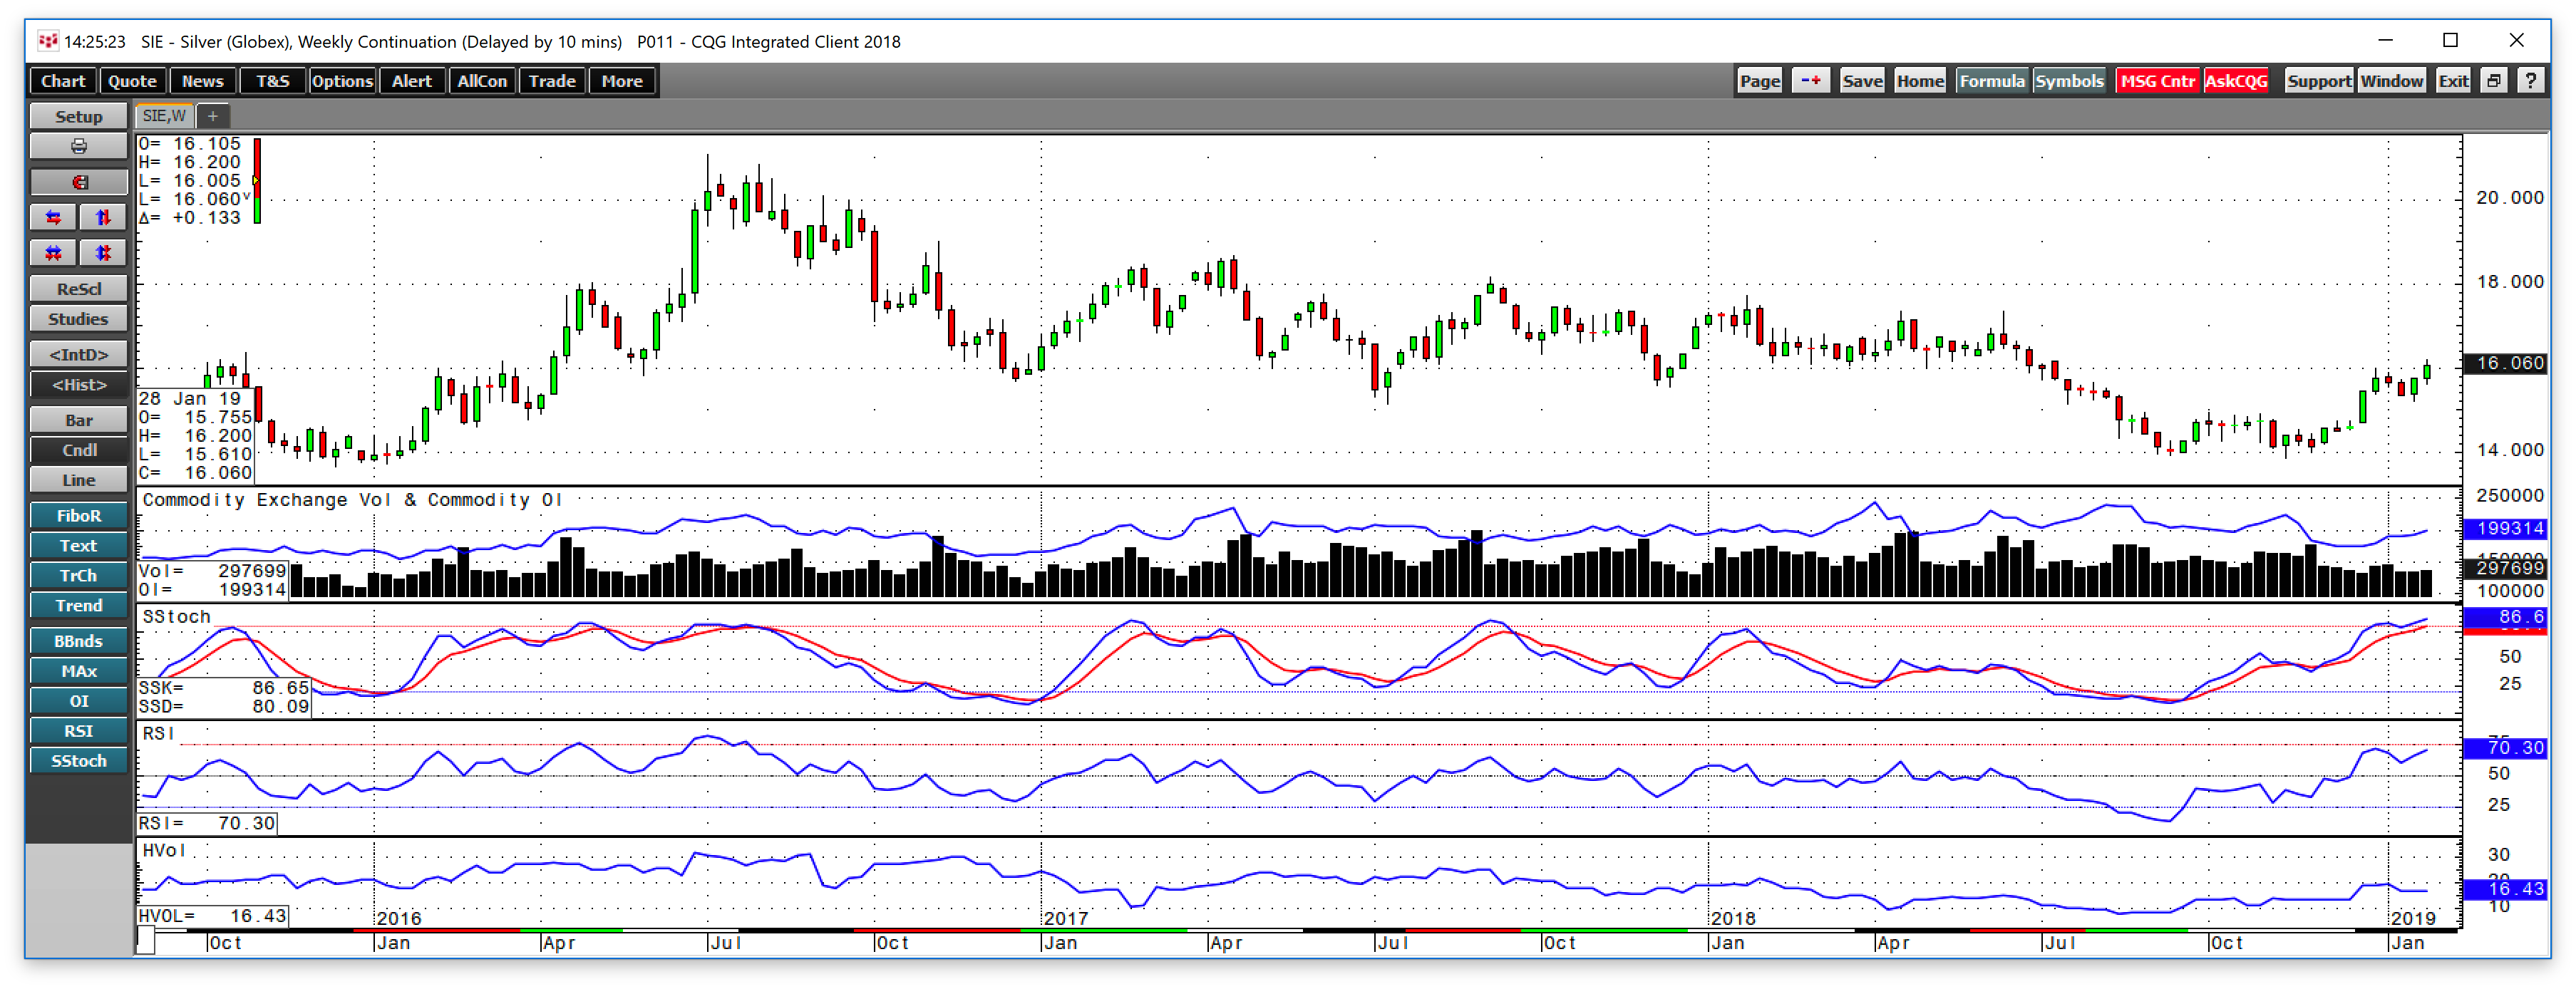
During the week of January 22, silver followed gold and also put in a bullish reversal on the weekly chart.
As the weekly chart illustrates, the price of silver fell to a lower low than the prior week and found a higher low at $15.195 which was 2 cents above its short-term technical support level. The precious metal turned higher, and at the end of the week, it was at $15.75, 1.50 cents above the high from the previous week. Silver followed through in the upside and rose above the $16 level in the aftermath of the dovish message from the US central bank on January 30. March silver futures settled at $16.072 per ounce on the final day of January at the highest price since June of last year.
Watch critical resistance levels - the Fed’s pause is bullish for the metals
Gold and silver prices had been climbing throughout January, and the Fed’s accommodative message to markets across all asset classes appears to have lit a bullish fuse under the two most liquid precious metals.
When it comes to gold, the next significant level of technical resistance stands at the $1365.40 level on the continuous contract. In 2018, gold futures put in a double top at that price with consecutive highs in January 2018 and then again in April. After a failure to make a higher high last April, gold fell to just over $1160 per ounce. However, the price is now attempting to climb to that price again which was $45.70 or 3.5% above the end of January closing level. If gold can move above the 2018 highs, it would set up the potential for a challenge of the 2016 post-Brexit high at $1377.50. A move north of that price would be a significant technical break to the upside in the yellow metal.
In the silver market, the next level of technical resistance stands at the June 2018 high at $17.35 per ounce. Above there, $17.705, $18.16, and $18.655 stand as roadblocks and areas of resistance on the metal’s way to its critical technical level at the 2016 peak at $21.095 per ounce.
Is 2019 the year where precious metals roar?
Time will tell if the price action in gold and silver in January is the beginning of a golden year for the precious metals. A less hawkish Fed is likely to keep the dollar under some pressure, which is bullish for the prices of all commodities, and gold and silver are no exception. The current geopolitical environment offers more than a few issues that could cause periods of fear and uncertainty that would provide support for the metals.
I will be keeping an eye on the price relationship between silver and gold, which continues to be at an elevated historical level.
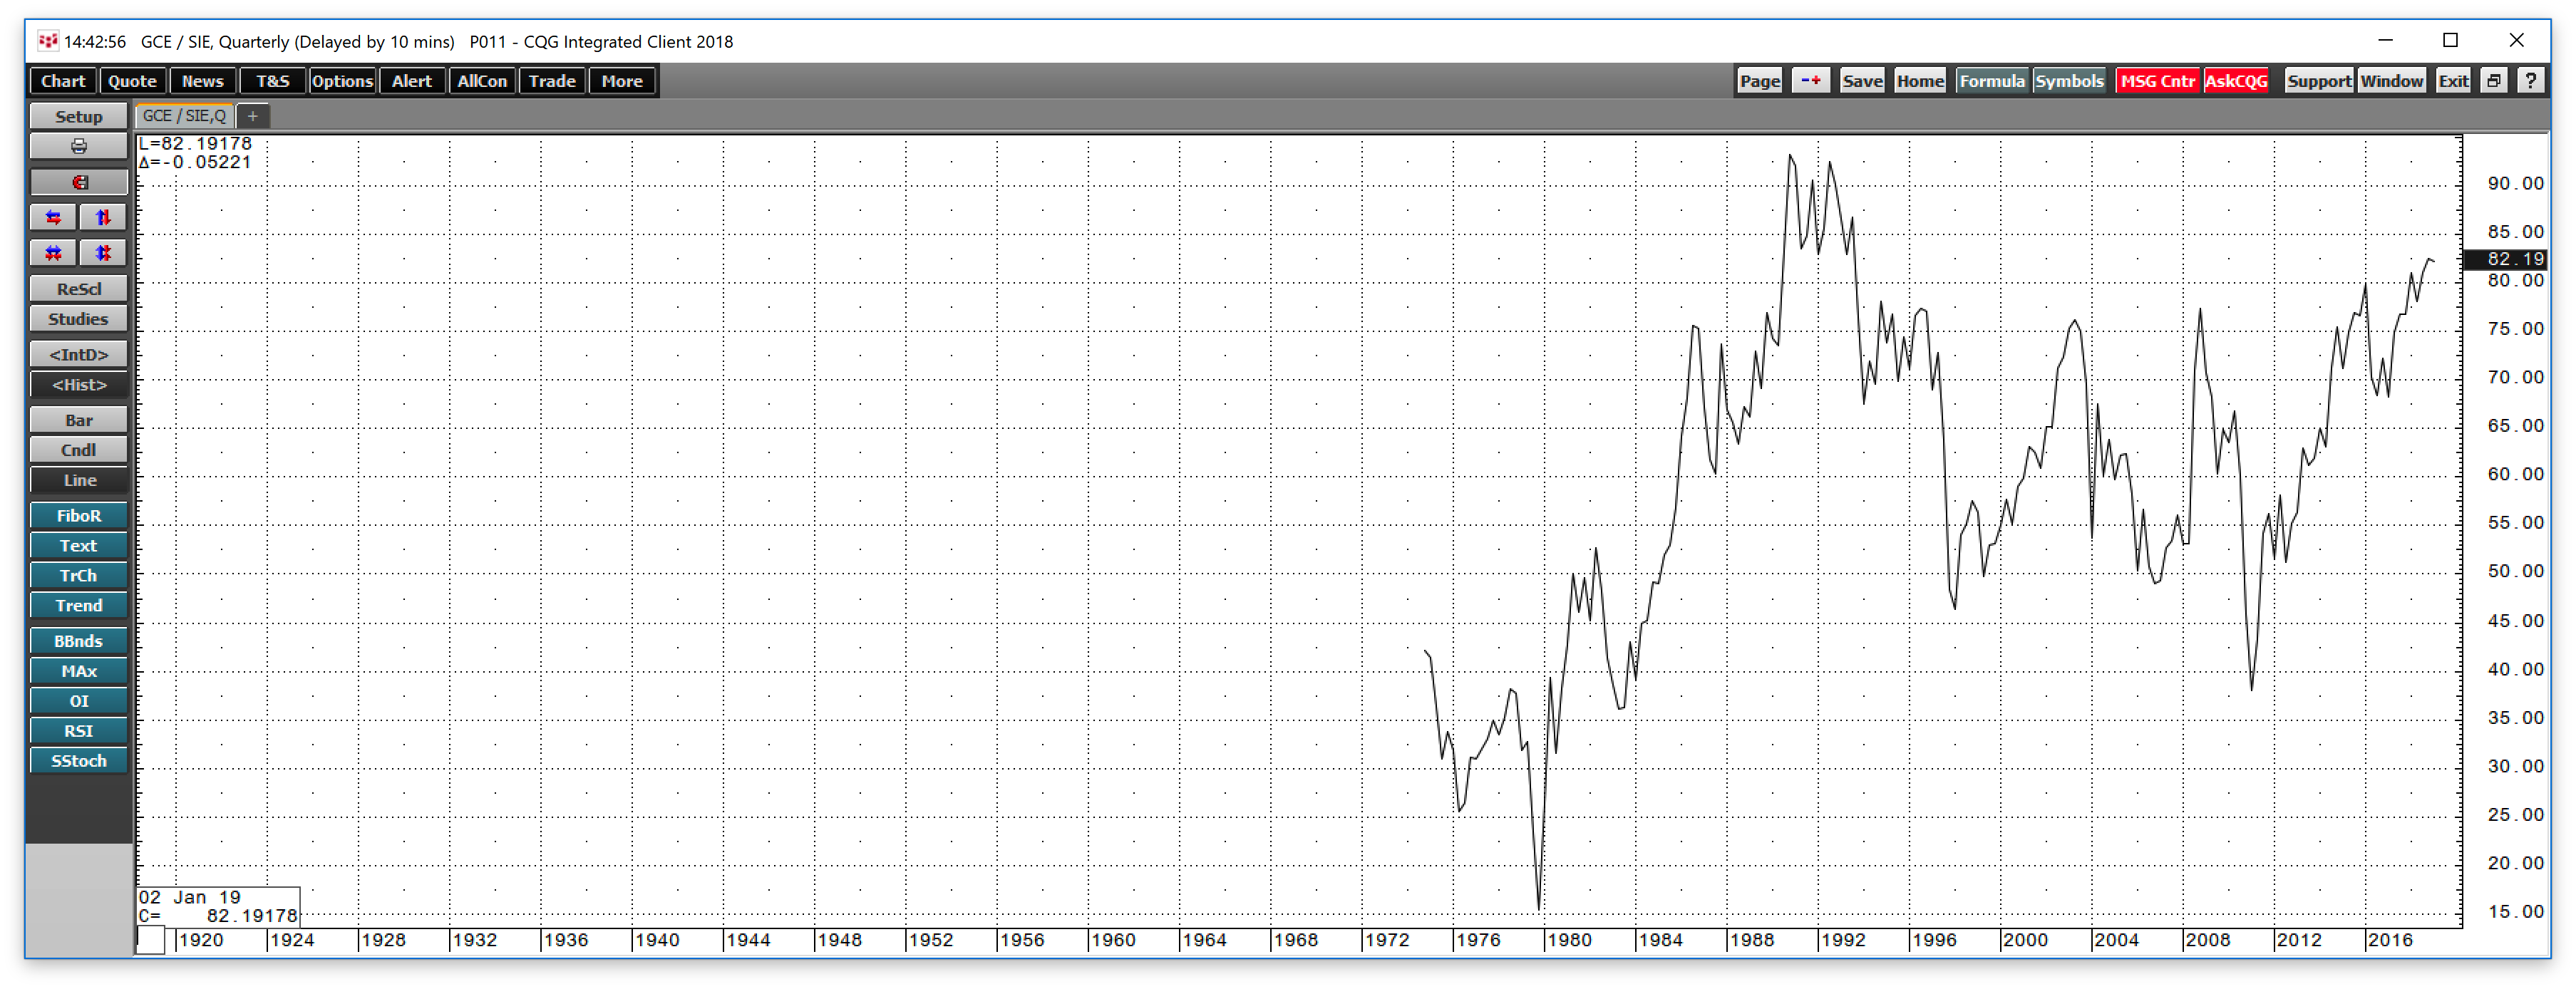
As the quarterly chart of the price of gold divided by the price of silver shows, the long-term median is around 55:1 or 55 ounces of silver value in each ounce of gold value. Historically, a rising ratio tends to be a bearish sign for precious metals prices while a declining trend in the ratio is supportive of prices. At 82.19:1 on January 31 the relationship remains near its highest level since 1993. I would view a move below the 80:1 level as highly bullish for the precious metals sector, which means that silver needs to catch up with gold over the coming weeks and months.
Gold and silver sent the markets a clue with their price action on the weekly charts even before the Fed sent its dovish message. Gold and silver turned in impressive performances over the past days and weeks, and that trend looks set to continue as we enter the second month of 2019.


