There is a big difference between price and value. Price is a transparent number where buyers and sellers meet to transact. Value is a concept that often goes much deeper. We can all watch asset prices as they cross our screens in real time. However, when it comes to the actual value of a commodity or any asset, one must dig a little bit further.
I have found that understanding the historical relationships contained in intercommodity spreads, or the price of one commodity expressed as a function of another, is often an excellent tool that provides clues as to the current value of both raw materials. As an asset class, many commodity prices tend to move together. Commodities are volatile assets; therefore, intercommodity spreads often display periods of divergence. This can happen over a long period or a short period. A divergence creates two opportunities for traders: First, understanding historical means or norms can pinpoint whether one commodity is cheap or expensive relative to another. Second, divergence often presents the potential for profits in terms of mean reversion trades. Recently, the prices of two of the highest profile commodities have diverged dramatically.
Stability in Gold
Gold, the asset that has properties of both a commodity (a metal) and a currency (a means of exchange), has been in a bear market since making all-time nominal highs back in 2011.
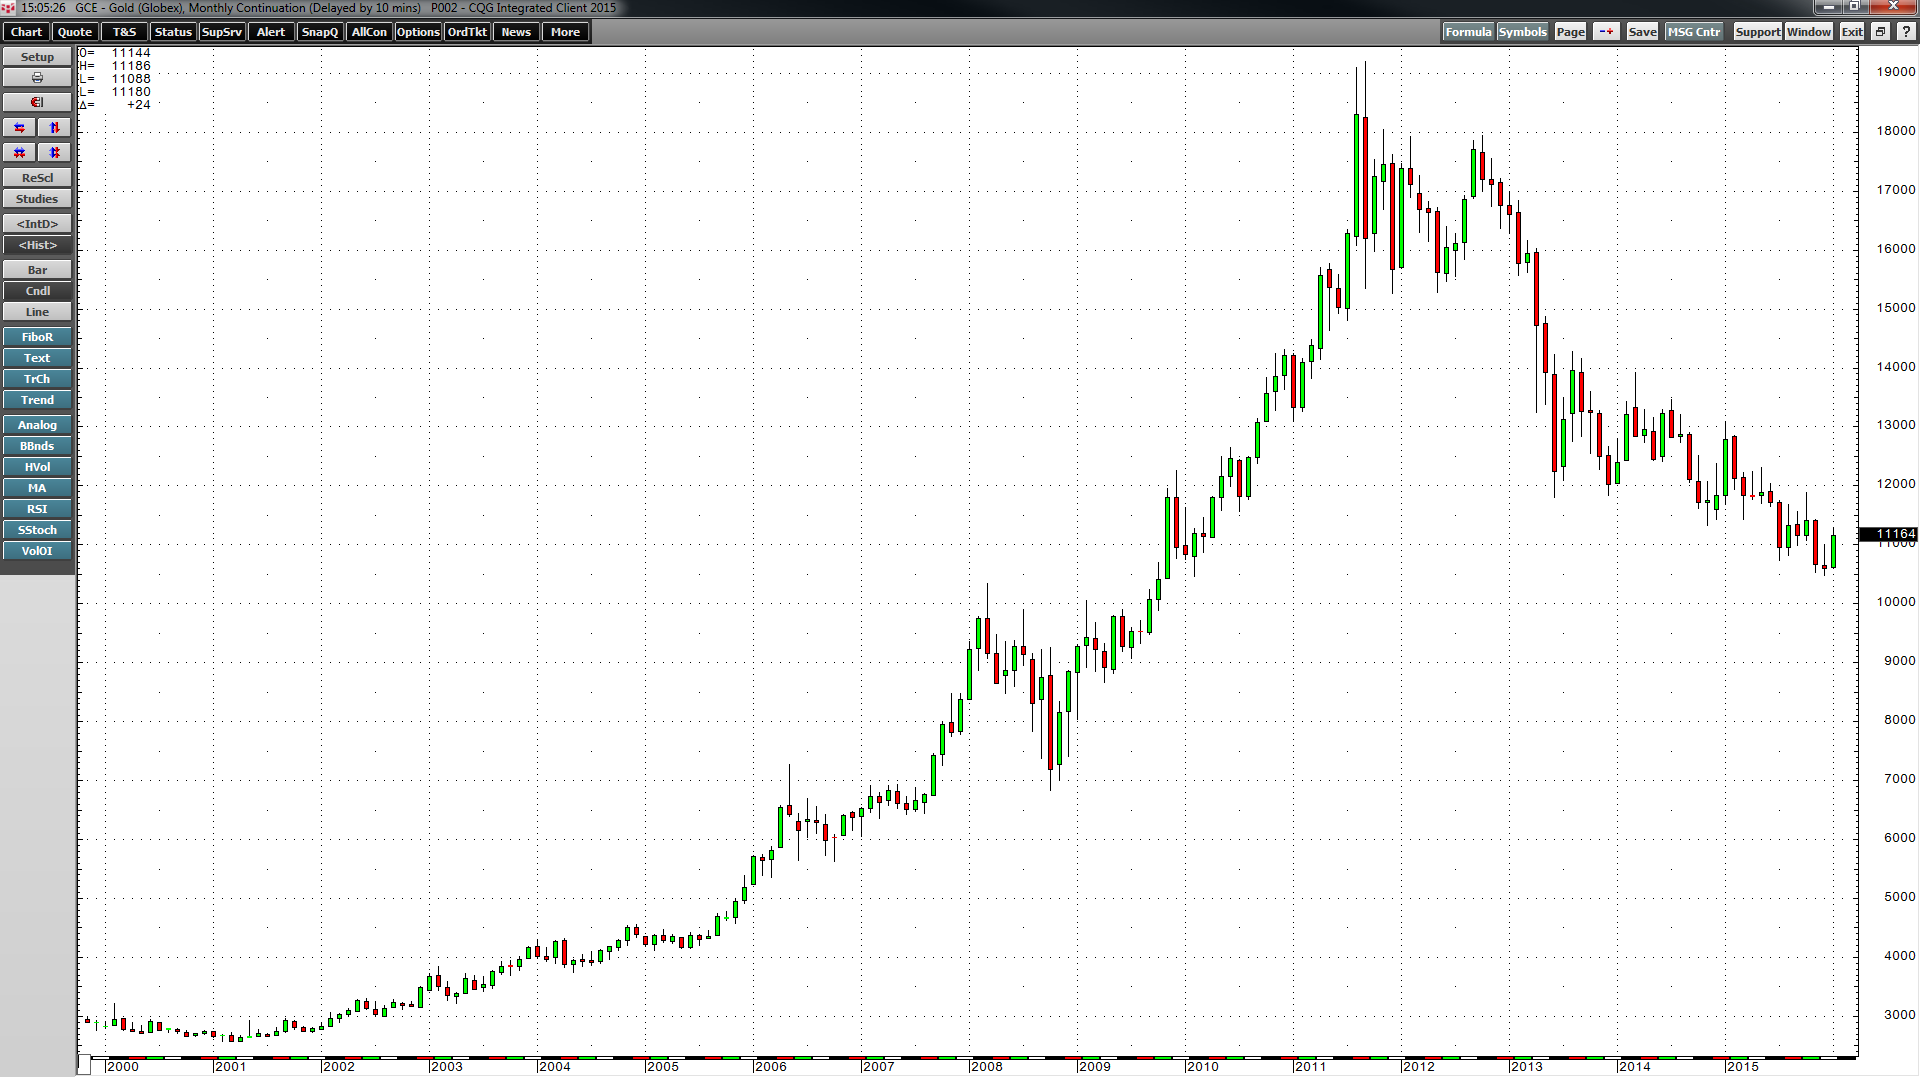
As the monthly chart highlights, COMEX gold has declined from $1920.70 per ounce to $1116.50 at the end of January 2016. While gold has fallen in recent years, shedding close to 42% of its value, other raw materials have done much worse. Therefore, in the current commodity bear market, gold has retained its value to a greater degree than many other staples. Both the historical volatility and price move in gold over the past almost five years has made it more stable than many other commodities.
Volatility in Crude Oil
In June 2014, the price of NYMEX crude oil was just under $108 per barrel. During the month of January 2016, the price of active month crude oil futures fell to the lowest level since 2003, at $26.19 per barrel.
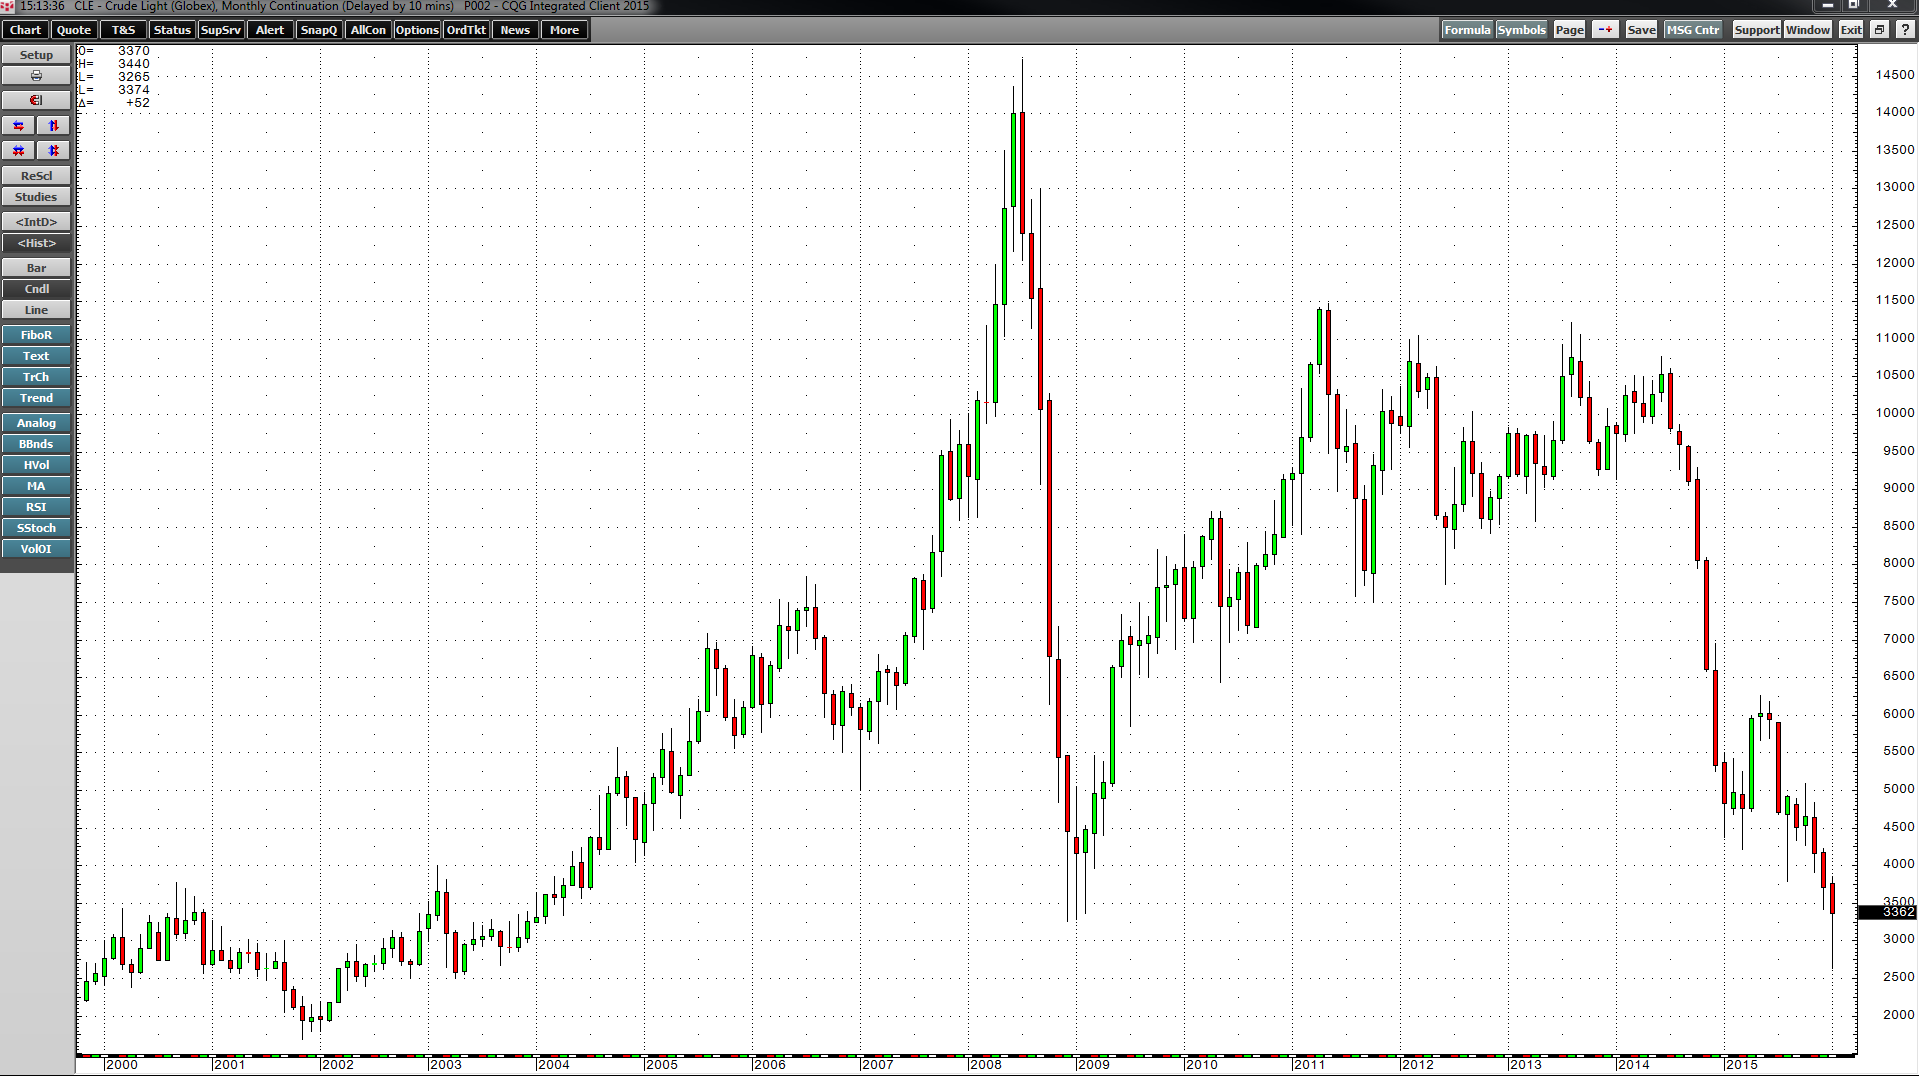
March crude oil futures closed on the last trading day of January at $33.62 per barrel - a decline of 69% from the 2014 highs. Historical volatility in crude oil by virtue of price action has resulted in this energy commodity being anything but stable.
The Gold-Crude Oil Spread
Crude oil is purely an energy commodity; gold is a metal and a currency. Gold has been around longer than any paper currencies in existence today and it is likely to be around long after they are gone.
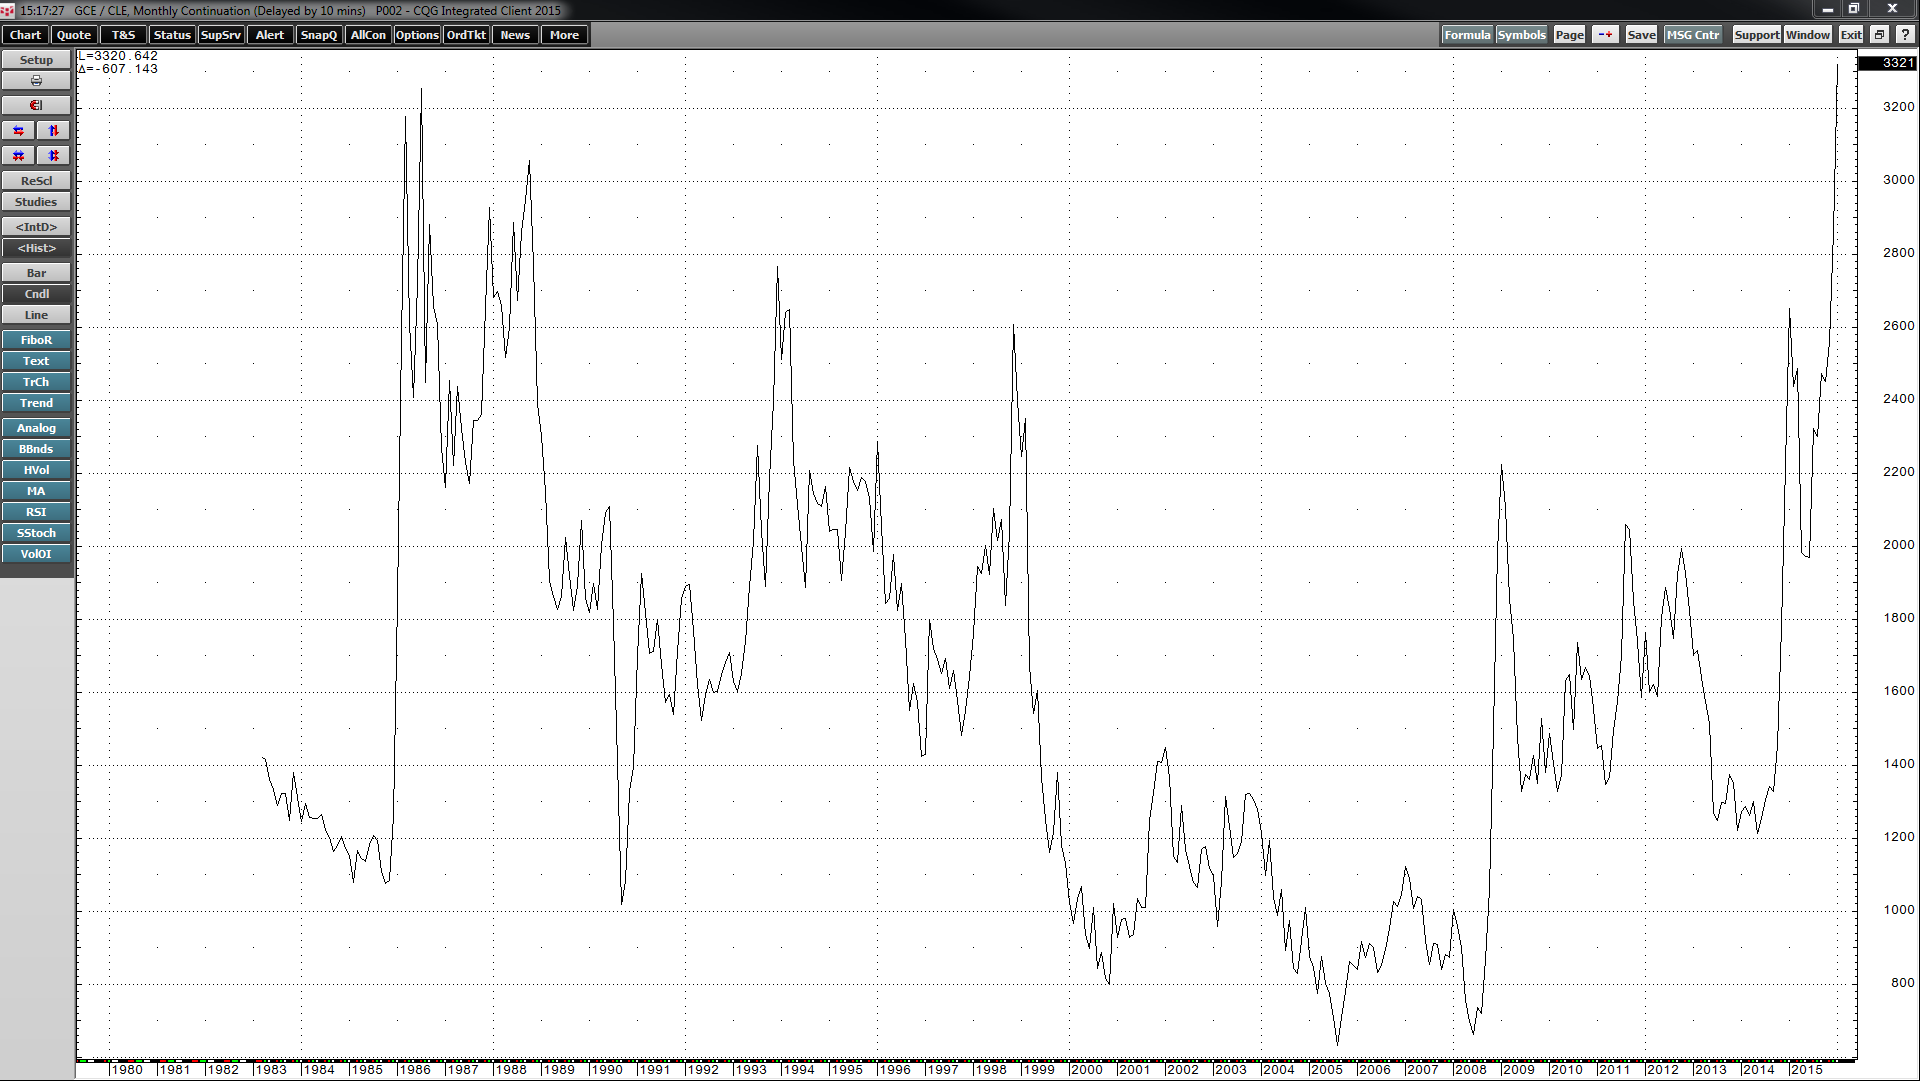
This monthly chart highlights the price of COMEX gold futures divided by the price of NYMEX crude oil futures dating back to 1983. At the lows in 2005, one ounce of gold bought around 6.3 barrels of crude oil. The average number of crude oil barrels in the value of one ounce of gold over the 33-year history of this intercommodity spread is around 20. That level is fair-value in terms of the history of futures trading between these two commodities. Therefore, when the spread is below 20, oil is expensive relative to gold on a historical basis. When it takes more than 20 barrels of oil to purchase an ounce of gold, the oil is cheap relative to gold.
Last month we saw a divergence in this spread that took it to the highest level since futures trading for both commodities commenced.

The daily chart of the gold-oil spread illustrates that on January 20, 2016, one ounce of gold was equal to the value of 39 barrels of crude oil. This told us that oil was cheap, gold was expensive, or a bit of both. What it really highlighted was a huge historical divergence in value between the energy commodity and the precious metal.
This spread closed at the end of January at just over 33 - it remains around 13 barrels above the long-term mean. While the divergence narrowed over the final ten trading days of the first month of 2016, it remains a deviation from the norm. If we go back to the monthly chart, there were only two years in history, 1988 and 1986, where an ounce of gold bought more than 30 barrels of oil.
The Bottom Line
The intercommodity spread between gold and crude oil tells us something that the nominal price of each commodity cannot. It tells us that on a historical basis, gold is expensive relative to the price of oil, or oil is cheap relative to the price of gold. Regardless of which is true, it is a comment on the value of each commodity.
The number of barrels of oil in each ounce of gold value has risen to a level that constitutes a long-term deviation from the historical norm. This could present an opportunity for traders, as over time, deviations like the one we are witnessing in the gold-oil spread tend to revert to the mean.