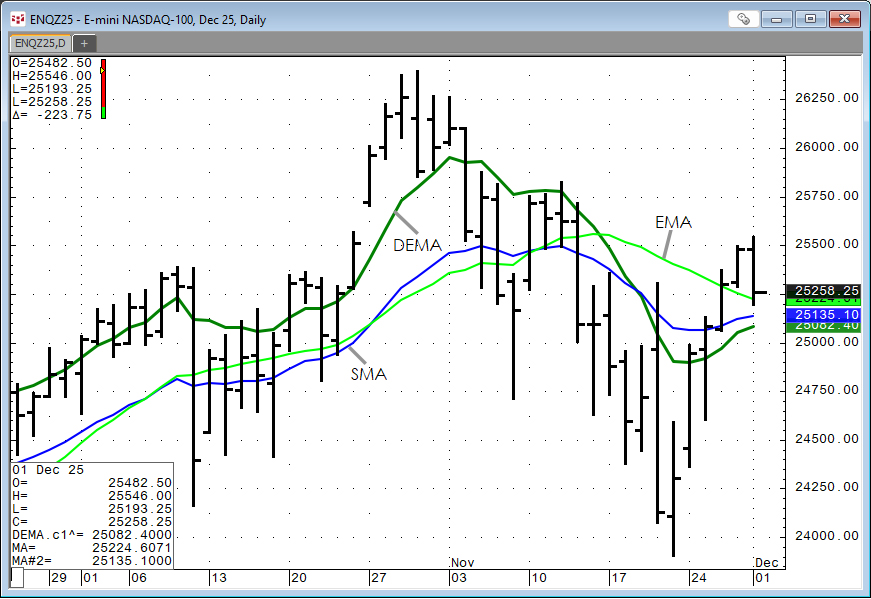
The Double Exponential Moving Average study is a moving average calculation that reduces the lag associated with other moving averages. The Double Exponential Moving average is calculated as the… more
Studies
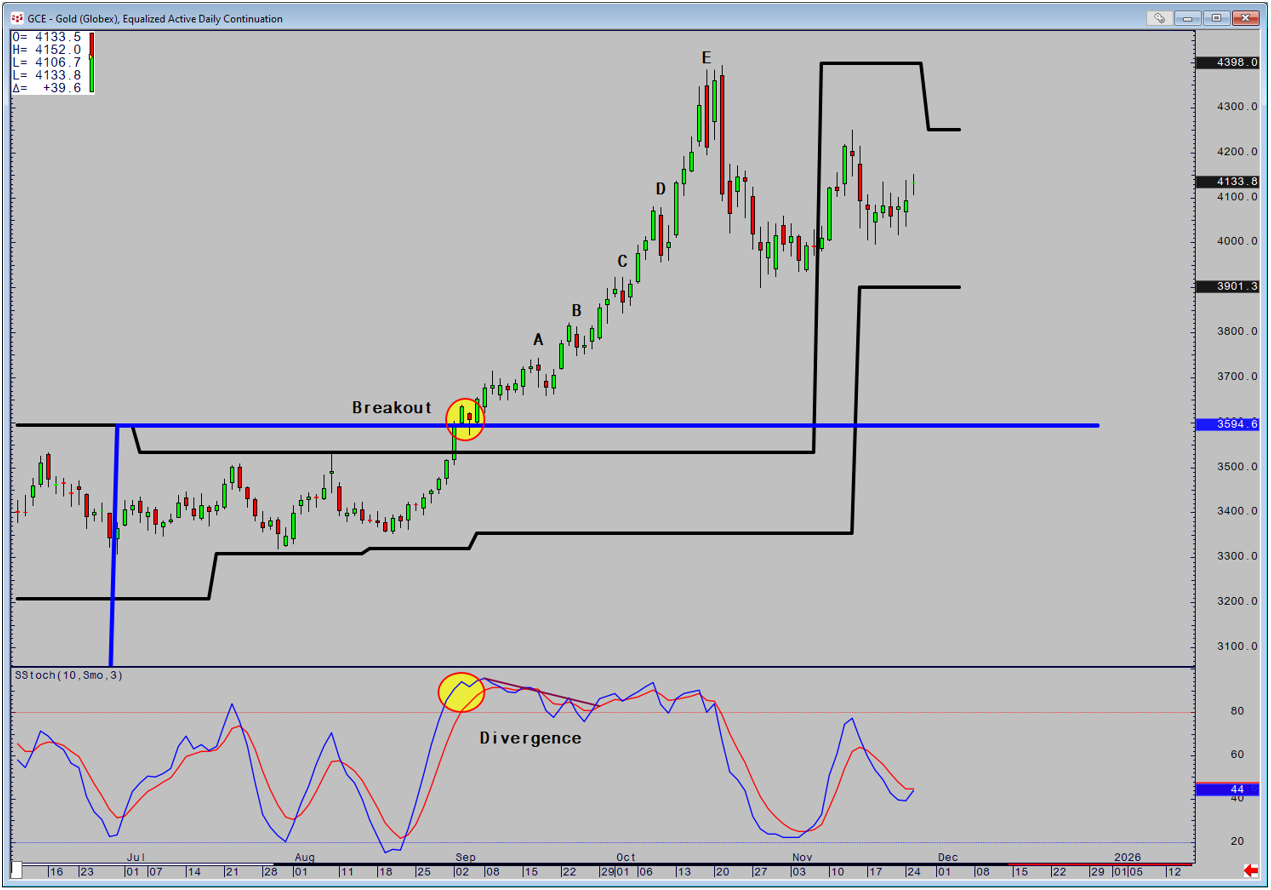
Read Quantifying Divergence Part 2Read Quantifying Divergence Part 3
Divergence can be likened to being able to see an eel in clear water. It's highly visible but try picking it up and holding on.… more
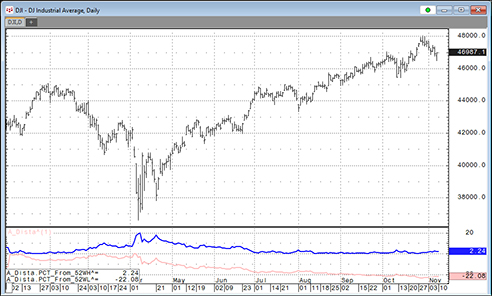
This post offers a downloadable CQG PAC for IC and QTrader and Excel dashboard that includes two custom studies that track a market's performance by measuring the price difference between the… more
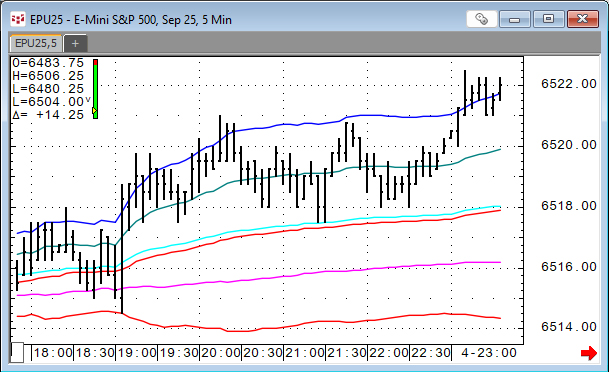
VWAP is the volume weighted average price for a futures contract plotted as a line on the price chart. The calculation is the sum of traded volume times the price divided by the sum of the traded… more
Trading Studies
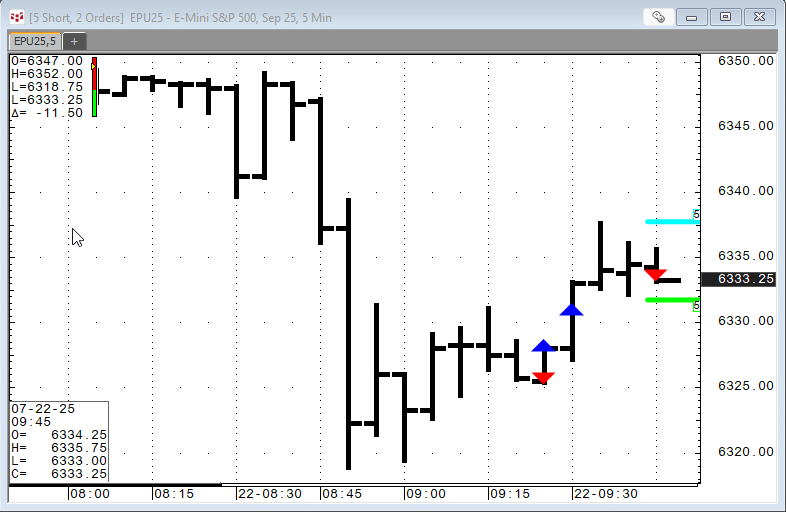
This set of studies provides the Order Display study (indications on a chart for filled and working orders), open trade equity, current position, and profit and loss account… more
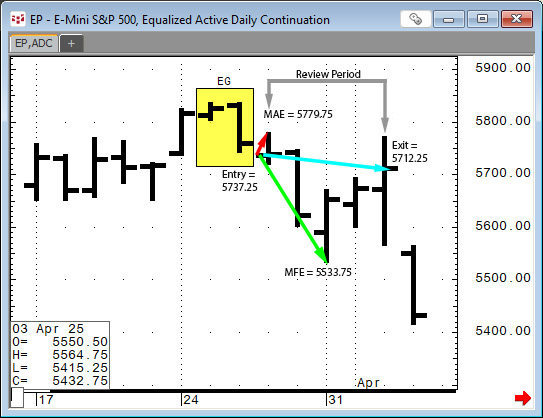
This post provides a guideline to reviewing the outcomes of a pattern recognition approach to the markets.
Two recent posts on Workspaces discussed CQG's Candlestick Formations Study.
… more
A recent post "CQG Primer: Candlesticks Formations Study" introduced this study available in CQG IC and QTrader. The study is a collection of fifteen conditions. The Candlestick formations appear… more
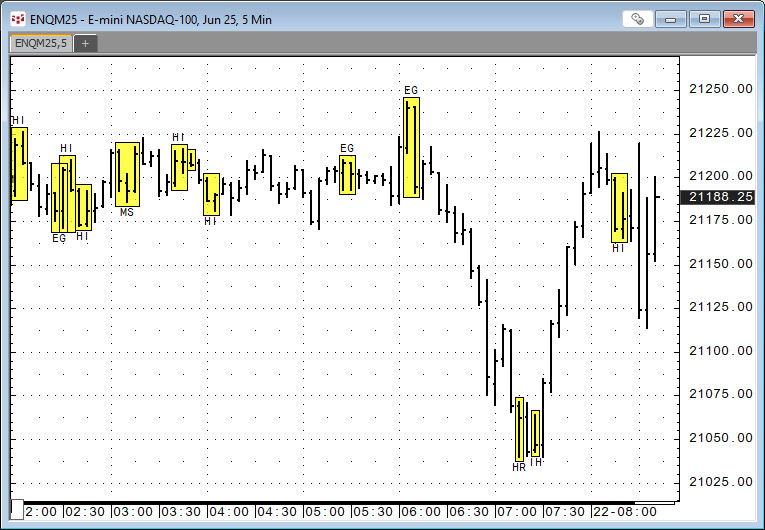
CQG IC and QTrader offer the Candlestick Formations study.
The Candlestick Formations study is a collection of conditions. Candlestick formations appear as overlays on the chart in the… more
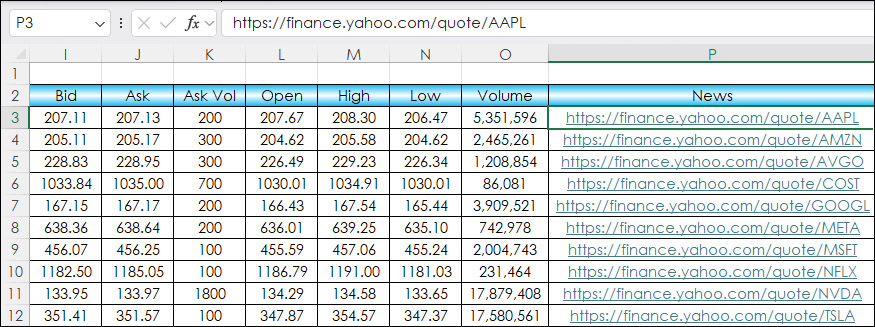
This post details adding HTML News Links to an Excel dashboard for monitoring equities and ETFs.
The news source is Finance.Yahoo.com. An example link for Microsoft is https://finance.yahoo.… more
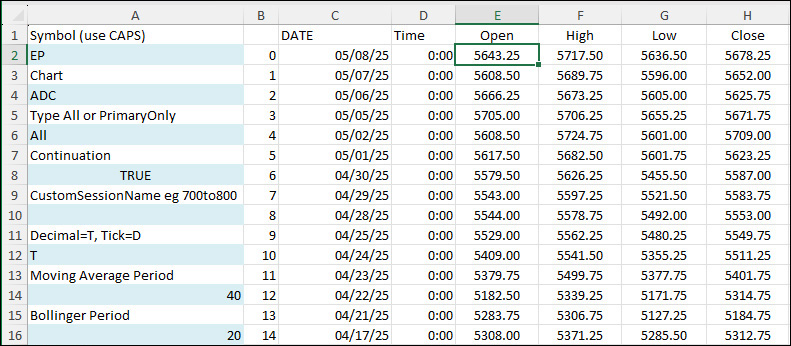
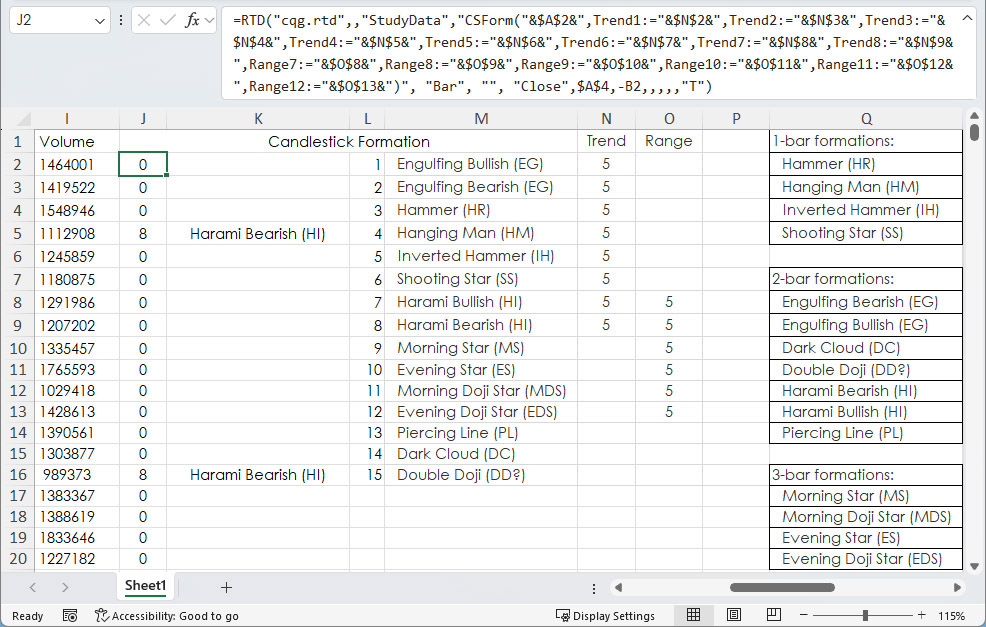
This post offers a downloadable sample Excel spreadsheet for pulling in historical data and study values from CQG IC or QTrader using RTD formulas.
The Data consists of:
Open, High, Low,… more