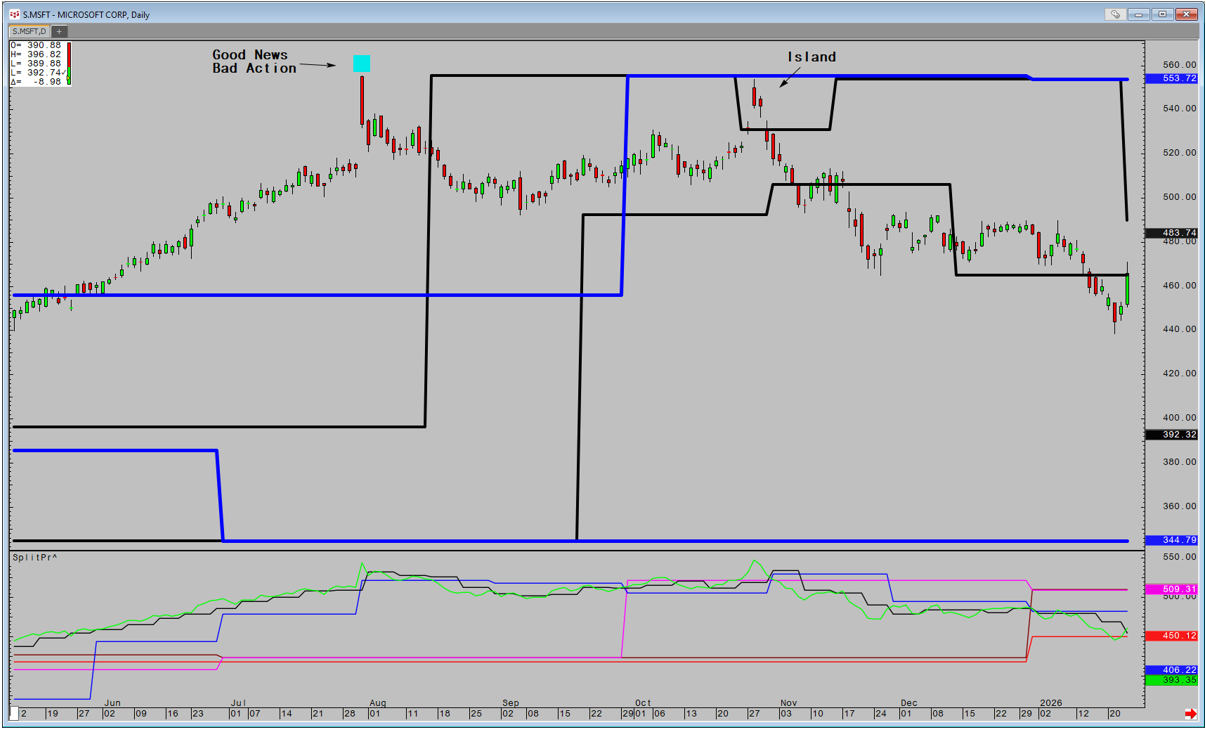
The switch from my haven of Futures and Fx, to the world on USA equities and ETF's to run a Hedge Fund, presented a new set of challenges. My world had moved from 80 instruments to focus on to… more
Studies
Read Quantifying Divergence Part 1Read Quantifying Divergence Part 2
Traditionally, divergence is quantified by taking the relationship between the high in an uptrend and low in a downtrend and… more
In Mr. Ehlers Book “Cybernetic Analysis for Stocks and Futures” the “Leading Indicator” was introduced. The goal of this study was to smooth the price action while not having the lag by the study… more
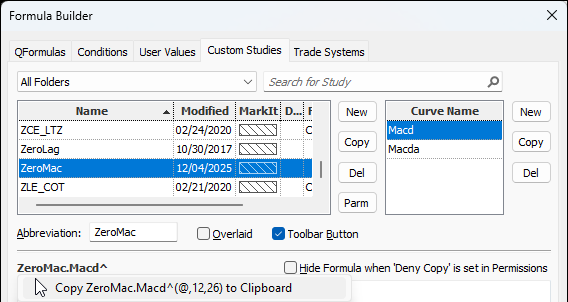
This post details the steps to pulling custom study values into Excel using RTD formulas. First, an overview of RTD formulas and parameters.
When CQG IC or QTrader are installed, a DLL… more
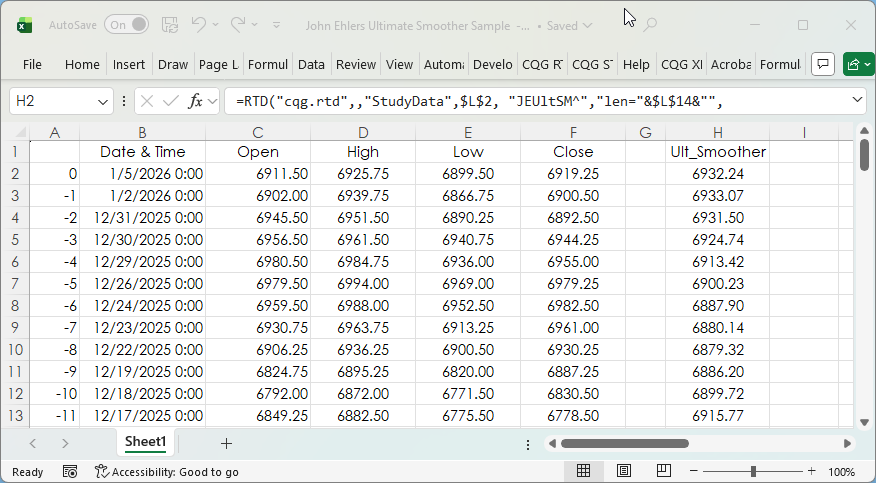
The post CQG Primer: The Ultimate Smoother detailed a study developed by John Ehlers. You can find a detailed description of the Ultimate Smoother on the MESA Software website.
This post… more
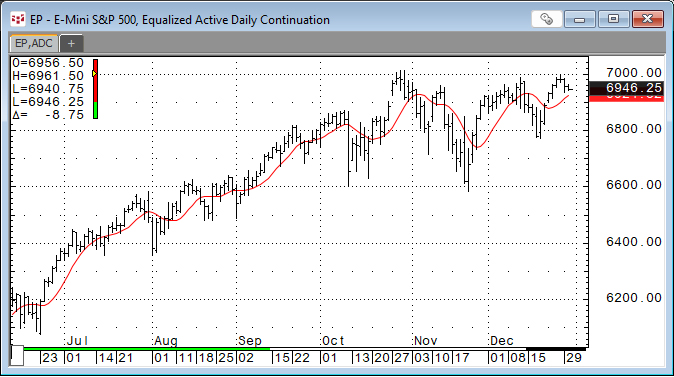
John Ehlers developed the Ultimate Smoother study. https://www.mesasoftware.com/TechnicalArticles.htm The study is a two-pole low-pass digital filter designed to smooth price data while… more
Read Quantifying Divergence Part 1Read Quantifying Divergence Part 3
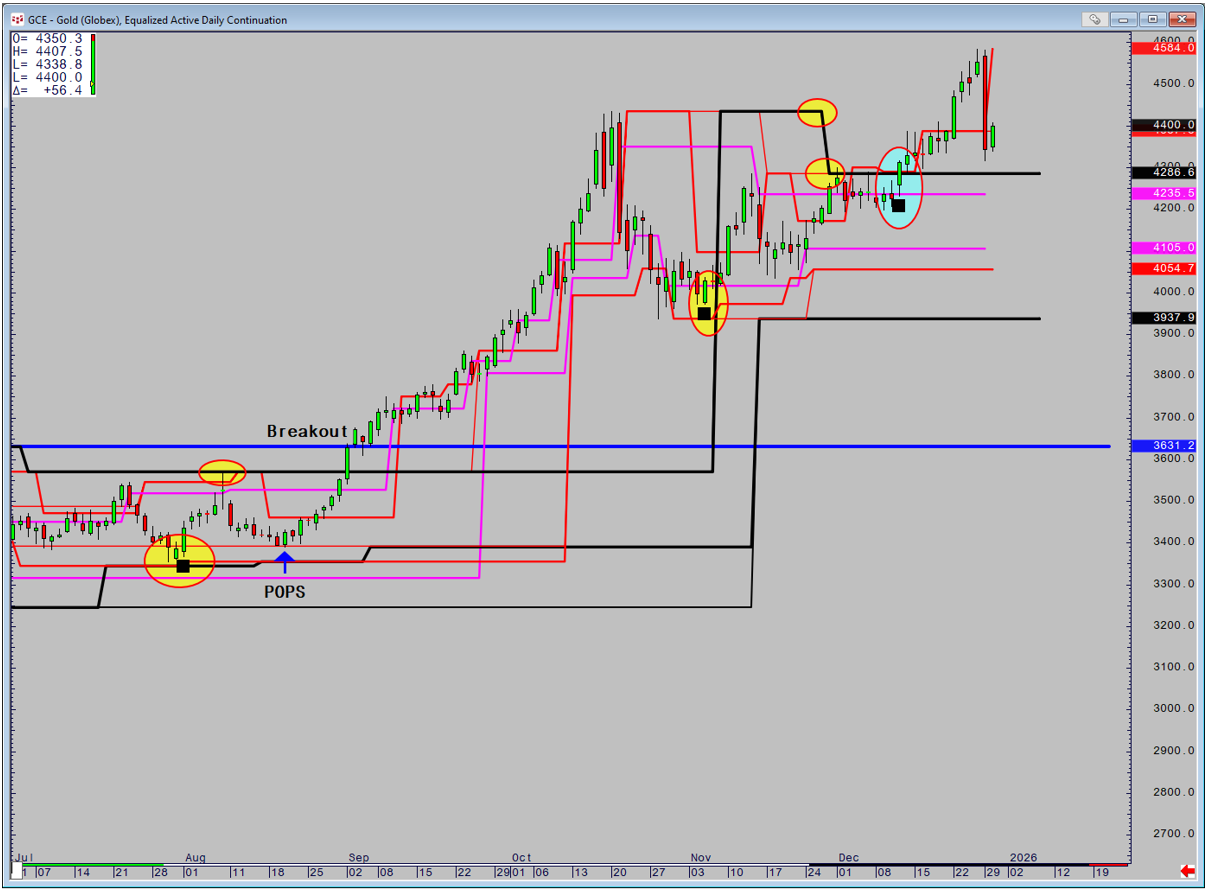
Whilst POPS (Price makes a nine-bar high, or low and the RSI makes a three-bar high or low) and UFO (Price makes a 9 Bar high… more
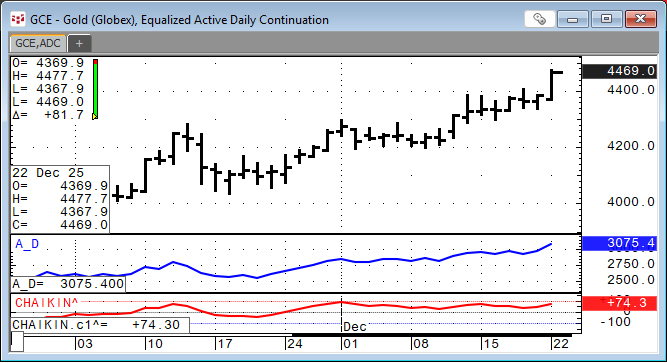
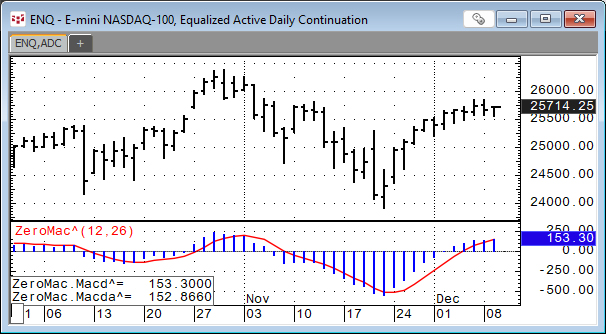
Developed by Marc Chaikin, the Chaikin Oscillator is a technical analysis tool traders and investors use to confirm trends and indicate possible trend reversals. The oscillator uses the… more
This post detailed the Double Exponential Moving Average Study or DEMA. DEMA is helpful for technical analysis because it reduces the lag of traditional moving averages, such as the simple moving… more
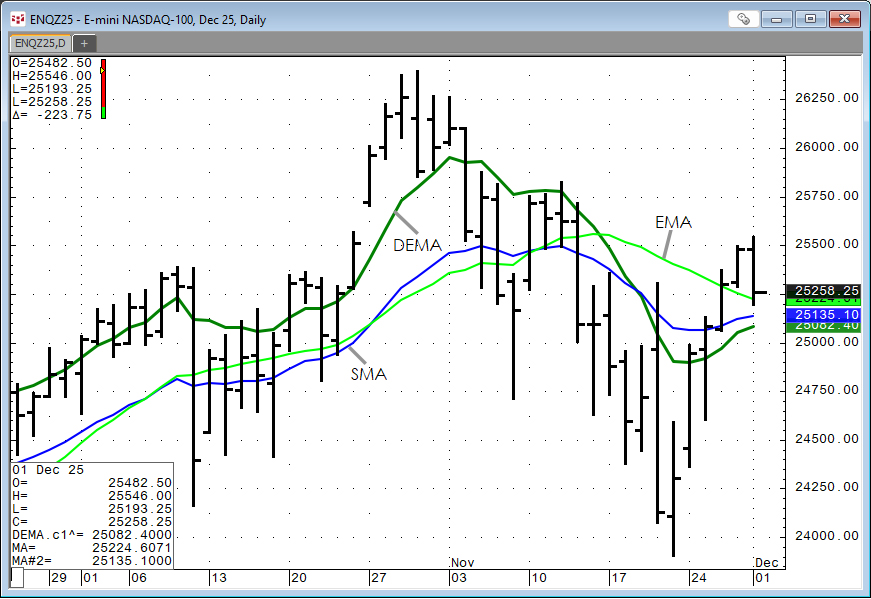
The Double Exponential Moving Average study is a moving average calculation that reduces the lag associated with other moving averages. The Double Exponential Moving average is calculated as the… more