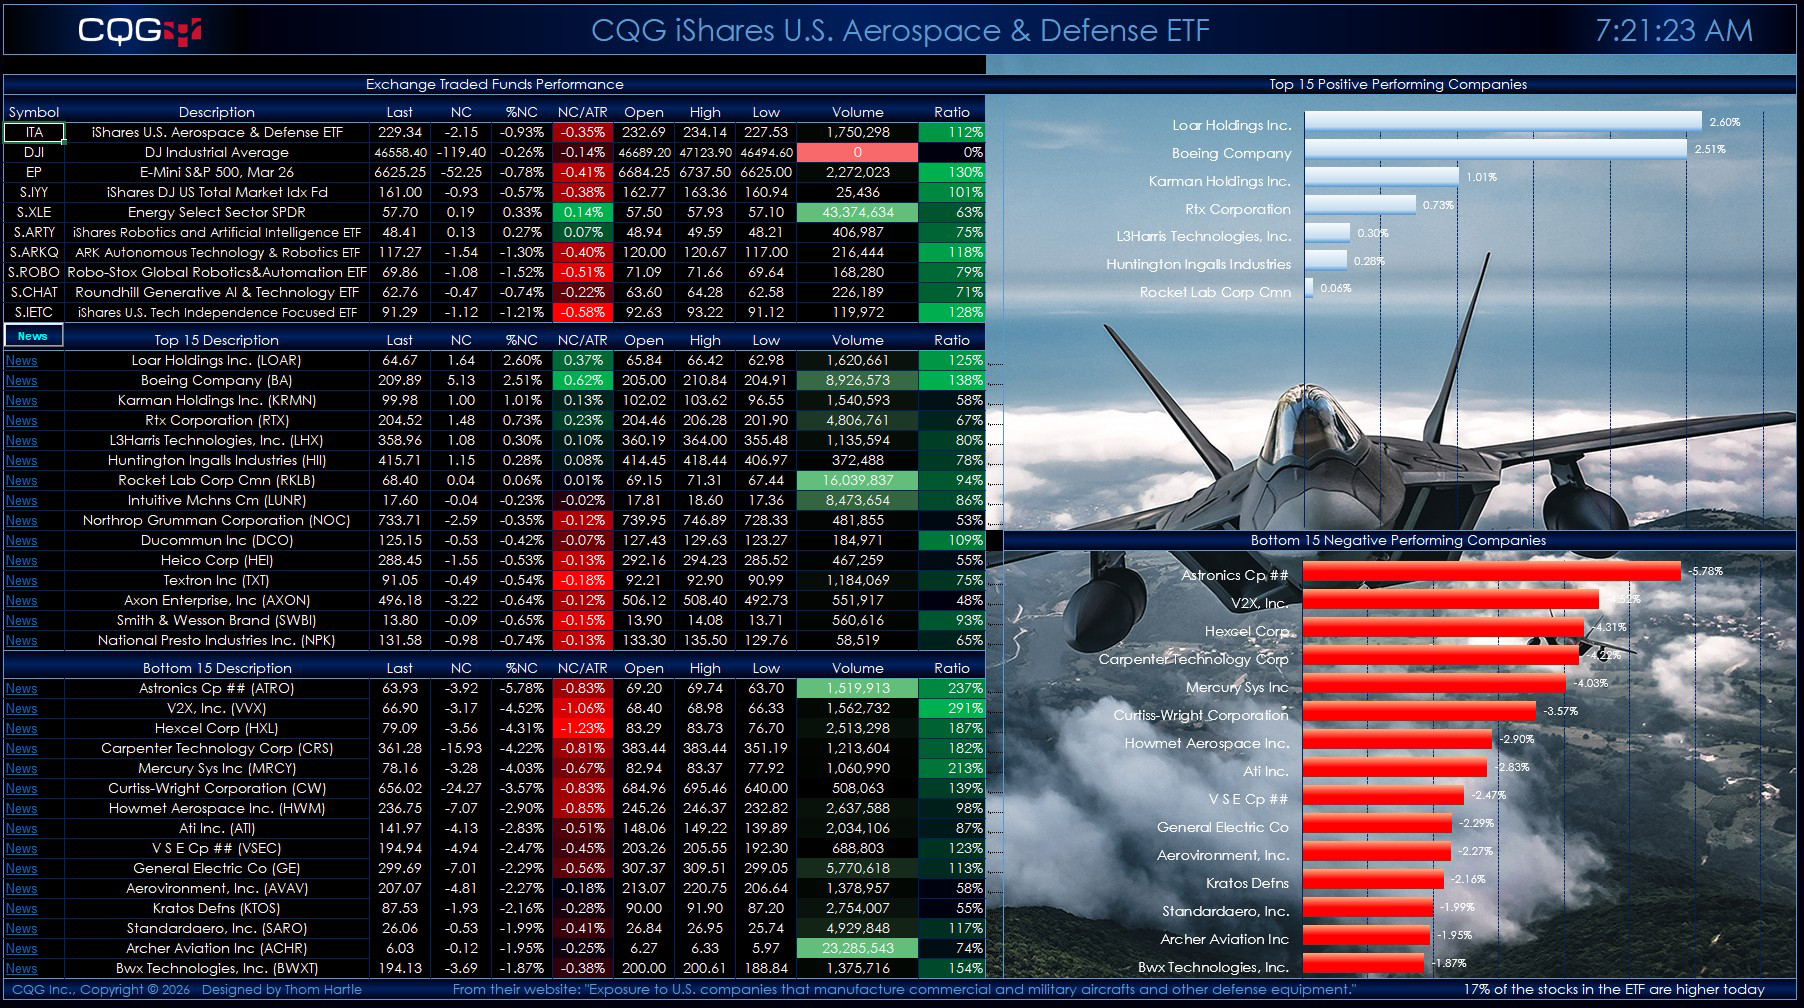
This post offers two Excel dashboards for tracking the holdings of the iShares U.S. Aerospace & Defense ETF (Symbol: ITA).
The iShares U.S. Aerospace & Defense ETF seeks to track the… more
This post offers two Excel dashboards for tracking the holdings of the iShares U.S. Aerospace & Defense ETF (Symbol: ITA).
The iShares U.S. Aerospace & Defense ETF seeks to track the… more
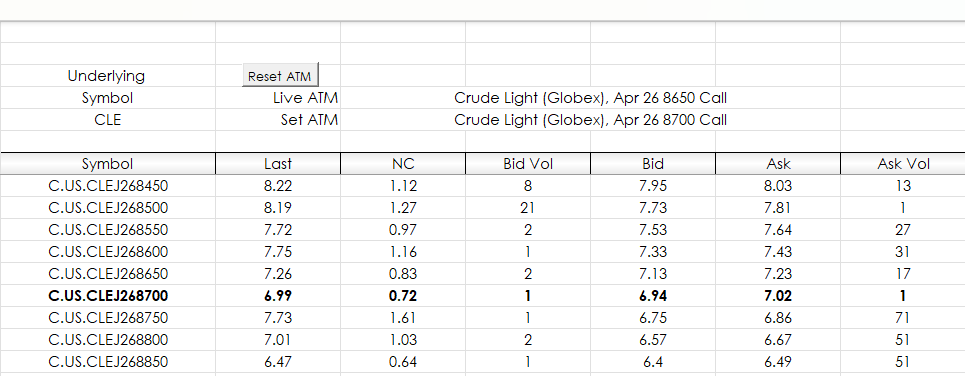
This macro-enabled Excel dashboard pulls in futures call and put options data for a specific underlying contract. There are two tabs: Call Data and Put Data.
Each tab has the following… more

Microsoft Excel's PROPER Function simply "Capitalizes the first letter in a text string and any other letters in text that follow any character other than a letter. Converts all other letters to… more
This post details a CQG PAC that can be downloaded and installed to track the day's performance of the holdings of the iShares Expanded Tech-Software Sector ETF (Symbol: IGV).
From the… more
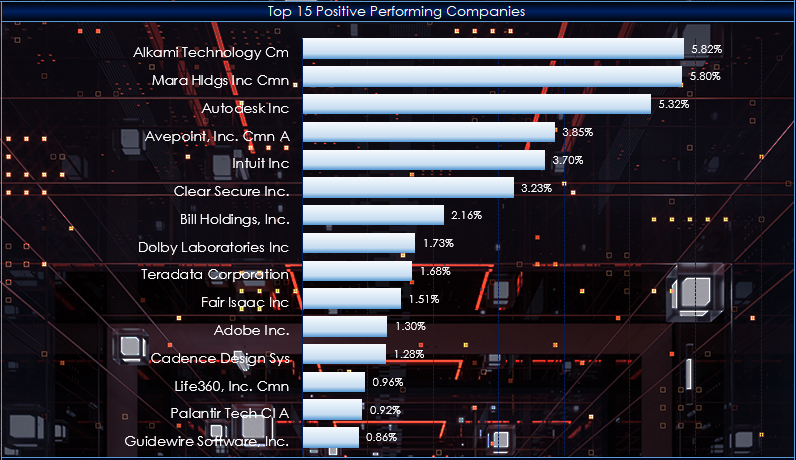
This post details a Microsoft Excel dashboard that tracks the day's performance of the holdings of the iShares Expanded Tech-Software Sector ETF (Symbol: IGV).
From the iShares website… more
This video, presented by CQG Product Specialist Helmut Mueller, walks you through using his Super Template for developing and testing a trading system.
The Super Template is installed in CQG… more
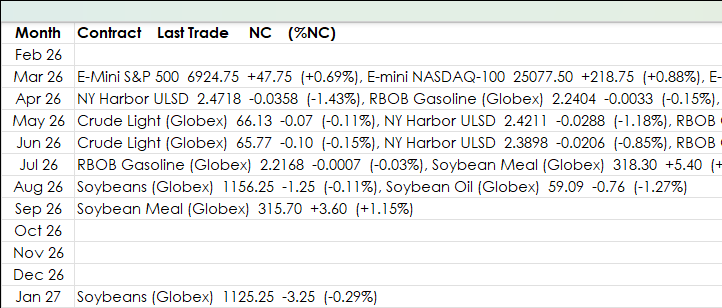
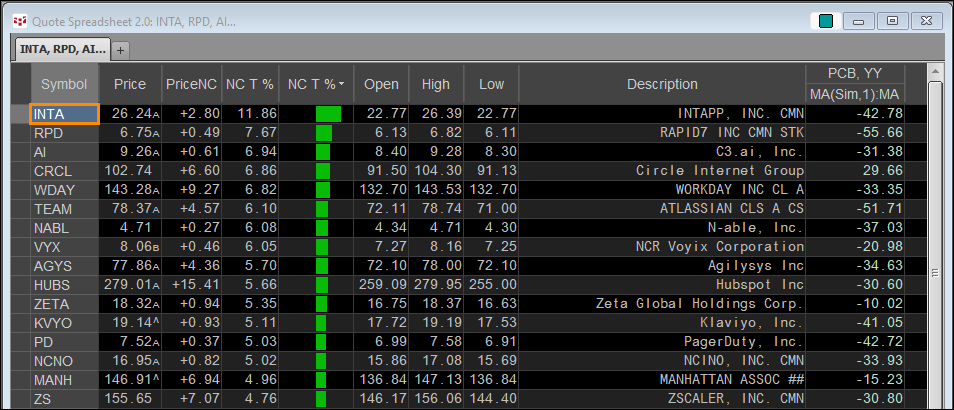
The previous post: "Excel 365 REDUCE and LAMBDA Functions" detailed using Excel's REDUCE and LAMBDA functions to display a table of markets that are sorted by the contract month from a table of a… more
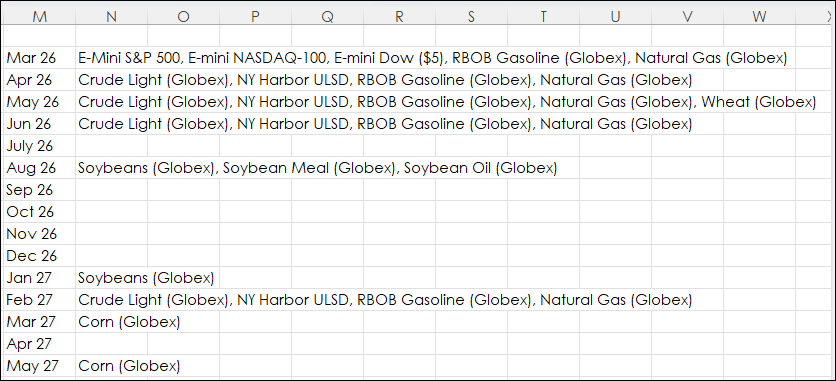
This post details using Excel's REDUCE and LAMBDA function to extract particular data from an Excel dashboard tracking many different markets. For example, the image below displays market data for… more
This video, presented by CQG Product Specialist Helmut Mueller, walks you through applying the CQG Trade System Optimizer (TSO) to a basic system programmed in CQG IC. This video is a follow up to… more
This video walks you through setting up your pages in CQG One or CQG Desktop. For best viewing, click "Watch on YouTube" and then full screen. Topics in this video include:
Introduction to the… more