The Average True Range (ATR) study takes the moving average of the true range over the specified period.
Definitions:
- True Range = True High - True Low
- True High = The greater of the current bar's high or the previous bar's close
- True Low = The lesser of the current bar's low or the previous bar's close
If we put the ATR into the toolbox and apply the PriceToDollar function to it, it will give us the same information, but converted into price instead of points.
Formula:
PriceToDollar( ATR(@,Sim,10))
(Note: PriceToDollar converts points into the currency in which the contract is traded)
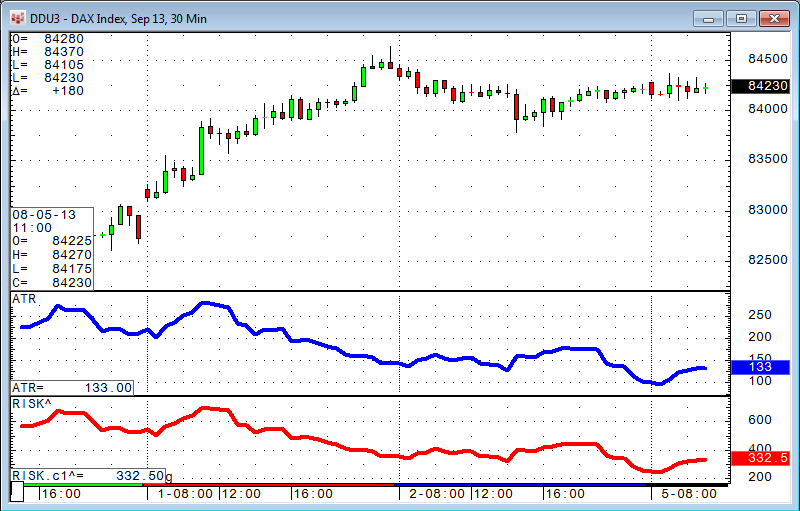
On this thirty-minute DAX chart, the ATR is 13.3 points multiplied by €25 per point resulting in €332.50. In a trading system environment, where you probably have to wait for the next event and/or signal, it would be fair to say that there is an "implied risk" of €332.50 (on average) in any of the bars. Let's assume you are willing to risk €5,000 per trade. Using this risk measurement, you can take €5,000 divided by €332.50 for 15.04 contracts per trade. Inside the toolbox, you can use the floor function to always round that value down to the nearest integer.
Formula:
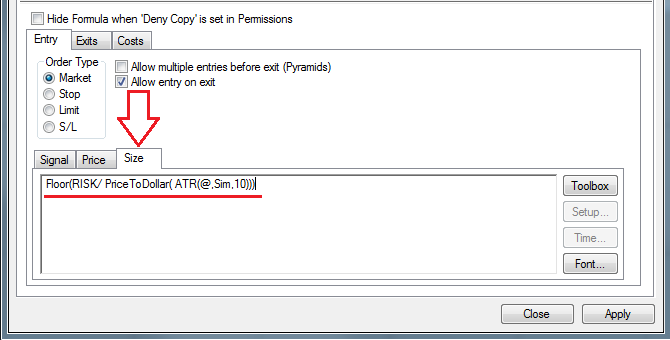
Floor(5000/ PriceToDollar( ATR(@,Sim,10)))
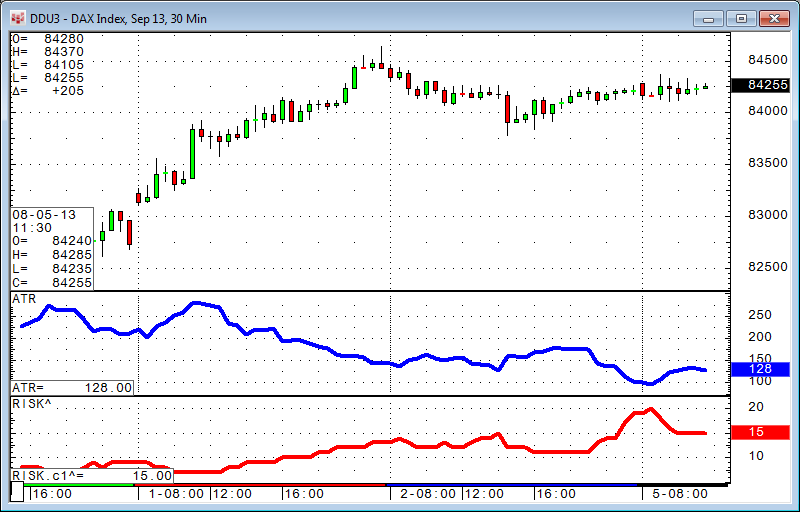
With this formula, we can use the ATR to determine how many contracts we want to trade at any point in time. If volatility increases and the markets move faster, the bars will have a wider range. Therefore, the implied risk increases and the formula would give us less contracts to trade.
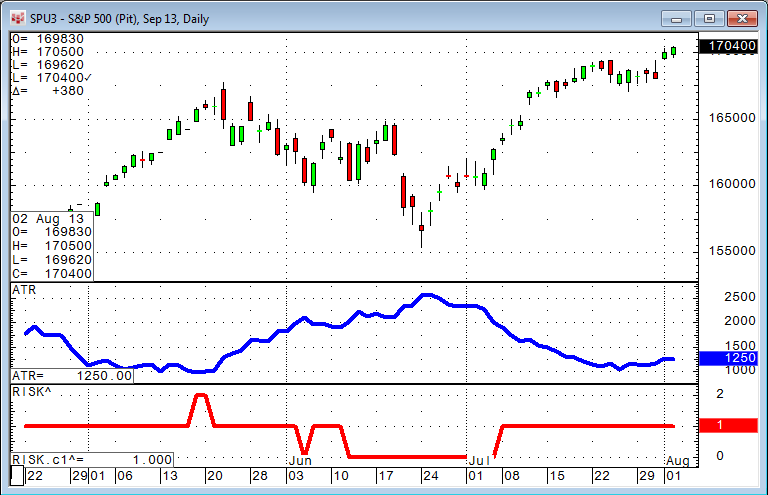
This can also be used to determine the right time frame and/or market to trade. Following the $5,000 and the ATR rule, I could possibly choose not to trade (or to trade with just one lot) the pit-traded S&P on a daily chart.
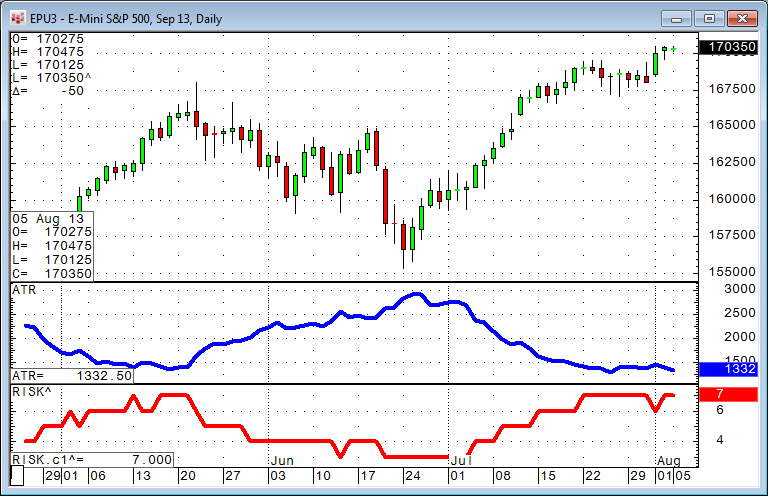
A smaller time frame or the E-mini S&P, which is one-fifth the size of the pit-traded S&P, would work.
If your trading account has €100,000 and you are willing to risk 1% of your equity per trade, your RISK parameter would be €1,000 per trade. The control for how careful or how aggressive you want to trade is in the percent value of your risk control. If you are very conservative, you might want to risk only 0.5% or less per trade. If your approach is more aggressive, you might want to risk 2% or more per trade. The "amount per trade" would be your RISK parameter inside a trading system.
This can also be used for equities.
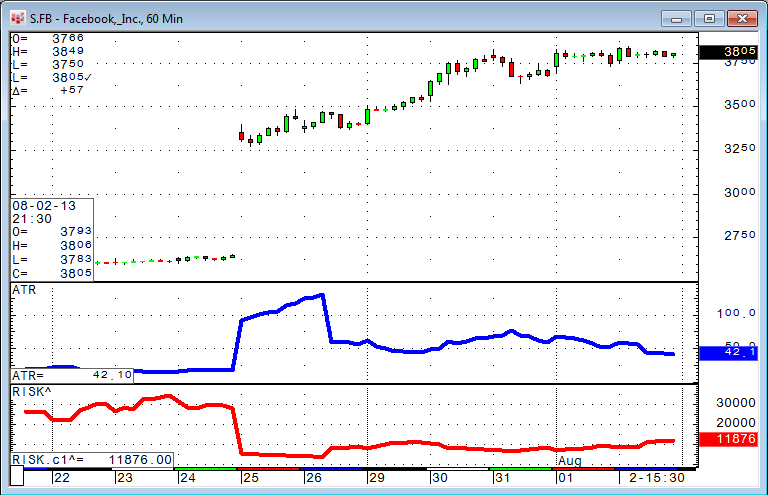
On a sixty-minute Facebook chart, the "implied risk" following the ATR method is around 42 cents. Opening a trade with $5,000 risk would give us the opportunity to buy or sell 11,876 Facebook shares.
It is very important to understand that this is not trading advice or a method. Depending on the nature of the trading system or your risk approach, there might be trading systems that perform "better" with a static number of traded contracts instead of the ATR method. This is the beauty of backtesting. You can test whether or not a method would help your trading system before you risk any real money on it.
The PAC contains the ATRM and RISK studies. The ATRM study calculates the ATR in money instead of points. The RISK study calculates number of contracts to trade based on the RISK parameter.