If we look more closely into trend-following trading systems, sometimes the percentage of winning trades is only slightly above 50%, but the trading system still creates some nice and profitable trades. With smart pyramiding, we can try to make the most possible profit out of the "good" trades.
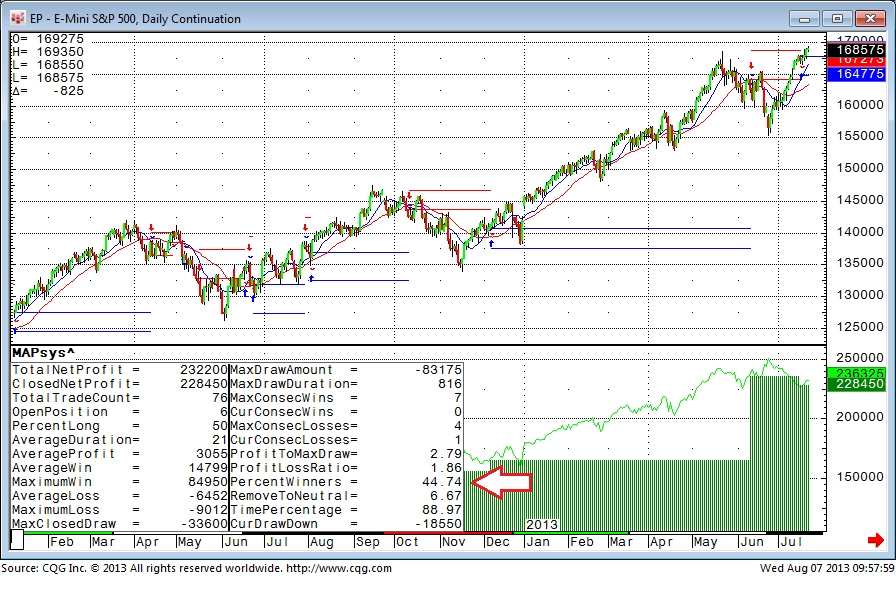
This is a very basic sample trend-following system. It uses two simple moving averages with a trade setup on the open of the next bar after the crossover. The quantity traded is based on a $5,000 risk per trade approach as discussed in my ATR-Based Quantity and Risk article.
The trading system is creating some profit, although it has only 44% winning trades. As the next step, we can try to add two more trades on these trending situations, but only when the first trade is already making 1.5 times the initial risk exposure (i.e. $5,000 * 1.5 = $7,500) and the trend is still on.
The quickest way to do this is to simply copy the Long1 trades to Long2 and Long3, and the Short1 to Short2 and Short3. This automatically takes all the exits with it.

The initial Long1 signal is MA(@,Sim,fast)[-1] XABOVE MA(@,Sim,slow)[-1], where the length of the moving averages are represented by two parameters: "fast" and "slow".
On the Long2 we change XABOVE into a "greater than" sign and add one line of code to make sure the profit of trade Long1 is greater than 1.5 times the initial risk exposure.
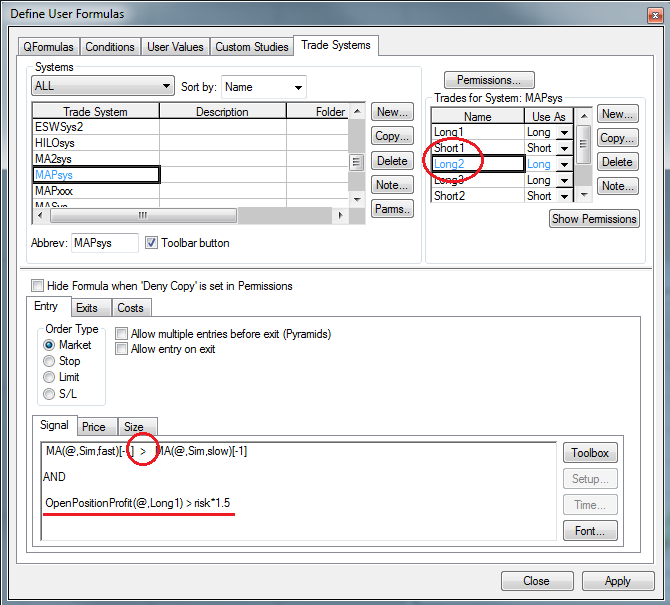
Long3 works the same way and checks the open position profit of trade Long2.

Now, trade two kicks in when the initial trade has earned 1.5 times the initial risk exposure and trade three kicks in when trade two earns back the risked amount. As a result, the percentage of winners increases from 44% to 52% and the closed net profit has more than tripled. It would, of course, be possible to pyramid even more than three times.
It is important to understand that this is not a perfect trading system. I picked the two moving averages on purpose to give a textbook example of how to do the pyramid coding. The results seem to be pretty nice, but looking into the optimization of the two moving averages, the profit lines very unstable from one set of parameters to the next. It is very obvious that this is not a stable environment at all.
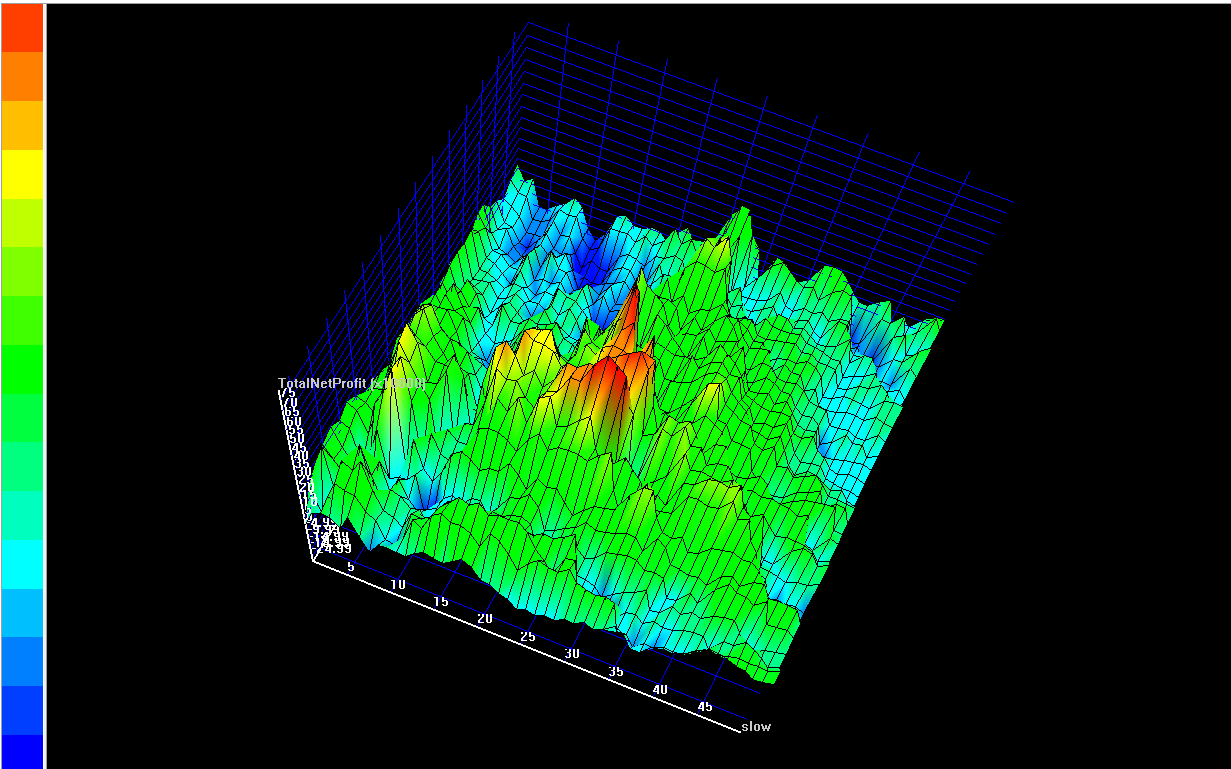
3D view after optimizing the two moving averages in this trading system. X-axis = length of slow moving average 1-50 periods. Y-axis = length of fast moving average 1-30 periods. Z-axis = total net profit * 10,000.