This is an update to the 6 trading systems published about one year ago.
On customer request, we added the ability to set a start and end time as well as an exit based on time.
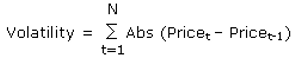
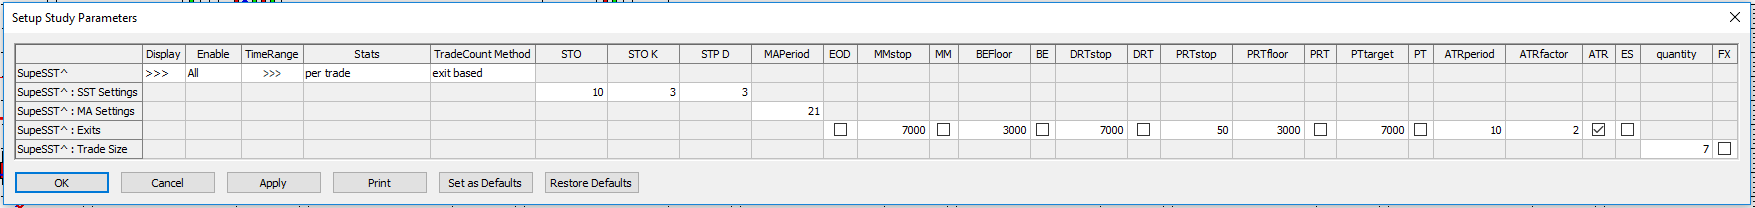
The idea is to have a few standard trading systems that have many customizable exits already built in:
- EOD - End Of Day will exit any position at the last bar of the day when checked.
- MMstop - Money Management is a simple stop loss. You just need to specify the amount.
- MM - Money Management Stop is on if checked.
- BEFloor - Break Even Exit will close the position when it returns to its entry price. It needs to reach a certain amount of profit (Floor) before it is activated.
- BE - Break Even Exit is on if checked.
- DRTstop - Dollar Risk Trailing is a classic trailing stop that is based on maximum profit during the trade (calculated by each close).
- DRT - Dollar Risk Trailing is on if checked.
- PRTstop - Percent Risk Trailing puts a stop below the maximum profit close to risk x% of the money already gained in the trade. The value is in percent.
- PRTfloor - Percent Risk Trailing needs to reach a certain amount of profit (Floor) before it is activated.
- PRT - Percent Risk Trailing is on if checked.
- PTtarget - Profit Target exits a position if a certain amount of money is gained.
- PT - Profit Target is on if checked.
- ATRperiod - Average True Range trailing stop uses the value of the Average True Range study when a trade is initiated. ATRperiod is the length of the ATR measurement.
- ATRfactor - ATRfactor is the parameter that determines how many ATRs the stop is placed away from the market.
- ATR - Average True Range trailing stop is on when checked.
- ES - Entry Stop places an initial stop on the low (for long trades), or on the high (for short trades) of the entry bar. Entry Stop is on if checked.quantity - quantity is the trading size, in contracts, for a stock or future trade.
- FX - If FX markets are traded, the quantity gets multiplied by 100,000. If you want a clip size of 1,000,000 per trade, that is a quantity of ten with FX multiplier checked.
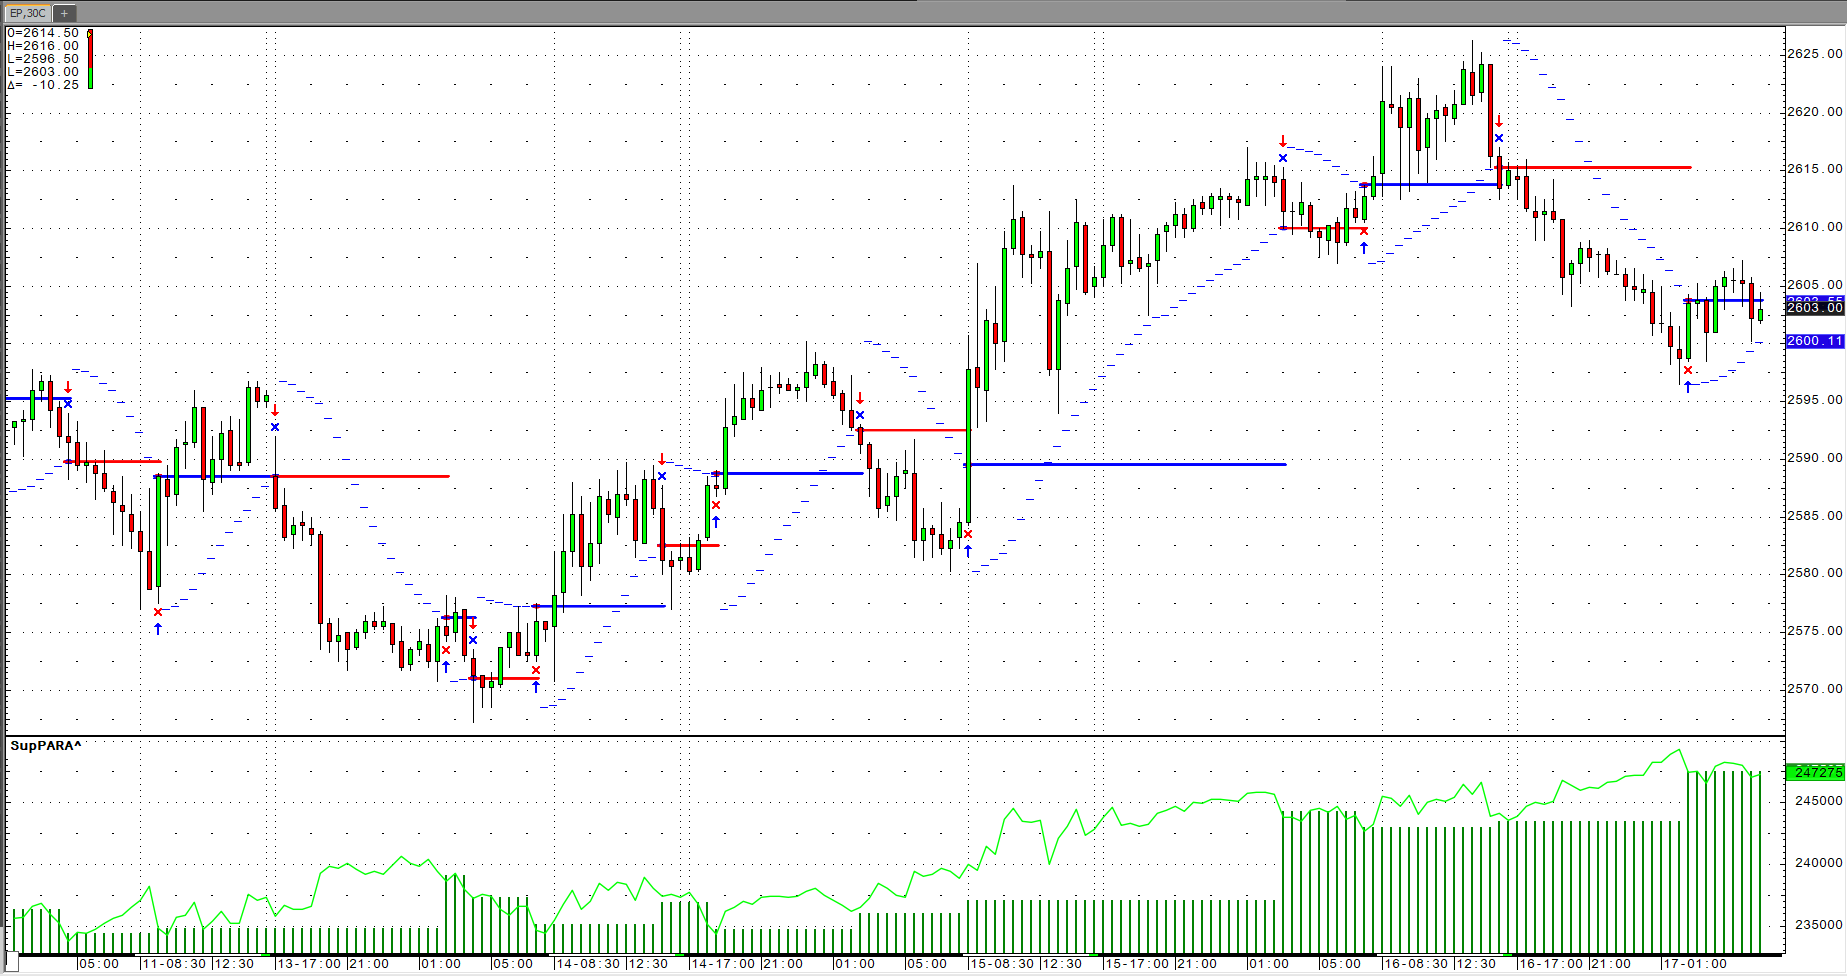
Super Para Parabolic (Para)
Welles Wilder's Parabolic SAR study is a time/price reversal system. The letters "SAR" stand for "stop and reverse" meaning that the position is reversed when the protective stop is hit.
It is a trend-following system. As prices trend higher, the SARs tend to start out slower and then accelerate with the trend. In a downtrend, the same thing happens but in the opposite direction. The SAR numbers are calculated and available to the user for the following day based on the following equation:

Where: AF begins at 0.020 (default value) and is increased by .02 each bar that a new high/low is made (depending on the trend direction) until a value of 0.20 is reached; EP = Extreme Price point for the trade made so far (if Long, EP is the extreme high price for the trade; if Short, EP is the extreme low price for the trade).
Thus, the Parabolic Time/Price System rides the trend until the SAR price is penetrated. Then the existing position is closed out and the reverse position is opened.
| Parameter | Description |
|---|---|
| StepFactor | Percentage of the previous move used to calculate the new position. |
| StartValue | Start of multiplier factor. |
| MaxValue | Maximum multiplier factor. |
Super AMA adaptive Moving Average (AMA)
The Adaptive Moving Average (AMA) study is similar to the exponential moving average (EMA), except the AMA uses a scalable constant instead of a fixed constant for smoothing the data.
The formula for the exponential moving average is:

C is a smoothing constant where C = 2/(N+1), and N is a number used to approximate a simple moving average. C ranges between 0 and 1. For example, to use an EMA with similar characteristics to a 10-bar simple moving average, use N = 10. Therefore, C = 2/(10+1) = 2/11 = 0.1818.
The formula for the AMA is:

Where SC = Scalable Constant
The AMA uses two constants based on a fast EMA (short look back period) and a slow EMA (long look back period). The scalable constant, which has a range between 0 and 1, weights the AMA calculation between the two exponential moving averages by adjusting the constant. This weighting is based on the degree of market direction relative to market volatility. The higher the degree of trending by the market, the more the weighting shifts to the fast exponential moving average constant. If the market is moving in congestion, then the weighting shifts to the slow exponential moving average constant.
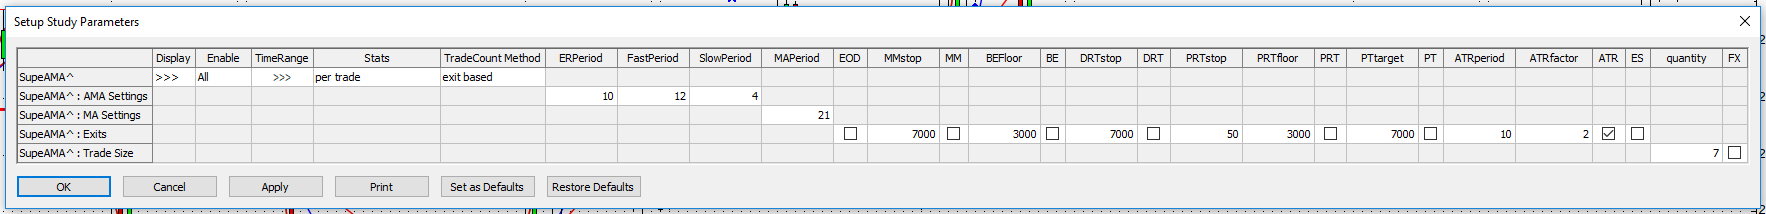
The scalable constant uses a market Efficiency Ratio to determine the degree of trend by the market. The ratio is direction relative to volatility.
Direction is the difference between the current bar’s close and the close N bars back.
Volatility is the difference between each close over N bars back. The absolute value of each difference is summed:
ER = Abs(Direction/Volatility) where,

and
Here, the volatility measurement is the sum of the absolute value of the one bar difference in closes over the look back period N. The default for N is 10 bars.
If the direction and the volatility readings are similar (i.e., the market is trending), the ratio approaches 1. If the direction and the volatility readings are not similar (i.e., the market is in congestion), the ratio approaches 0.
The Efficiency Ratio is used to scale between the two constants from the two exponential moving averages (fast and slow). The default values are 2-bar and 30-bar EMAs. Therefore, the default constants are as follows:
Fast = 2/(2+1) and Slow = 2/(30+1)
Fast = 0.6667 and Slow = 0.0645
The formula for weighting or scaling the constant is as follows:
ER*(Fast – Slow) + Slow or the default version is ER*(0.6667-0.0645) - 0.0645
As stated earlier, if the market is trending, then ER approaches 1 and the scalable constant is weighted towards the Fast constant in the formula above. If the market is in congestion, then ER will approach 0 and the scalable constant is weighted towards the Slow constant.
Finally, the result from the formula above is squared.
SC = (ER*(Fast – Slow) + Slow)2
This causes the AMA to go flat when the market is in congestion because the ER approaches zero and the resulting smoothing constant is a very small number.
| Parameter | Description |
|---|---|
| Display | Opens sub-window to set parameters
|
| MarkIt | Opens Specify Conditions window. |
| Offset | Distance in bars between the current bar and the bar to use in the calculation. A positive offset uses future bars. A negative offset uses past bars. For example:
|
| ER Period | Number of days used to calculate the Efficiency Ratio (direction/volatility ratio). |
| Fast Period | Value used to calculate the smoothing constant for the fast EMA. Smoothing constant = 2/N+1, where N is the fast period |
| Slow Period | Value used to calculate the smoothing constant for the slow EMA. Smoothing constant = 2/N+1, where N is the slow period |
| Price | Determines the price used in the calculation. |
This trading system is identical to the SuperTemplate.

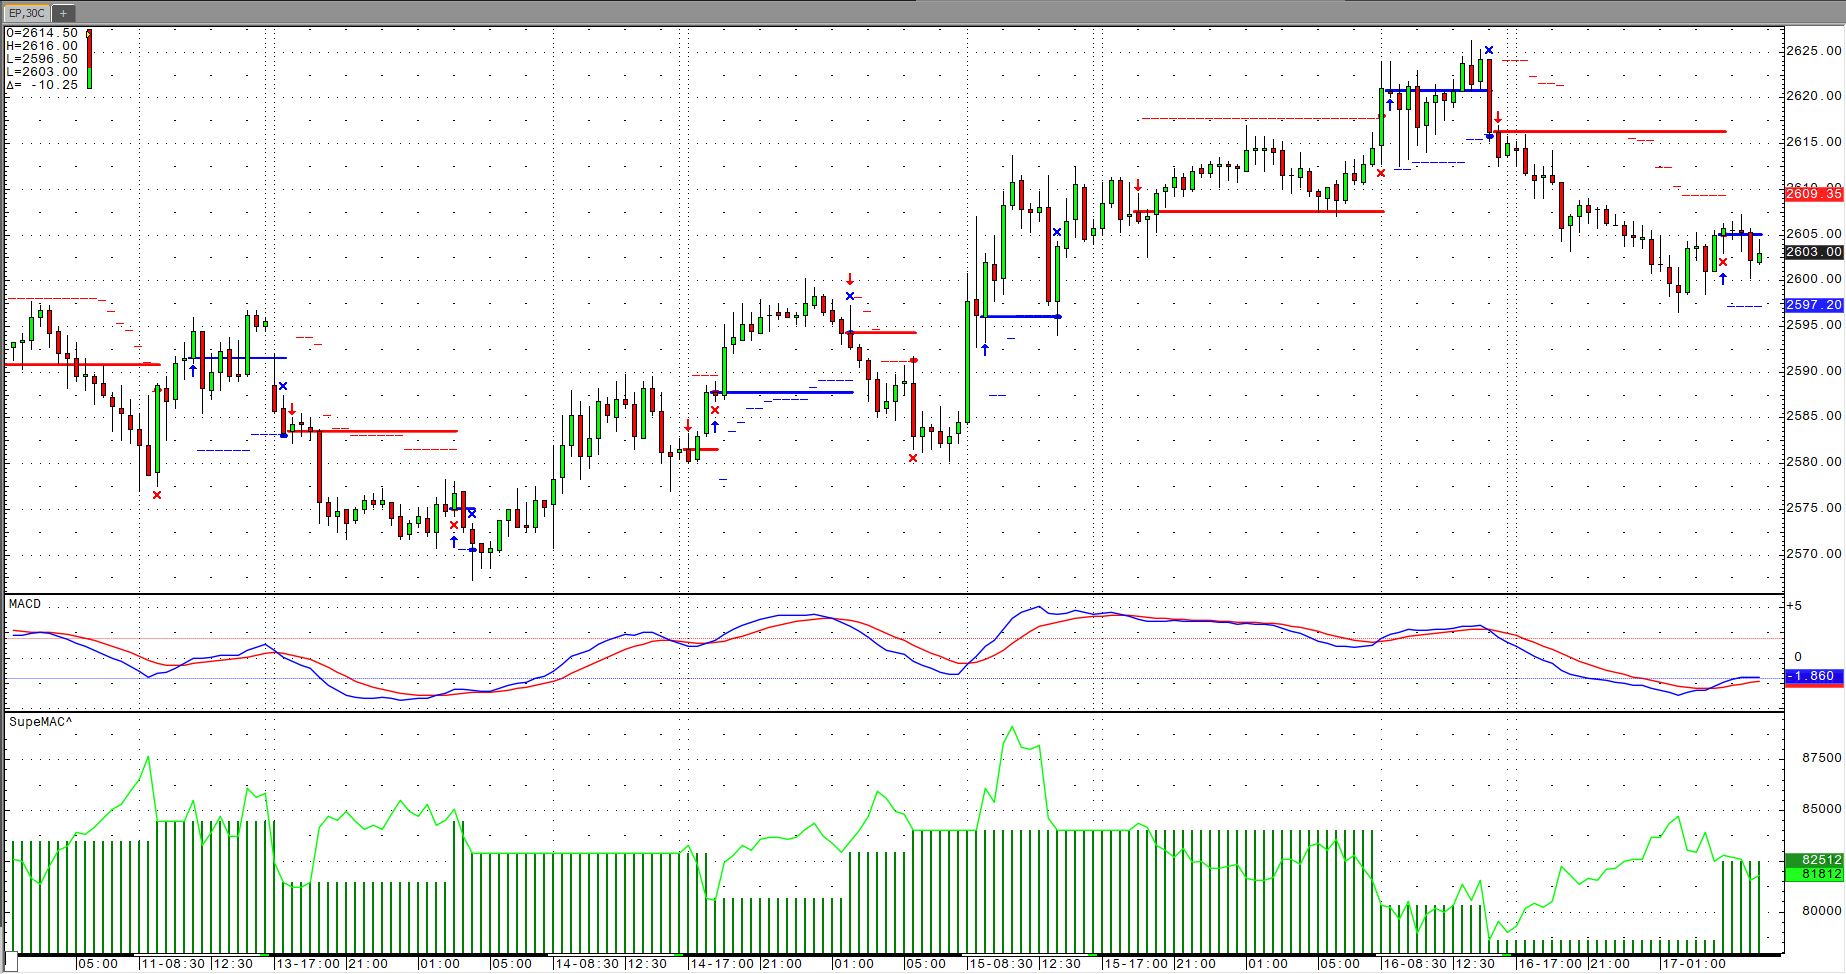
Super MACD Moving Average Convergence/Divergence (MACD)
The MACD is a specific type of OSCILLATOR study. It measures the difference between two exponential moving averages of different lengths, in addition, a trailing moving average of the MACD is plotted (MACDA), this is commonly referred to as the “Trigger” line. The two moving averages have different sensitivities to market action, thereby providing an indication of a change in the market environment, such as the emergence of a new trend or a trend reversal. Gerald Appel defined the MACD with its default parameter values.
Calculation
MACD = Exponential MA1 - Exponential MA2
MACDA = Exponential MA of MACD
Characteristics & Usage
The MACD is a simple and effective trend following tool, with the CQG defaults the most common variables used in the market.
When the MACD crosses 0, it indicates the shorter, more sensitive, moving average is crossing over the longer, slower, moving average.
Convergence of the two exponential averages, identified as the MACD moving toward 0, indicates trend termination or consolidation.
An expansion apart between the two exponential averages indicates the shorter/faster average is accelerating away from the longer/slower average. This is associated with a strengthening trend.
The MACD is an unbounded study enabling it to follow the market as long as the trend is gaining momentum.
The MACD generates two types of trading signals:
- A cross above zero generates a buy signal, while a cross below zero is a sell signal.
- A cross of the MACD and the MACDA may be used to generate buy and sell signals, as well. This technique can effectively identify the resumption of a trend when the MACD does not cross 0. The distance between the MACD and the MACDA is the basis of the Oscillator Less MA of Oscillator study.
The unbounded nature of the MACD study makes defining specific OB/OS levels difficult. Given this characteristic an MACD should not be traded against simply because it is OB or OS rather one should wait to see deterioration in its behavior. This may be done by paying greater attention to the MACDA. This allows for the study to be used as a divergence based indicator. Due to the fact that it is unbounded in value, it does not have so many problems associated in the Stochastic and the RSI. Namely, placing linear calculations on non-linear data. Studies such as MACD Divergence, which is linked to MACD Steps, can provide further definition in identifying true divergence. The chart shows three arrows on one sell signal which indicates divergence appearing when calculated through the high, low, and close. The single black arrow highlights the powerful and unique signal of divergence as a continuation of an existing trend.

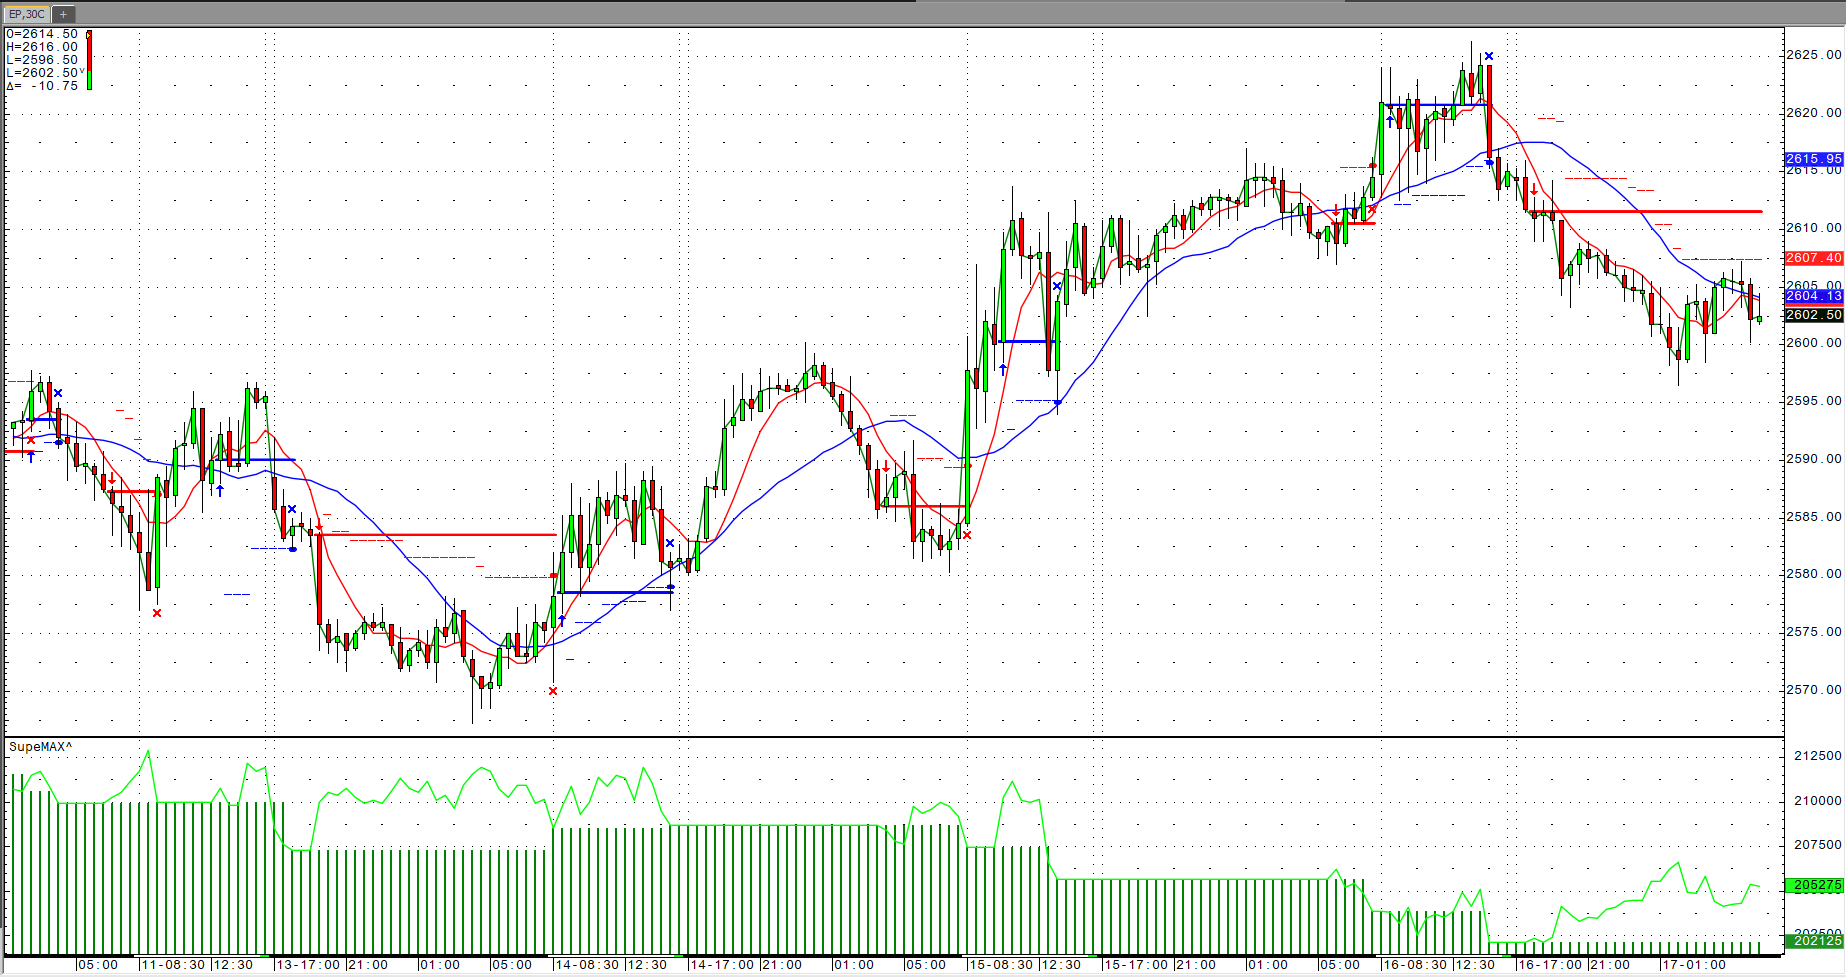
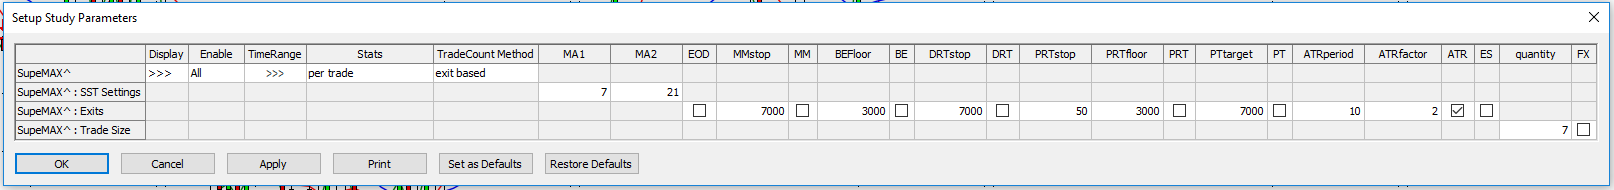
Super MAX Moving Average (MA)
The Moving Average (MA) study plots the average price over a user-specified period. Five methods of calculating the Moving Average are available in CQG: Simple, Smoothed, Centered, Weighted, and Exponential.
CQG also provides the ability to add envelopes to a MA. These lines are added to a MA when a figure is entered under percent. The envelopes are equal to the MA times 1 plus the percent and 1 minus the percent.
Moving averages are one of the most common forms of technical analysis because they tend to be effective tools for identifying the trend of a market.
Many trading strategies use the MA as a filter and only go long when the MA is rising or the price is above the MA and go short only when the MA is falling or the price is below it.
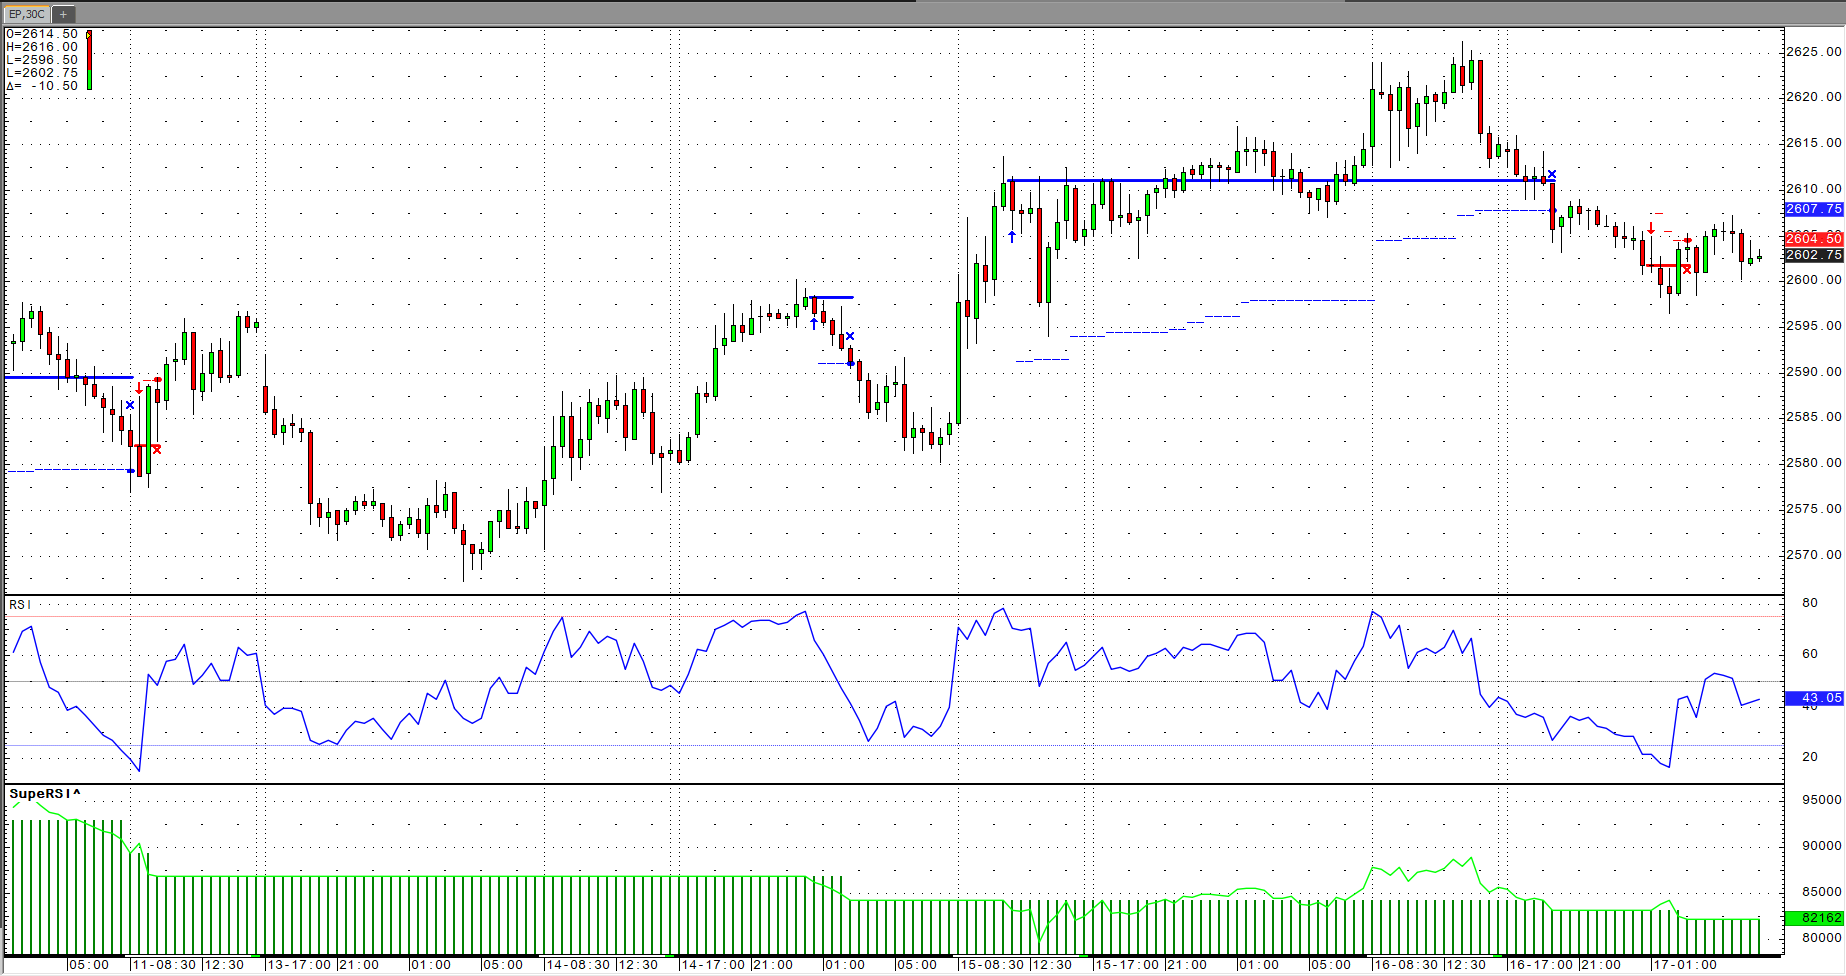
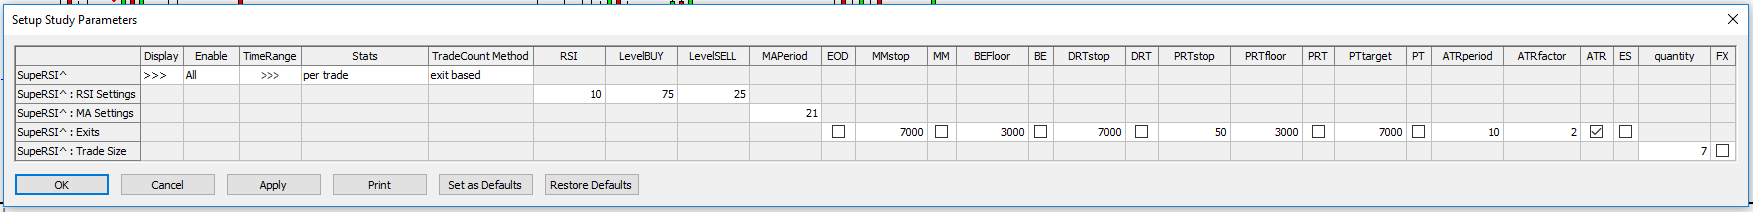
Super RSI Relative Strength Index (RSI)
Relative Strength Index is a price momentum indicator. Mathematically, RSI is represented as:
RSI = 100 - [100/(1+RS)]
where, RS is the ratio of the smoothed moving average of n-period gains divided by the absolute value (that is, ignoring sign) of the smoothed moving average of n-period losses.
RSI quantifies price momentum. It depends solely on the changes in closing prices. Despite its name, it has nothing in common with the traditional relative strength concept, whereby the price of a stock is divided by a broad market index (such as Standard & Poor's 500 Index) to arrive at a ratio that shows the trend of a stock’s performance relative to the general market. Instead, the RSI is actually a front-weighted price velocity ratio for only one item (a stock futures contract, or an index).
RSI is said to indicate an "overbought" condition when it is above 70 (CQG's default set at 75.00) and an "oversold" condition below 30 (default set at 25.00). The center line default is 50.00.
This can be a problem with explosive trends as the RSI above 90 or below 10 shows powerful momentum and an imminent crescendo type top or bottom.
Also, RSI momentum divergences are said to be frequently accurate for indicating that a market turning point is imminent, if quantified correctly. Shaun Downey’s book Trading Time looks at this problem in detail.
The trading system buys when the RSI crosses above a certain level (default 25) or sells when the RSI crosses below a certain level (default 75)
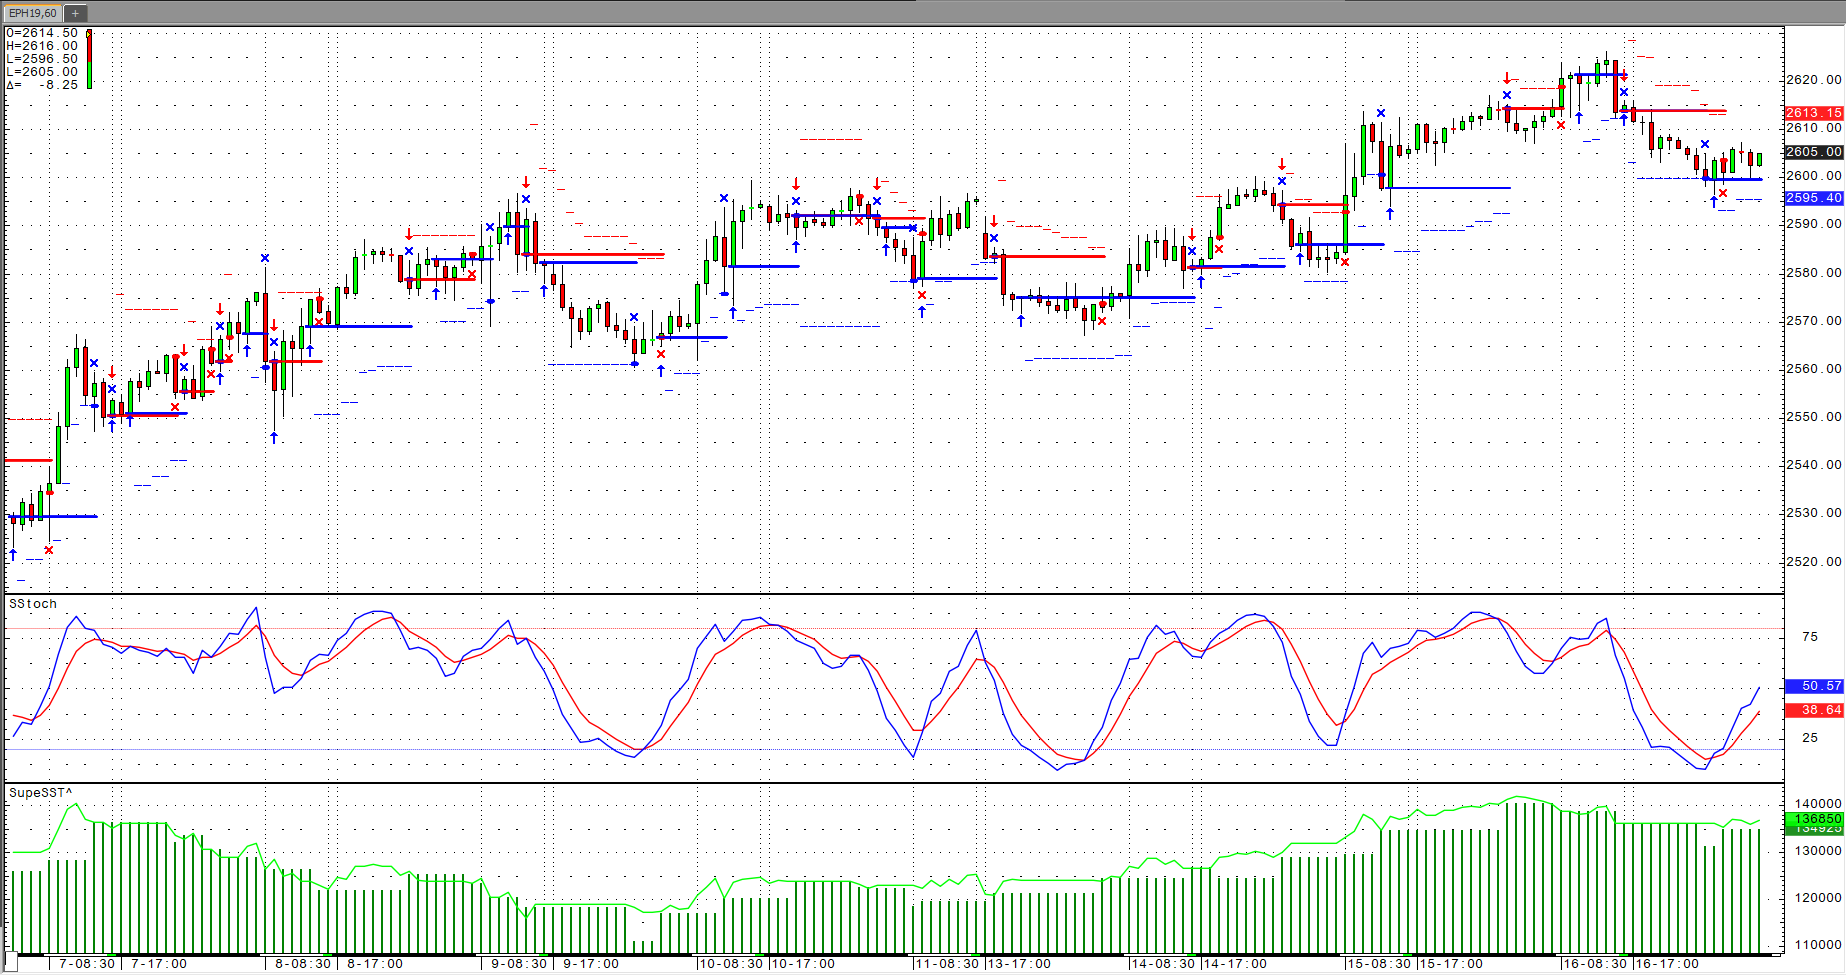
Super SST Slow Stochastics (SStoch)
When Slow Stochastic is selected, the system internally calculates the Fast Stochastic, however, only the Slow %K and Slow %D lines are displayed on the screen.
Slow %K - Is equal to the Fast %D.
Slow %D - Is a Moving Average of Slow %K values. The default for Slow %D is a Smoothed 3 Period Moving Average.
Users can choose between the Original and the Simple Algorithms. Generally, the simplified will be more responsive to price changes. The formulas for each are:
Original
K:= (MA(Close(@)- LoLevel(@,10),Smo,3)/MA(HiLevel(@,10)-LoLevel(@,10),Smo,3))*100;
D:= MA((MA(Close(@)- LoLevel(@,10),Smo,3)/MA(HiLevel(@,10)-LoLevel(@,10),Smo,3)),Smo,3)*100;
Of course, these six systems are not ready to use solutions; they are just samples to help you build your own trading systems for similar scenarios. The settings and the money management might vary a lot between different markets and the risk reward goals of any individual trader.