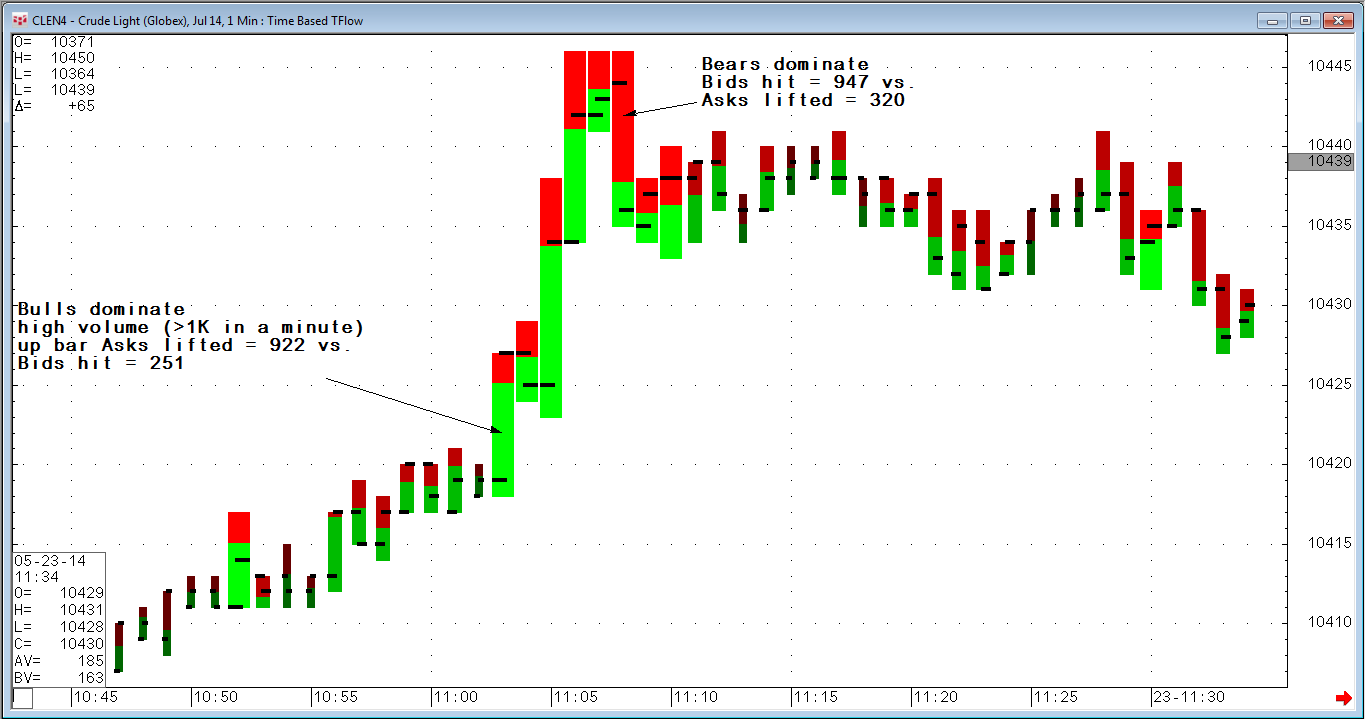
Many speculative traders are attracted to short-term or intraday trading for a wide array of reasons. These reasons include the fact that trades executed are typically lower risk as well as superior winning percentages when compared to trades with longer hold times. One of the most interesting short-term trading tools I have worked with is CQG's Time-Based TFlow®. Time-Based TFlow gives an objective answer for the short-term trader to the question, "Who's in charge, the bulls or bears?" It accomplishes this by not only displaying the volume of the one-, two-, three- or five-minute bar so that we can determine whether the price action occurred on a relatively high volume bar, but also by showing whether more market orders are lifting the offer - meaning the bulls are more aggressive, or if more bids are being hit, suggesting the bears are dominating the bar in question (see Figure 1).
So how do we turn the indicator of Time-Based TFlow into a rule-based trading methodology? Obviously there are many ways to accomplish this and I strongly advise readers to experiment with the indicator until they find something that fits their individual trading personality. This disclaimer aside, I have found the first things required to build something robust are to define the following:
- What assets will we be trading?
- What hours will we be trading?
- What time interval bars will we be using (e.g., one-minute bars, five-minute bars, etc.)?
- What will constitute a "high volume bar" for our charting time frame?
- What will constitute dominance of bulls or bears?
Here are some examples I have worked with to give you a frame of reference for doing further research:
- What assets will we be analyzing? - CME Group WTI Crude Oil futures, ICE Brent North Sea Crude Oil futures, and CME Group Henry Hub Natural Gas futures
- What hours will we be trading? 9 a.m. EST to 2:30 p.m. EST
- What time interval will we be trading? One-minute bars
- What will constitute a "high volume bar" for our charting time frame? Greater than 1,000 contracts in WTI, >750 in Brent, and >500 in Natural Gas
- What will constitute dominance of bulls or bears? Whenever the ratio of asks lifted vs. bids hit (or vice versa) is greater than 2:1
Based on these criteria, I now ask you to review Figure 1. Next let's create some simple rules of entry, risk management, and position management for the Time-Based TFlow indicator:
- Long Entry: After completion of bullish TFlow bar (as defined above)
- Long Exit: Bearish TFlow bar (stop and reverse), or stop at lowest low of the prior ten bars, or exit when close > upper Bollinger Band (twenty-period Simple Moving Average, upper band set to three standard deviations, and offset -1)
***NOTE: If no exit criteria occur within ten bars of entry, exit at market after the first profitable closing bar.
- Short Entry: After completion of Bearish TFlow bar (as defined above)
- Short Exit: Bullish TFlow bar (stop and reverse), or stop at highest high of the prior ten bars, or exit when close lower Bollinger Band (twenty-period Simple Moving Average, lower band set to three standard deviations, and offset -1)
***NOTE: If none of the exit criteria occurs within ten bars of entry, exit at market after the first profitable closing bar.
See Figure 2 below for an example of a long trade.
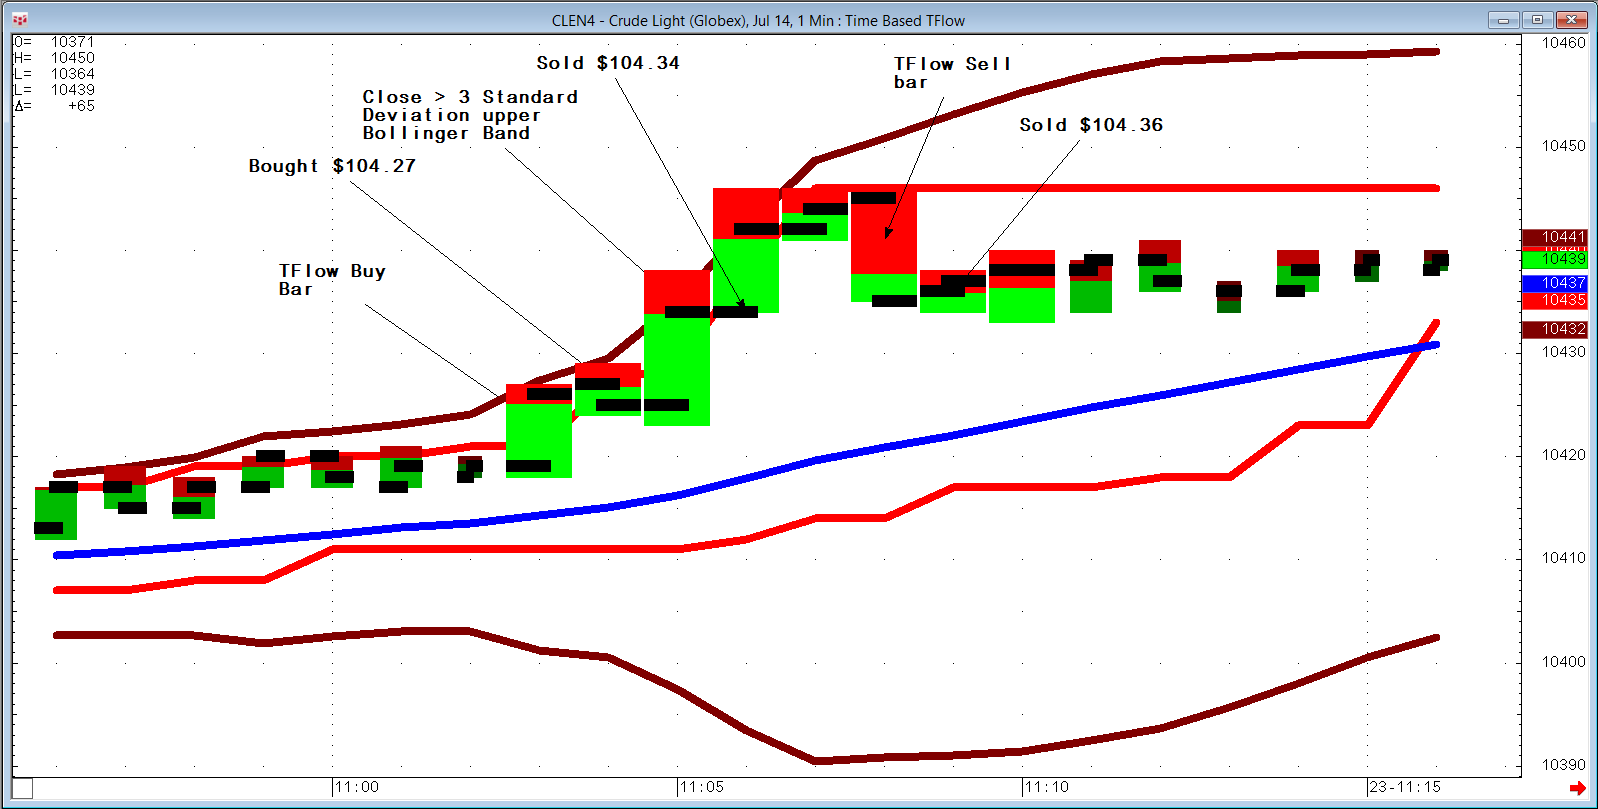
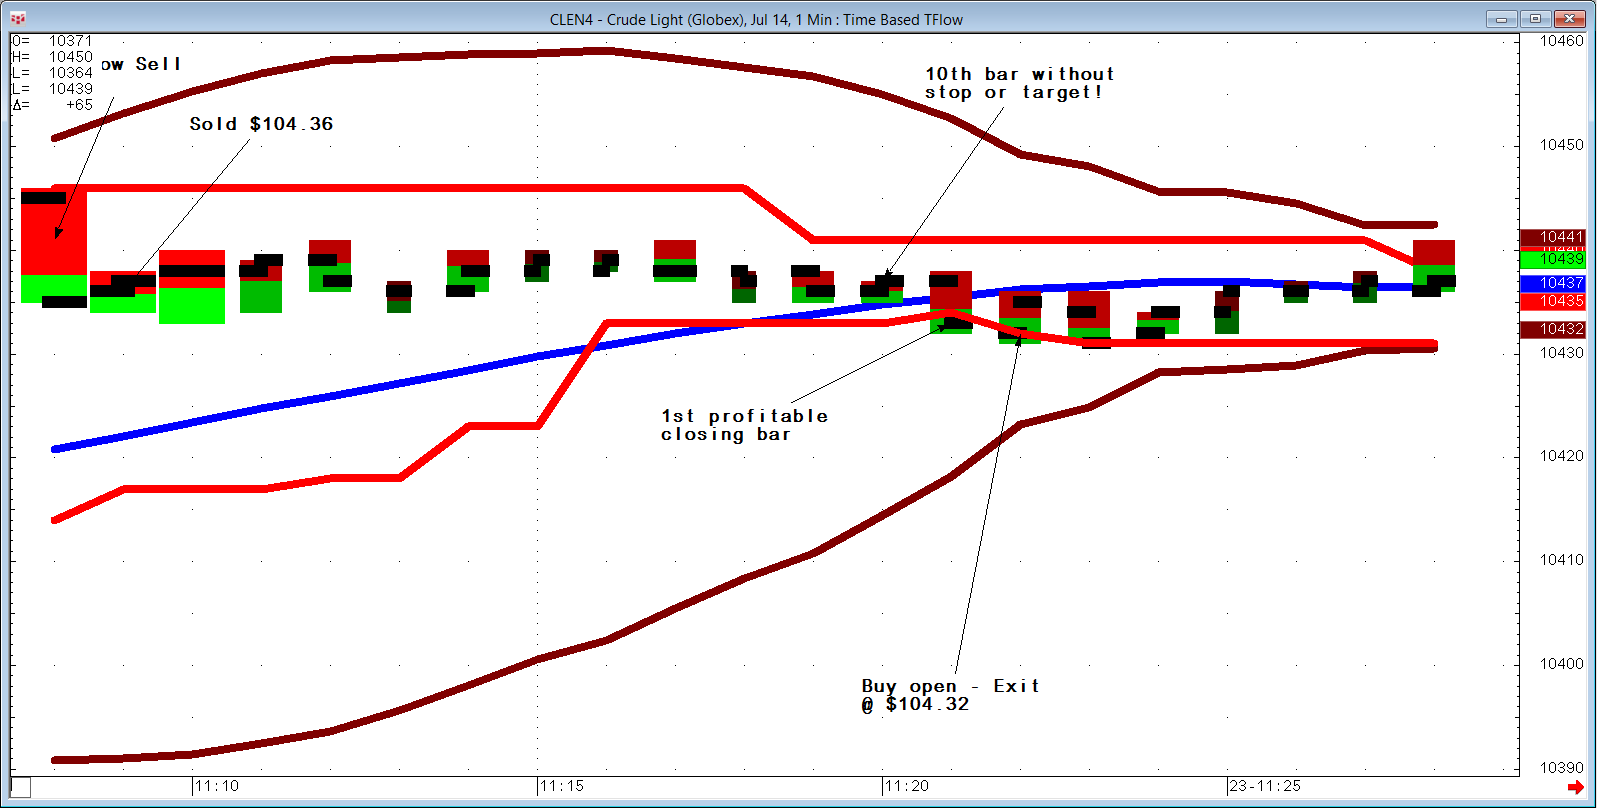
Figure 3 below is an example of a bearish TFlow trade where none of the exit criteria are met for ten bars and we exit at market after the first profitable closing bar.