This article will try to illuminate why most retail traders fail at speculative trading. I would argue that the simplest reason for failure is that they are fighting the path of least resistance. Looking at the chart below (Figure 1) of the spot US Dollar-Japanese Yen (USDJPY), at first glance it appears to have all sorts of reasons for selling the market short on October 30, 2014. These reasons include an overbought Relative Strength Index (RSI) reading of 68.44, failure to breach the upper Bollinger Band, as well as the approach of a theoretically low-risk shorting area: the recent resistance level of 110.09.
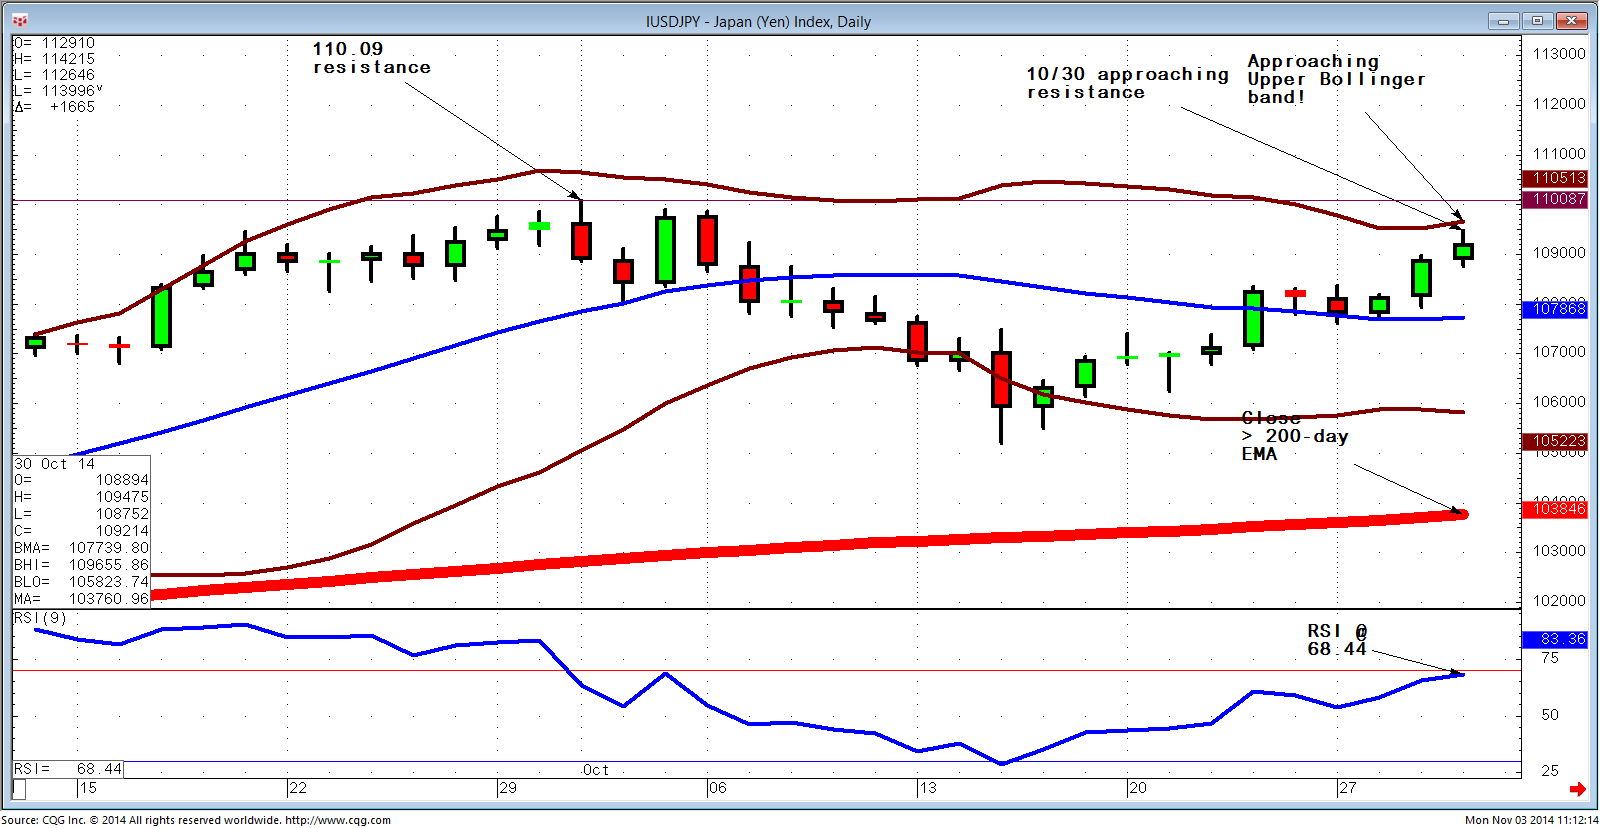
Unfortunately all of these reasons are short-term phenomena, which run counter to the most important, big picture fact displayed on the chart, namely that the path of least resistance as defined by the 200-day Exponential Moving Average (EMA) is up. Now look at the chart below, which includes trading through November 3, 2014 (Figure 2). Notice that in this second chart, issues such as historical resistance levels, an overbought reading in RSI, and the upper Bollinger Band level are all rendered immaterial and the only valid technical indicator remains the market's ability to close above its 200-day EMA.
Human nature tells us to buy low and sell high. Consequently we tend to look for reasons to fight the path of least resistance. Even more dangerous is the fact that the market will often reward this kind of logical behavior. But remember, the "easier money" in this difficult business of professional speculation is following the path of least resistance until that path has changed. How do we know the path has changed? One way is breaking the 200-day EMA on a monthly closing basis. Will this tool always keep us on the right side of the path of least resistance? Of course not, but it should keep us on the right side the majority of the time.
