Soybean and corn prices have certainly turned around over the past few years. After reaching highs during the aftermath of the 2012 drought, prices have gone south. In 2012, corn traded to highs of almost $8.50 per bushel while soybeans reached highs of $17.9475 that same year. For almost two and one-half years, these grain prices have moved lower.
2014 and Q1 2015 Were Ugly for Grain Producers
In 2014, soybean prices slipped by 20.94% and they were down another 4.51% during the first quarter of 2015. Corn dropped 6.26% during 2014 and another 5.23% during Q1. It has been a rough time for farmers who grow these grains, as well as for any bulls who bet on higher prices. As we enter planting season in 2015, some farmers are deciding which crop to plant in light of these depressed markets -- corn or soybeans. With corn below $4 and soybeans under $10 per bushel, the choice is not so simple. However, there are two reasons why I think farmers are likely to opt for planting more corn rather than soybeans this year, which may give traders an opportunity to profit.
Reason One: Term Structure
Term structure is simply the price difference between months within the same commodity. Term structure indicates whether a market is in oversupply, equilibrium, or deficit. A condition of contango, where deferred prices are higher than nearby prices, is often a clue that there is a surplus in a market. However, when deferred prices are higher than nearby prices, producers get to sell their intended crops in the future at higher prices than present or nearby prices. This is the current situation in the corn market.

Notice that nearby May futures contracts are trading at the $3.8675 per bushel level, while December corn futures are at $4.11. There is a contango in the corn market, and the new-crop corn trades at a 24 1/4 cent premium to nearby corn.
A condition of backwardation, where deferred prices are lower than nearby prices, is often a clue that there is tightness or a deficit in a market. However, when deferred prices are lower than nearby prices, producers must sell their intended crops in the future at lower prices than present or nearby prices. This is the current situation in the soybean market.
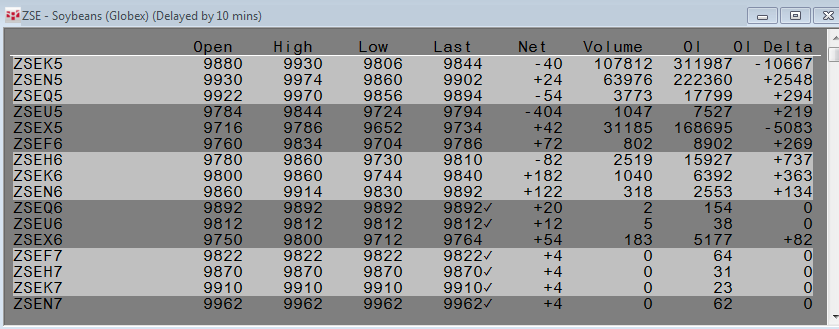
The nearby May soybean futures contract is trading at $9.845 per bushel while the November beans are only $9.735. There is a backwardation in the soybean market and the November new-crop soybeans trade at an 11-cent discount to nearby beans.
Term structure is telling producers that they will get a premium to current prices by planting corn, while they will have to sell at a discount if they decide to plant soybeans this year. Given the current state of low prices, even though there is plenty of corn around, farmers may plant more corn than soybeans because of term structure as well as one other important reason.
Reason Two: The Corn-Soybean Ratio
Often farmers have the choice of planting either corn or soybeans on their land. As a rule of thumb, they tend to plant the crop that provides the best economic result. One way they gauge this is by analyzing the corn-soybean ratio. Over the past thirty-five years, the average level for this relationship has been between 2.2-2.4:1. When the ratio is below 2.2, farmers tend to plant more corn than soybeans. When it is above 2.4, they plant more beans. As the long-term monthly chart illustrates, the ratio moves around a lot and last year when the ratio was 2.8:1, farmers planted more beans.
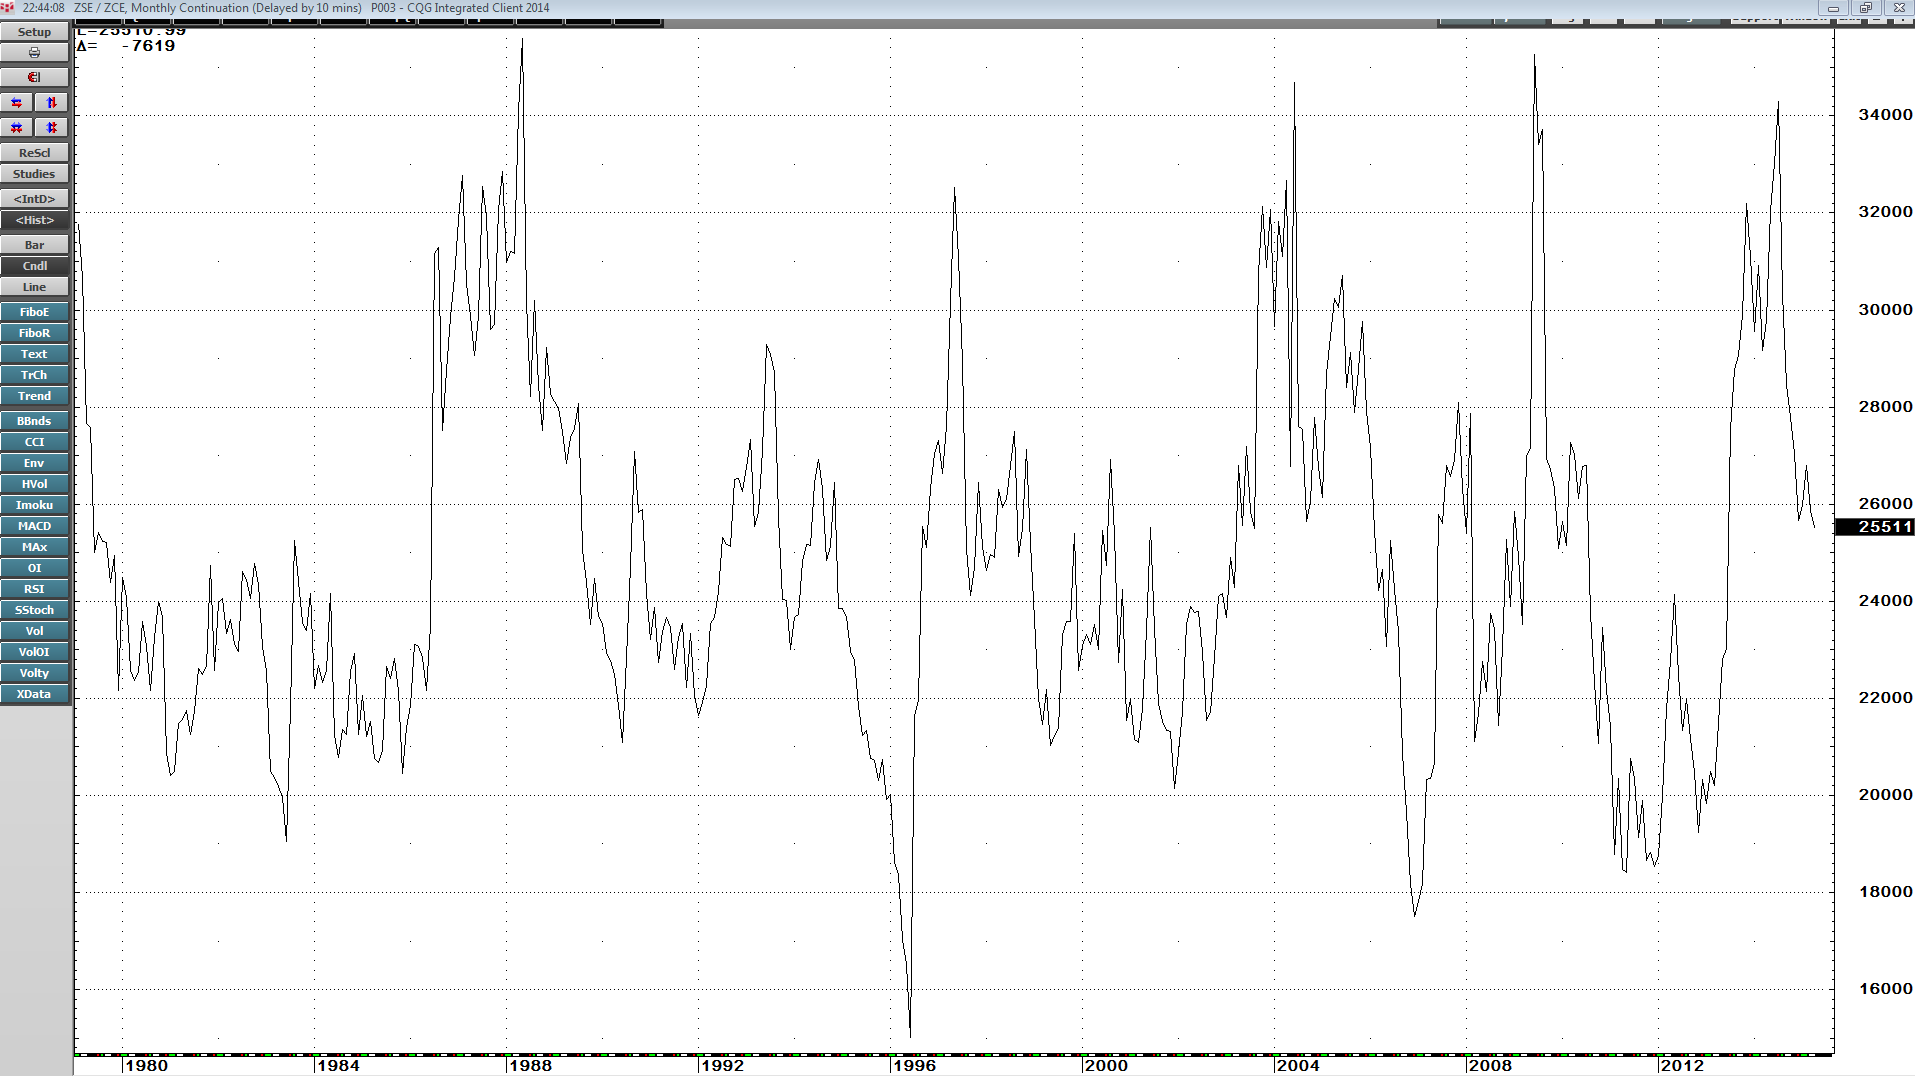
This year, as we enter planting season, the corn-soybean ratio has dropped back to the middle of the range.
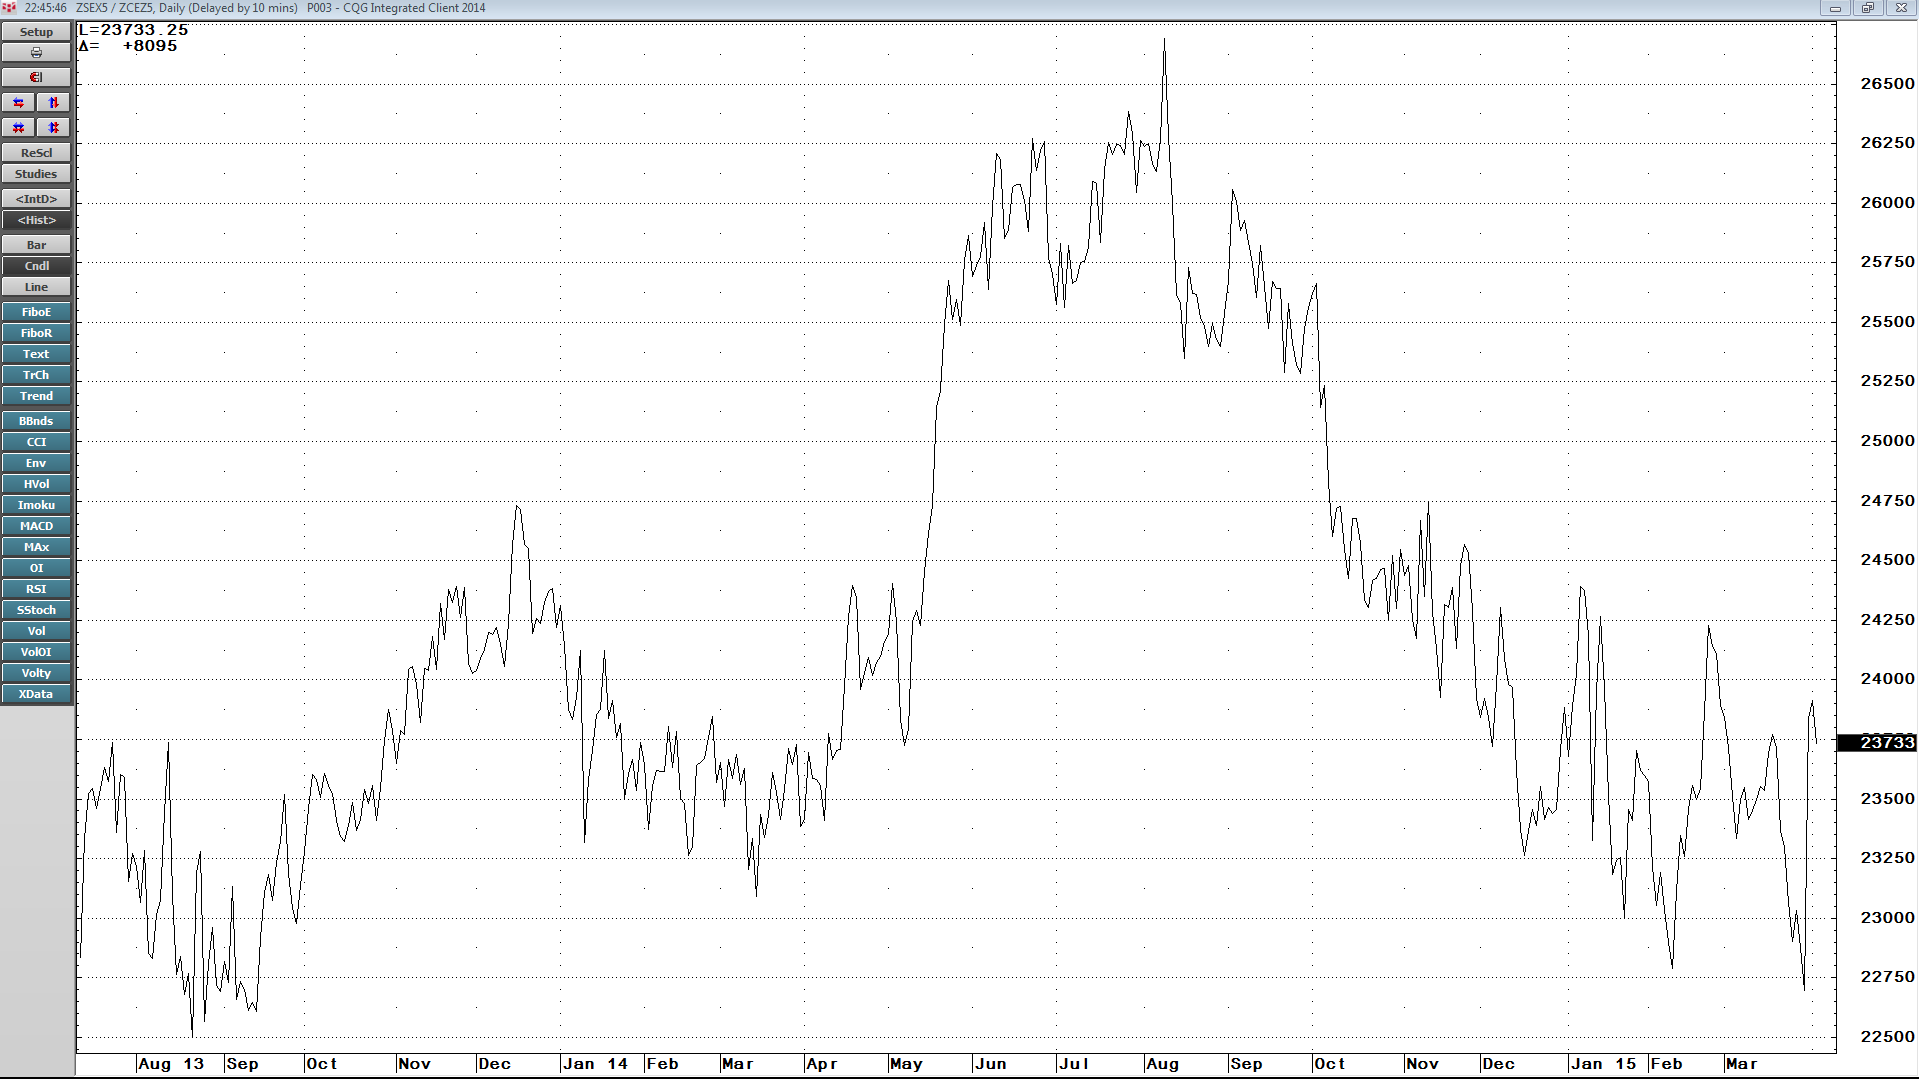
As the chart illustrates, the new-crop November soybean versus new-crop December corn ratio now stands at 2.37:1. Therefore, for two reasons -- term structure and the corn-soybean ratio, farmers may plant fewer soybeans this year than last year.
The Bottom Line
While grain prices continue to be depressed, no one knows what Mother Nature holds in store for crops this planting, growing, and harvesting season. However, with ample stocks of corn around, farmers are likely to plant more corn this year in lieu of soybeans. Term structure indicates tightness in the beans, and daily historical volatility at the 12.62% level in November beans, suggests that options are cheap.