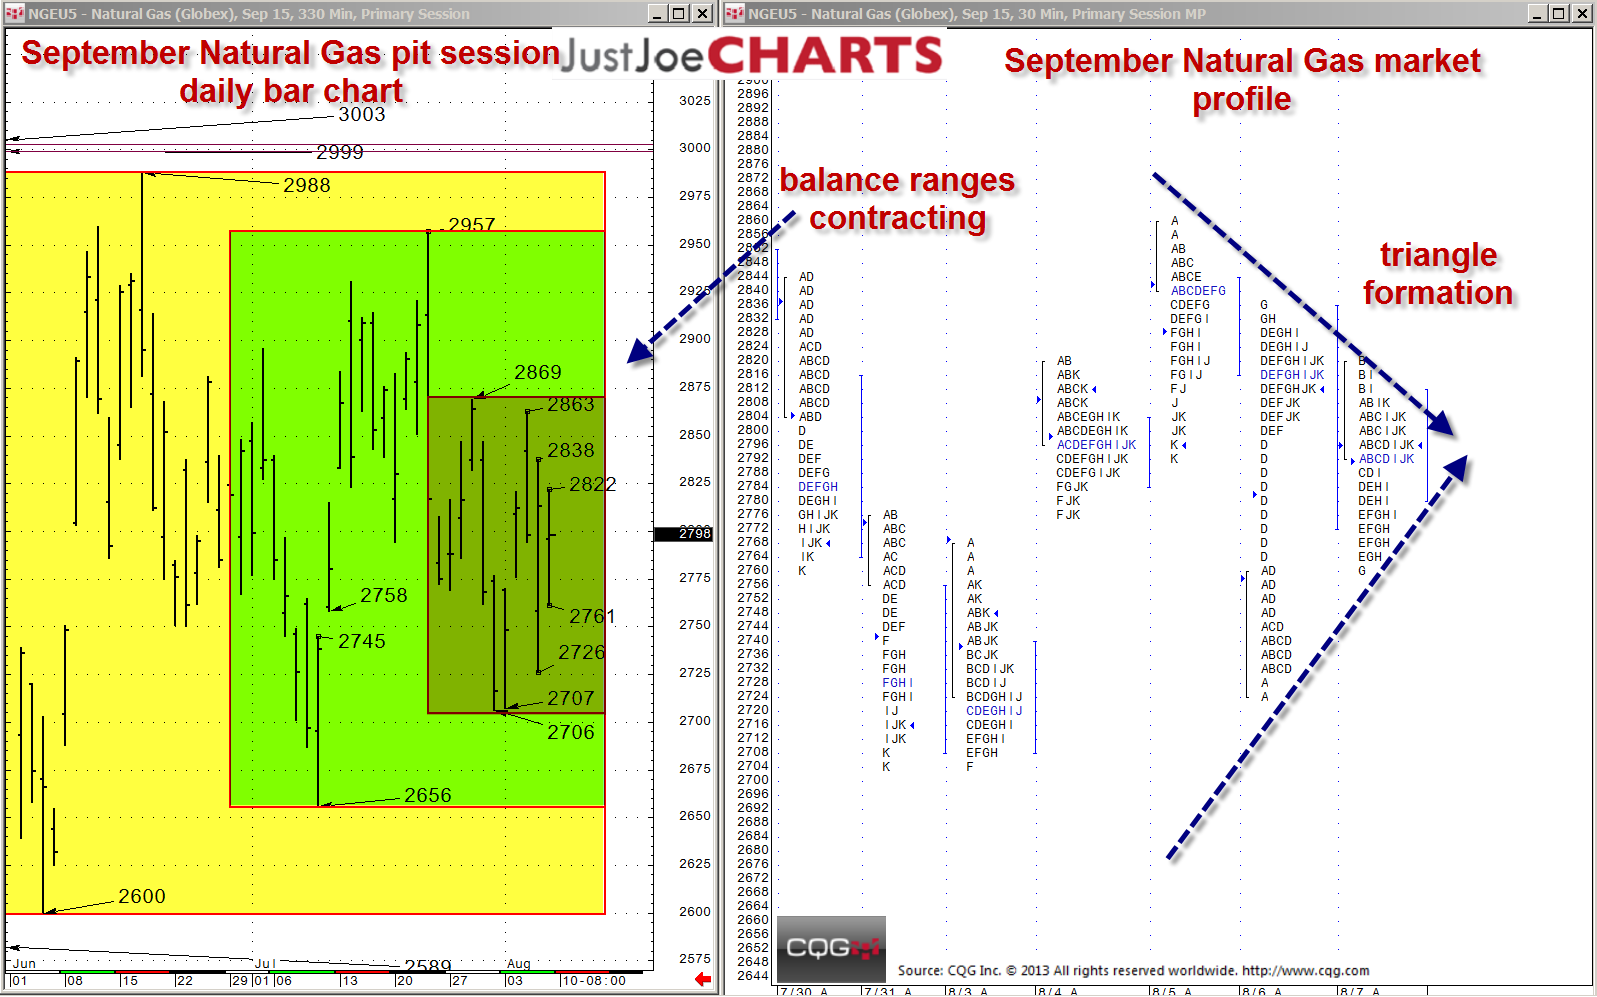
Over the last few months, September natural gas has been trading within a relatively wide 2600-to-2988 range. However, since late June 2015, the ranges in which the market has been rotating have been contracting. During the past twenty-five trading days, the balance range was 2656 to 2957. Additionally, the past eleven trading days had an even tighter range of 2706 to 2869. Also, the last five trading day ranges have been coiling into a triangle formation with Friday's settlement the apex. Friday's settlement is also the exact center of all three balance ranges. When the ranges in a volatile market such as natural gas continue to get pinched into a triangle formation, a significant move usually follows the breakout.
If the market breaks from the triangle formation, the first reference is the 2869-eleven-day balance high. With acceptance above 2869, 2957 becomes the next target. If the market breaks the triangle formation to the downside, 2706 is the first reference. With acceptance below 2706, 2656 becomes the next target followed by the 2600-two-month balance low.