The dollar index exploded higher by 7.23% in Q4 2016, but most raw material prices ignored the greenback. The principal raw materials traded on US and UK futures exchanges rose by 3.75% in Q4. The dollar was up by 3.59% in 2016 and commodities moved 13.41% higher. Many raw materials made multiyear lows in late 2015 and early 2016, but have recovered in dramatic fashion. Interest-rate-sensitive commodities suffered losses, but industrial commodities added to gains over the past three months.
A Winning Quarter
Four of the six sectors posted gains while the other two were losers. Animal proteins led commodities with a 19.44% increase in Q4 after cattle and hogs fell to the lowest prices since 2010 and 2002, respectively, in early October. Energy commodities posted a 14.67% increase after OPEC cut oil production in late November for the first time in nine years and a cold beginning to winter lifted natural gas prices. Grains recovered by 6.66% on the quarter as oats and the soybean complex led the sector higher. Base metals added to gains by 3.14% as copper played catch-up and led the industrial metal sector higher.
Precious metals were the ugliest sector that lost 11.92% as a strong dollar and higher rates weighed on gold, silver, platinum, and palladium and took some of the shine off the metals. Finally, soft commodities fell by 9.47% as four of the five tropical commodities moved lower.
Other notable commodities outside of the composite had a very good quarter. Iron ore continued to move higher, adding 50.65% to its price. While lumber moved 2.08% lower on higher interest rates, the Baltic Dry Shipping Index posted a 9.83% gain. The overall result for the commodities sector was positive with lots of winners.
The Winners
While iron ore was the big winner, first place among the winners of the US futures market-traded commodities went to lean hogs. The meat market that hit 2002 lows early in the quarter turned around and posted a 34.93% gain. Natural gas, which traded to the lowest price since 1998 in March of 2016, was up 28.84% in Q4. Energy was a big winner with Brent and NYMEX crude up 12.85% and 11.59%, respectively. Gasoline and heating oil posted gains of 14.41% and 12.43%. In the grain markets, oats led all other agricultural commodities with a 28.19% increase in price. In base metals, copper led the way with a 13.5% gain and zinc added another 8.232%. Zinc was up a whopping 59.53% in 2016.
The theme among the winners was that industrial commodities zoomed higher. The Presidential election resulted in a new optimism in many markets and the prospect of a giant infrastructure building project in the US lifted the prices of metals and minerals as well as energy.
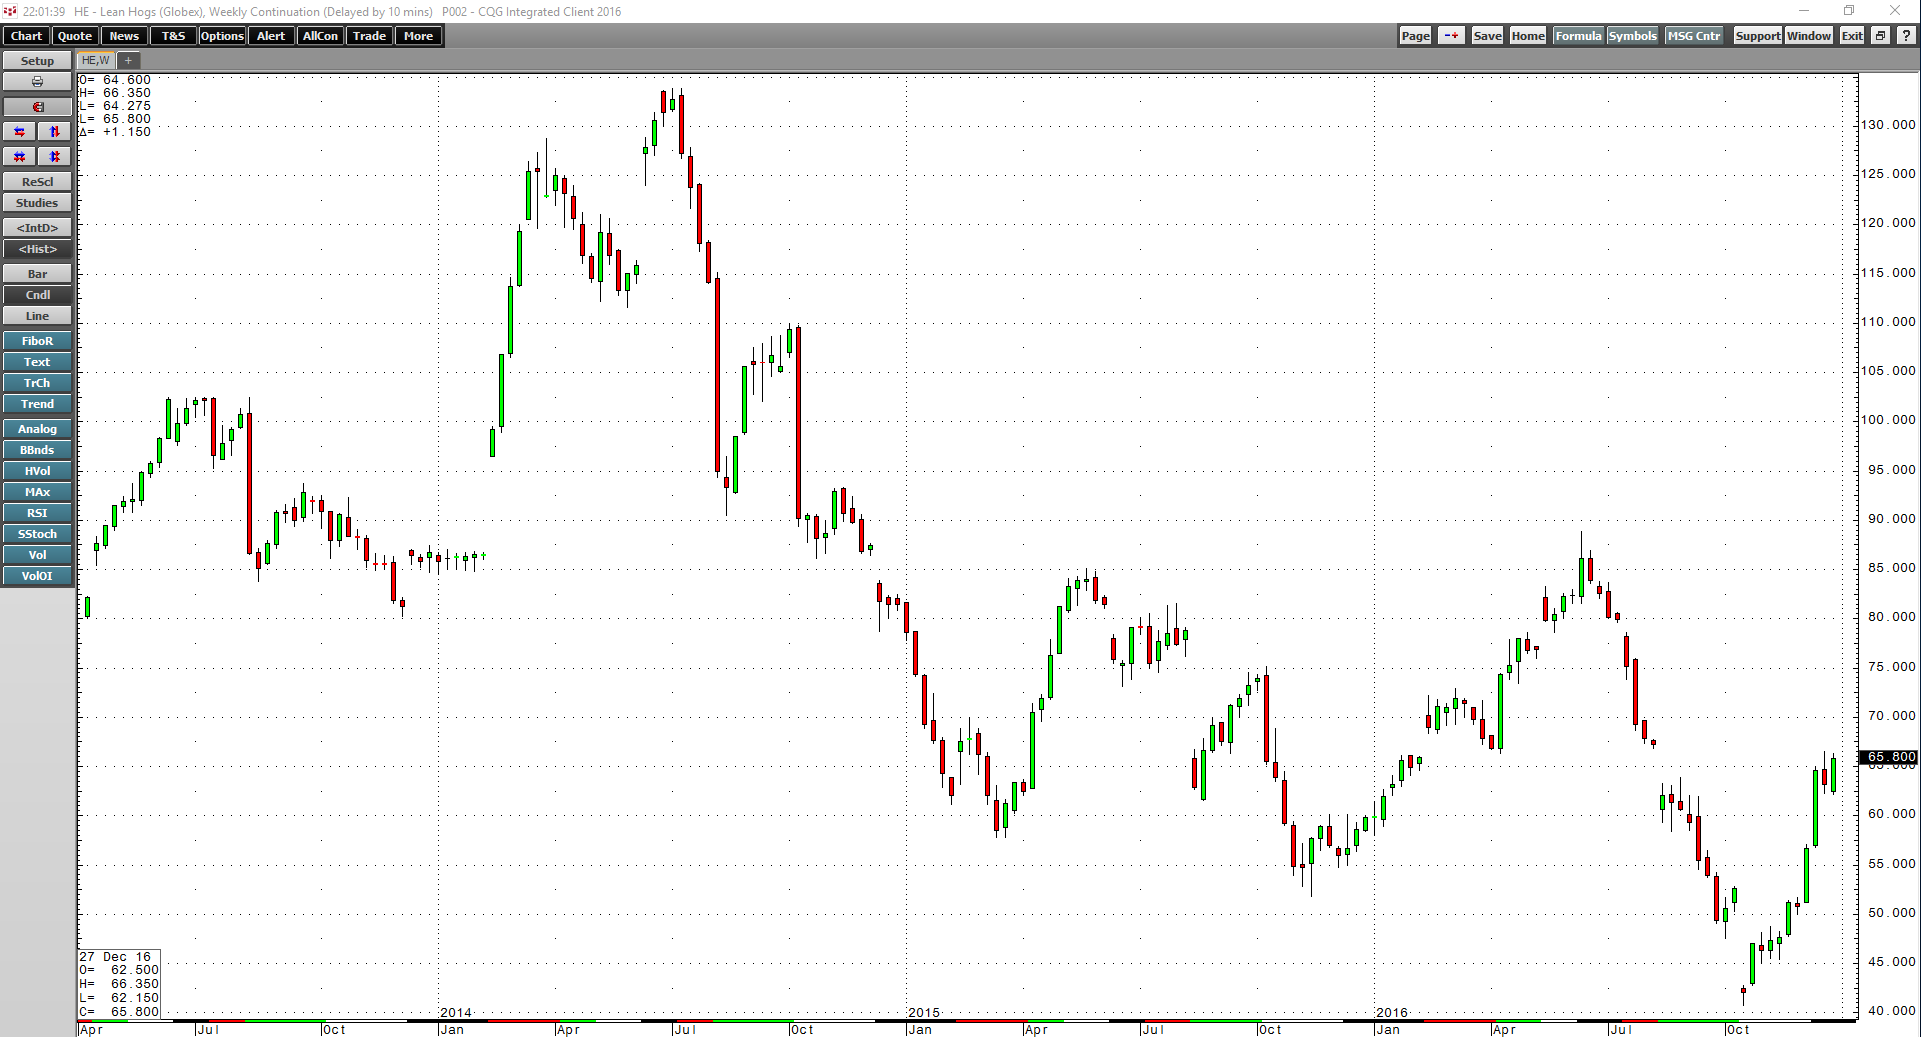
As the weekly chart illustrates, lean hogs was the overall leader in the commodity sector in Q4 with gains of over 32%. Hogs turned a losing year into a winning one, finishing 2016 with a 10.62% gain. Hogs were down 41.13% in Q3 - an example of a market with price volatility with a capital V.
The Losers
The worst performing commodity of Q4 was also the biggest loser in 2016. Cocoa had been in a demand-based bull market since 2011. However, a falling pound and increase supplies of cocoa beans from West Africa caused the price to tank in the aftermath of the Brexit referendum.
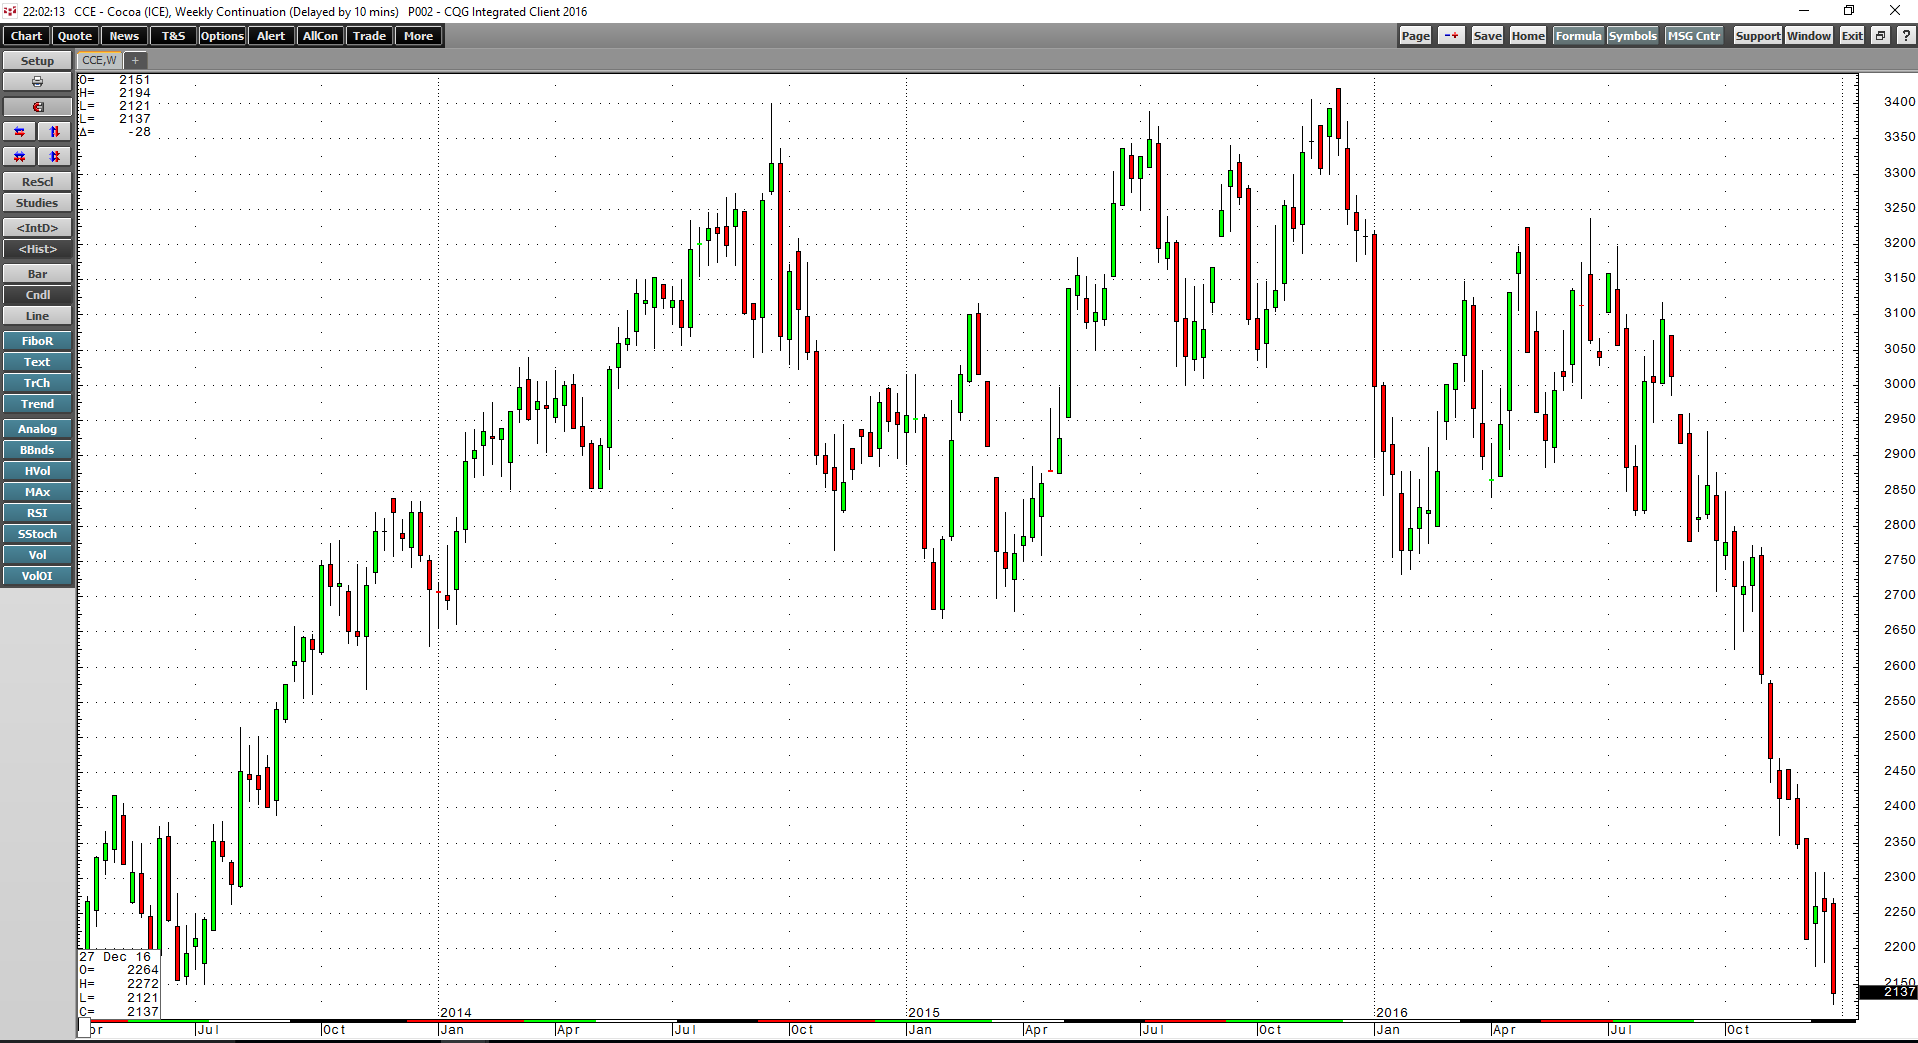
As the weekly chart of ICE cocoa futures illustrates, the primary ingredient in chocolate fell by 23% in Q4 and 33.79% in 2016. Cocoa continues to be a falling knife, closing on December 30 at the $2126 per ton level, just a few bucks off the lowest price since 2013.
Other big losers for Q4 were sugar and coffee futures, which dropped 15.17% and 9.57%, respectively. Rising interest rates and a bullish move in the dollar weighed heavily on precious metals as silver dropped 16.94%, gold was down 12.54%, and platinum shed 12.44% of its value. Palladium was the best performing precious metal as it only posted a loss of 5.78% for the three months that ended on December 30. For precious metals, it was all about the dollar.
2016 Ends with a Big Divergence
The dollar index took off to the upside after the Presidential election.
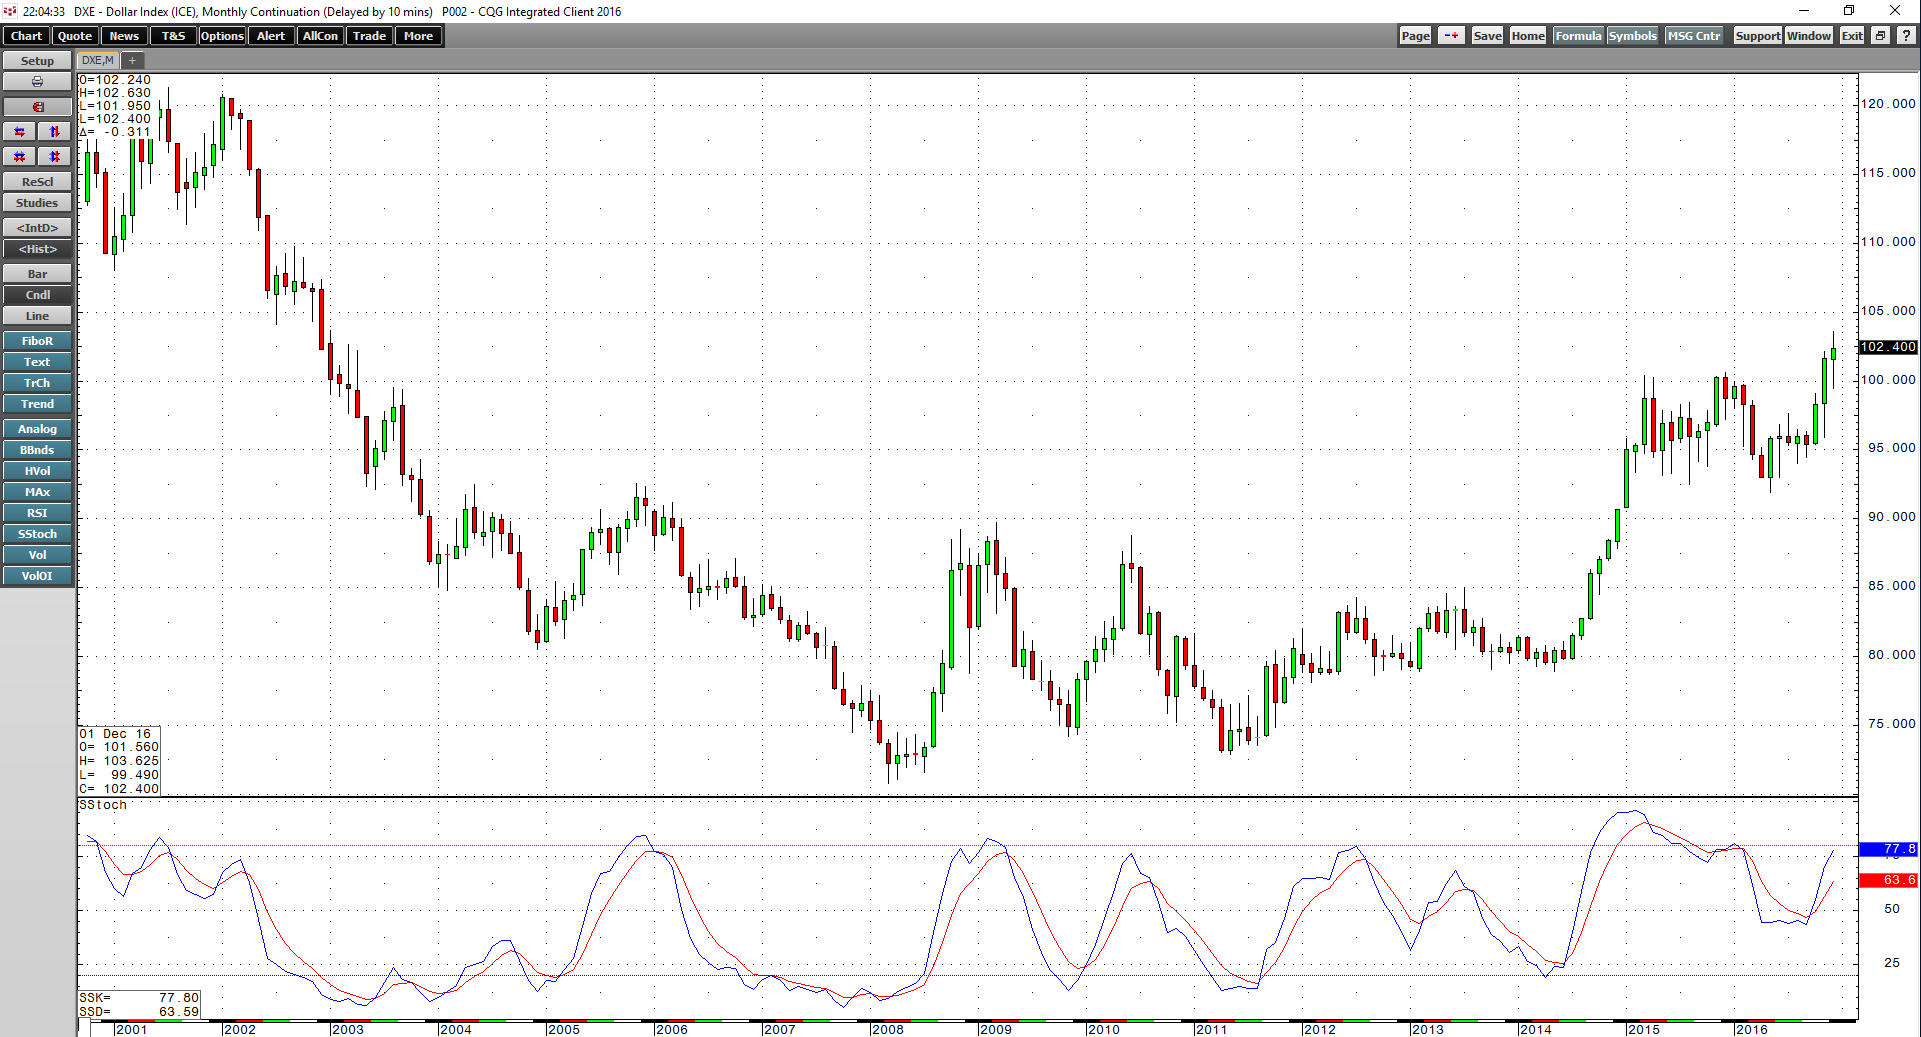
As the monthly chart of the dollar index shows, the dollar broke out from a 20-month consolidation pattern when it traded above 100.60 in November. The dollar reached highs of 103.625 and closed the year at 102.286, up 7.23% for the quarter and 3.59% in 2016.
While precious metals reacted to the dollar’s ascent, other commodities ignored the move in the greenback. With the commodities complex up 3.75% in Q4 and over 13.4% on a year-on-year basis, the move in the dollar presents the market with a divergence as we head into 2017. A strong dollar is traditionally bearish for raw material prices, but not in 2016.
Significant Events on the Horizon
We are heading into 2017 after a deviant move in the dollar and commodity prices. The prospects for fiscal stimulus in the form of an infrastructure building project in the US opens a new demand vertical for many industrial commodities. Meanwhile, the incoming US administration is likely to launch a new era for the energy industry in the nation as the regulatory environment eases and production costs decline for oil and gas output.
The first significant event of 2017 will be the symbolism of the inauguration on January 20 that will usher in a new political and economic era in the United States. Then, later in the year, Germany, France, and the Netherlands will go to the polls to elect leaders. If Brexit and the US election of 2016 are guides, Europe could be in for big changes, and the future of the European Union may hang on the election results. The dollar is likely to be volatile in 2017 and the trend in the greenback is higher as the next level of technical resistance in the greenback now stands at 109.75, the September 2002 highs.
Get ready for lots of volatility in markets across all asset classes in 2017, and commodities tend to be the most volatile assets of all. Commodities rallied in Q4 in the face of a rising dollar. While divergences tend to reverse and correct over time, the path of least resistance for volatility is likely to be higher.