After Election Day in November, it looked like the rallies in gold and silver that took place over the course of 2016 were over and done. Nearby gold futures fell to lows of $1,123.90 and silver reached a low of $15.70 per ounce in December. Both precious metals had traded to lows in December 2015, and then rallied sharply beginning in January 2016. In almost a carbon copy of the price action of last year, gold rallied by 5.3% in January 2017, the same percentage gain the yellow metal saw in January 2016. When it comes to silver, the precious metal posted an even bigger gain in January 2017 than it did during the first month of the year in 2016.
January Rallies
In 2016, gold opened on the first trading day of January at $1,061 and closed the month at $1,118, a gain of $57 per ounce. This January the price of the yellow metal opened trading at $1,151.40 and closed at $1,212.40, an increase of $61. While it was not a perfect match, it was about as close as you can get to one with the percentage gain during the first month of each year around the 5.3% level.
During the first month of 2017, silver moved from an opening price of $15.97 on the first trading day of the year to close on January 31 at $17.575, a gain of $1.605 per ounce or 10% over the course of the month. In January 2016, silver opened at $13.815 and closed the months at $14.255, an increase of 44 cents on the month and a gain of 3.2%. While gold’s move in January was almost a carbon copy of the price gain in 2016, silver had a better January compared to last year and was a leader when it comes to the two most popular precious metals.
In late January we witnessed some interesting and divergent moves in a significant technical metric when it comes to the two precious metals.
Clues from Open Interest
Silver outperformed gold during the first month of 2017 and open interest provided technical support for the trend of price appreciation.
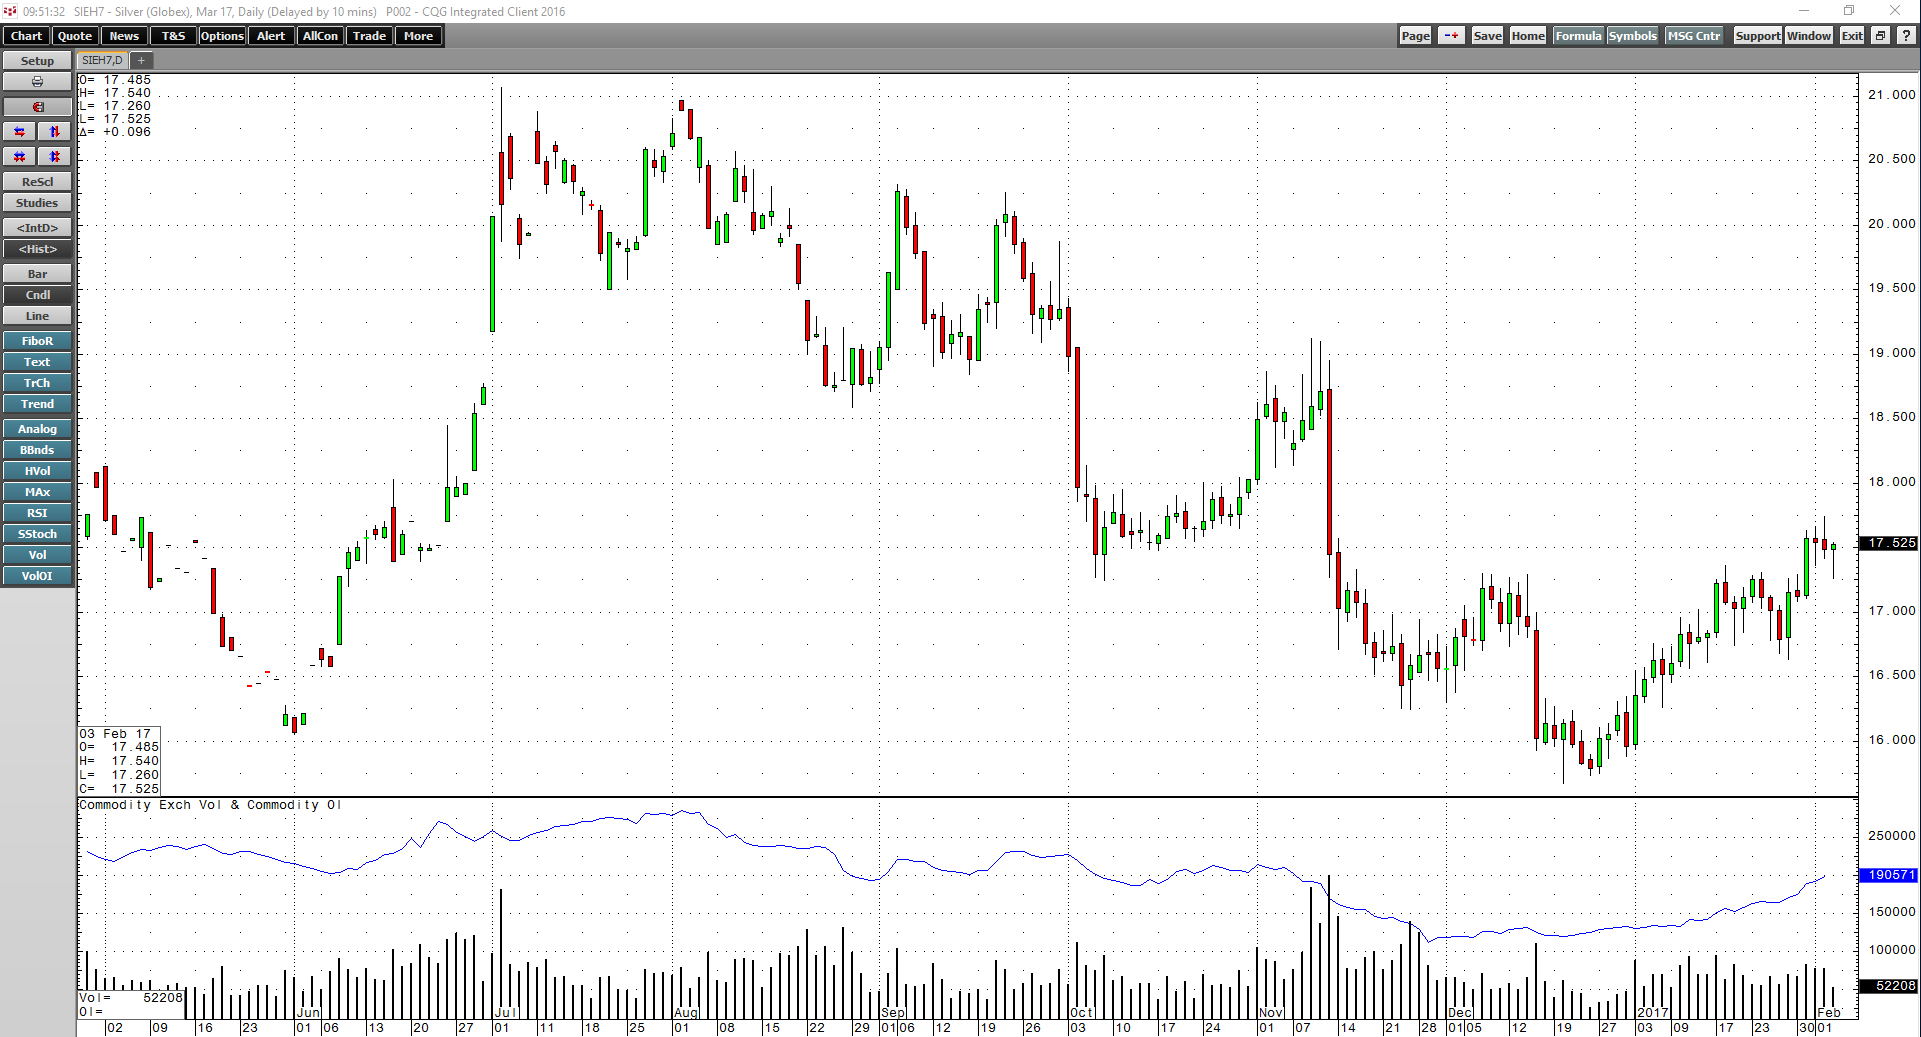
As the daily chart highlights, the total number of open long and short positions on COMEX silver futures increased from 163,912 contracts at the beginning of the year to 186,839 on January 31, a rise of 14%. Open interest rose steadily during the first month of the year. Increasing open interest alongside rising price tends to provide technical validation for an uptrend.
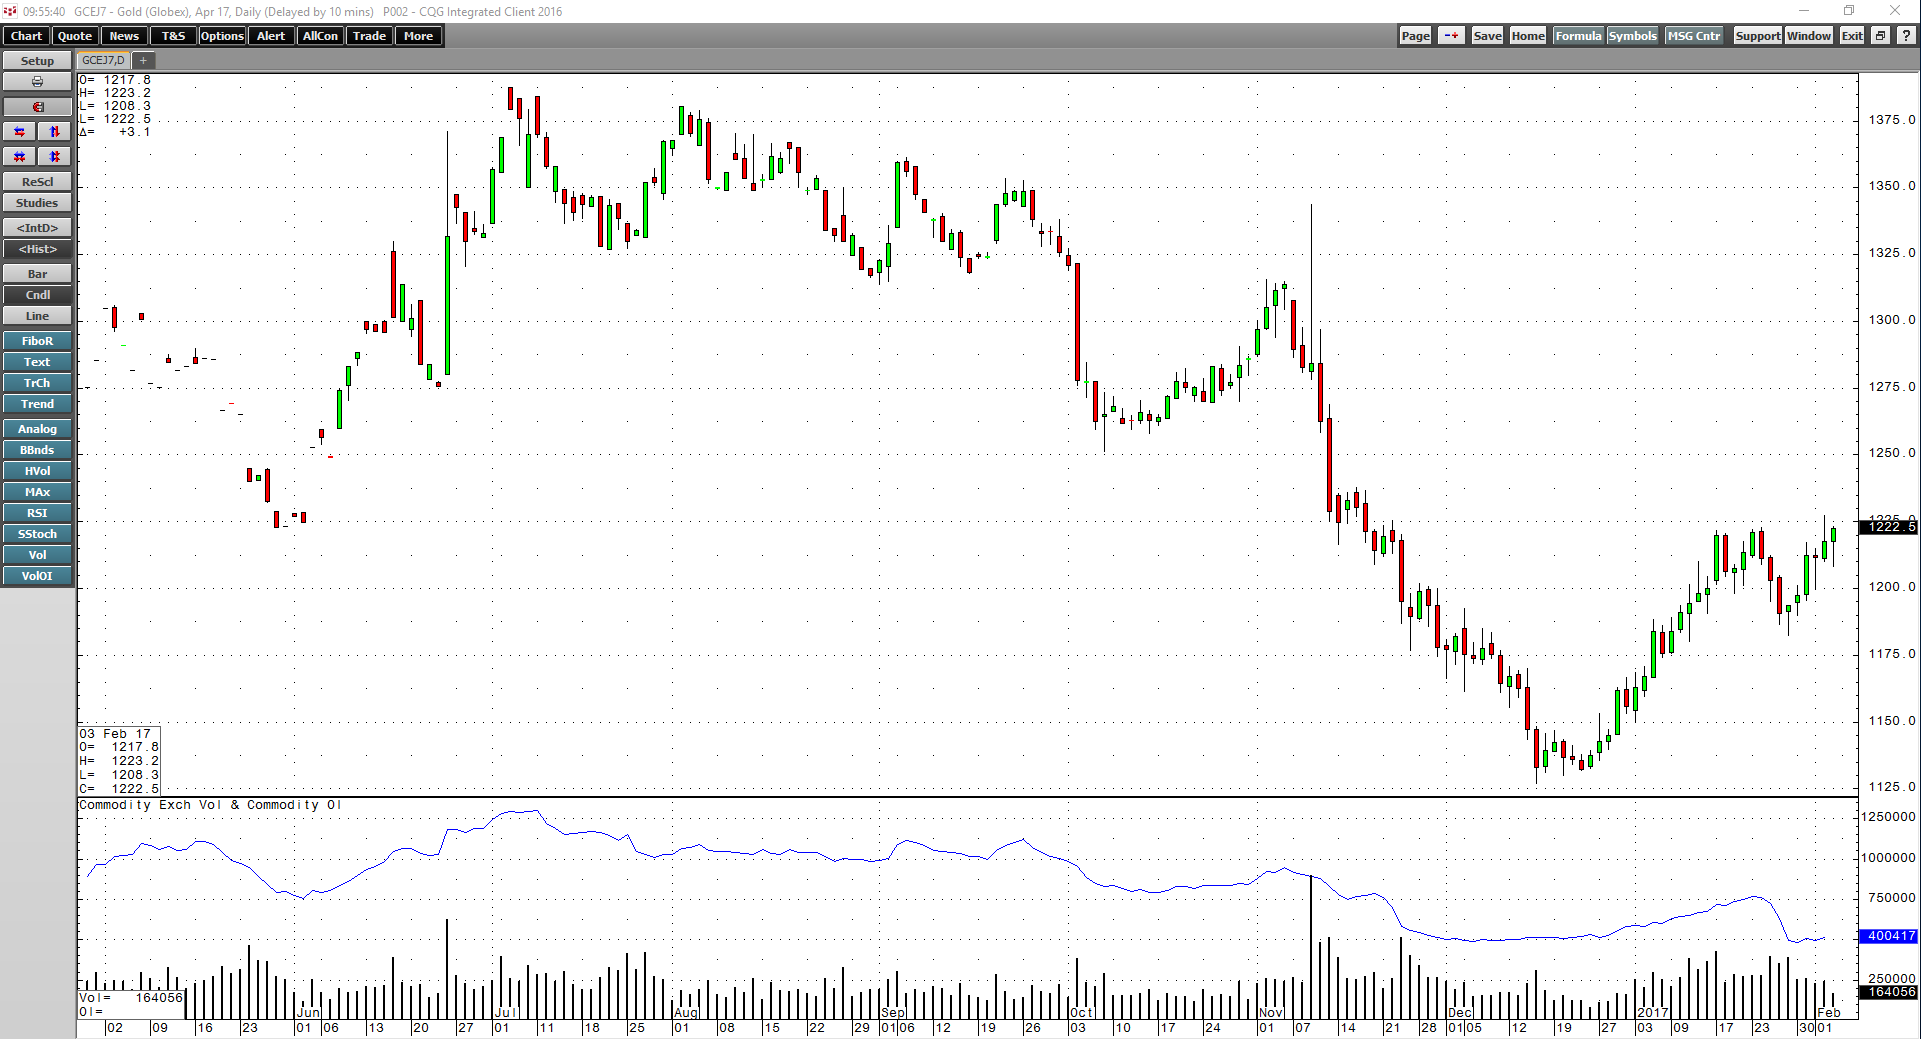
The daily gold pictorial shows a different story. Open interest was at 424,873 contracts at the start of the year. The metric then rose to a high of 483,408 by January 23 as the price moved higher. However, when gold corrected from $1,223 on January 24 to lows of $1,182.60 on January 27, open interest fell to 391,449 contracts, a decline of an incredible 19% in one week. The fall in the number of open positions came at a time when February futures were rolling to the April futures contract on COMEX. It seems that many longs exited the market rather than rolling to the next active month.
Silver Leads
The open interest data from January presents an interesting contrast between gold and silver. It tells us that the gold market cleaned out weak longs while those with long positions in silver were more resilient over the corrective period.
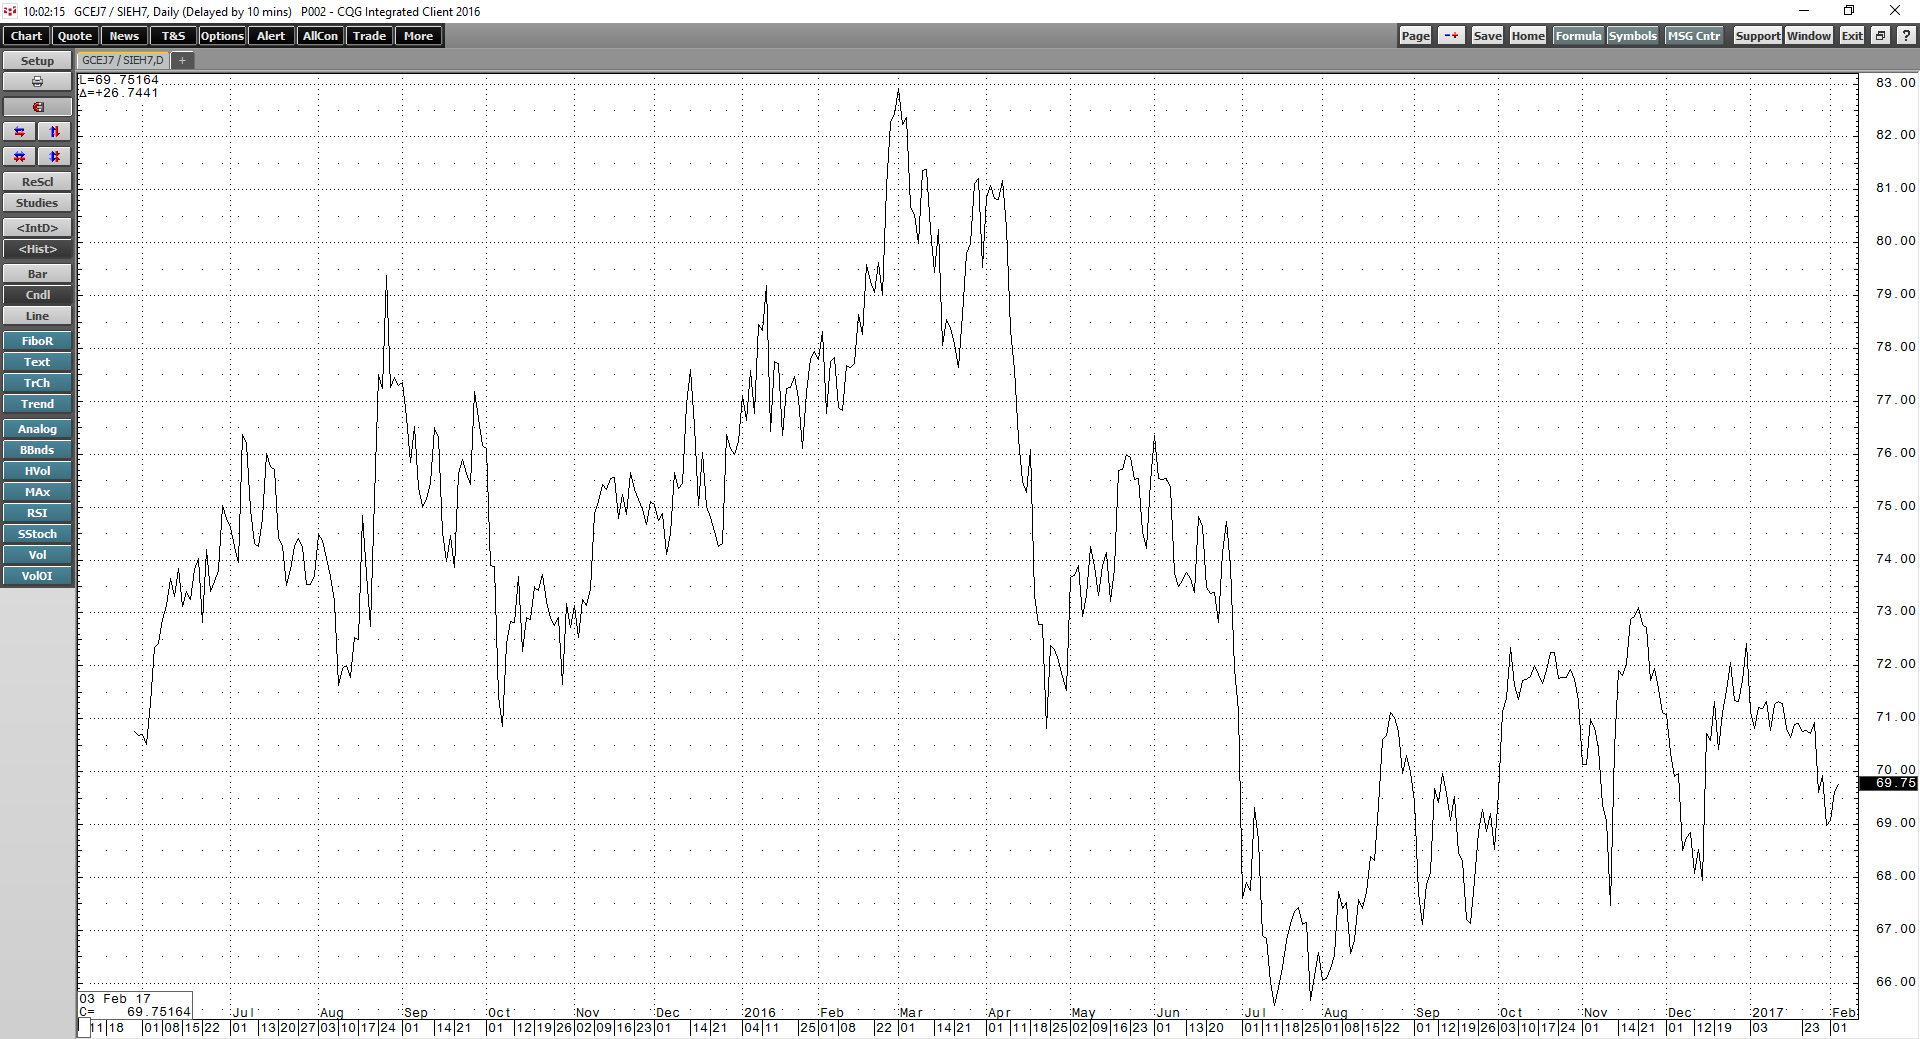
The daily chart of the silver-gold ratio illustrates that the value relationship between the two precious metals declined from over 71:1 at the start of the year to just under 69:1 on the final day of January. The long-term median for this ratio is around the 55:1 level. A move toward the mean tends to be bullish for precious metals. Therefore, silver’s outperformance when compared with gold in January is traditionally a positive sign for the overall trend of the precious metals.
February Will Be an Interesting Month - Watch the Dollar Index
In February 2016, gold posted a gain of almost 11% while silver rallied by 4.5% during the second month of last year. Precious metals have been following the same path so far this year as they did last with the upside trajectory of silver more powerful this year. For the trend to continue, we will need to see some powerful moves over the coming months, particularly in gold.
Meanwhile, gold has been trading in a strong inverse pattern to the US dollar.

The pictorial of the price of gold and the dollar index shows the almost picture-perfect inverse trading pattern. When the dollar rallied to the highest level since 2002 after the US election in November, gold corrected to the downside, and as the dollar came off those highs over recent weeks, the price of gold moved higher.
Gold is now approaching critical resistance at the $1,240 per ounce level as the dollar approaches support after its corrective move. February is likely to be an interesting month for gold and silver, and the price action this month could set the tone for the months ahead, just like it did in 2016.