The dollar index moved lower by 2.02% in the first quarter of 2017, and commodities prices moved higher with four of the six major sectors posting gains. Many raw materials made multiyear lows in late 2015 and early 2016 but have recovered in dramatic fashion, and industrial commodities and precious metals added to gains over the first three months of 2017. The dollar rallied to the highest level since 2002 in early January, but when the Fed hiked rates in March, the greenback corrected to the downside despite widening interest rate differentials with other currencies around the world.
A Winning Quarter
Precious metals led commodities with an 11.45% increase in Q1 as gold, silver, platinum, and palladium all posted gains and recovered from December 2016 lows. Base metals posted a 6.65% increase as disruptions at copper mines, the prospects for infrastructure rebuilding in the U.S., and Chinese demand supported prices. Grains posted a 1.37% gain as the planting season in the U.S. is just getting underway. Animal proteins moved 1.78% higher as the market prepares for increasing volatility as the 2017 grilling season begins at the end of May.
In an aside, the Baltic Dry Shipping Index posted an impressive 37.77% gain, which is an indication that the demand for raw materials around the globe is strong. Commodities are traveling from producers to consumers, and the increase in freight rates is a sign of a more active market as the BDI is at the highest level since 2014.
The Winners
Palladium, the industrial precious metal, was the big winner, posting a 17.46% gain in Q1. Lead, the base metal that trades on the LME, was hot on its heels as it rallied by 16.14%, and there were other double-digit gains seen across the raw materials spectrum. Aluminum, another base metal, moved 14.87% higher over the first three months of the year. The price of silver rallied 14.51% in Q1, following a more than 15% gain in 2016. In 2016, the bull market in zinc took the nonferrous metal over 59% higher, and in Q1, the party continued and zinc added another 8.61%.
Other notable gainers during Q1 were gold, which was up 8.63%, and copper, which rallied by 6.25% on the LME and 5.84% on COMEX. In the agricultural sector, cotton was up 9.46% and rice posted a 5.77% gain. Platinum was a laggard in the precious metals sector but managed to move 5.21% higher in the quarter. CBOT wheat was up 4.53% but KCBT wheat only rallied by 0.48% for the first quarter. Corn added 3.48% for the first three months of the year. Live cattle moved 3.36% higher. Gasoline managed a 1.79% increase while coffee added 1.64% and feeder cattle were 2.68% higher.
Many industrial commodities added to gains from 2016.
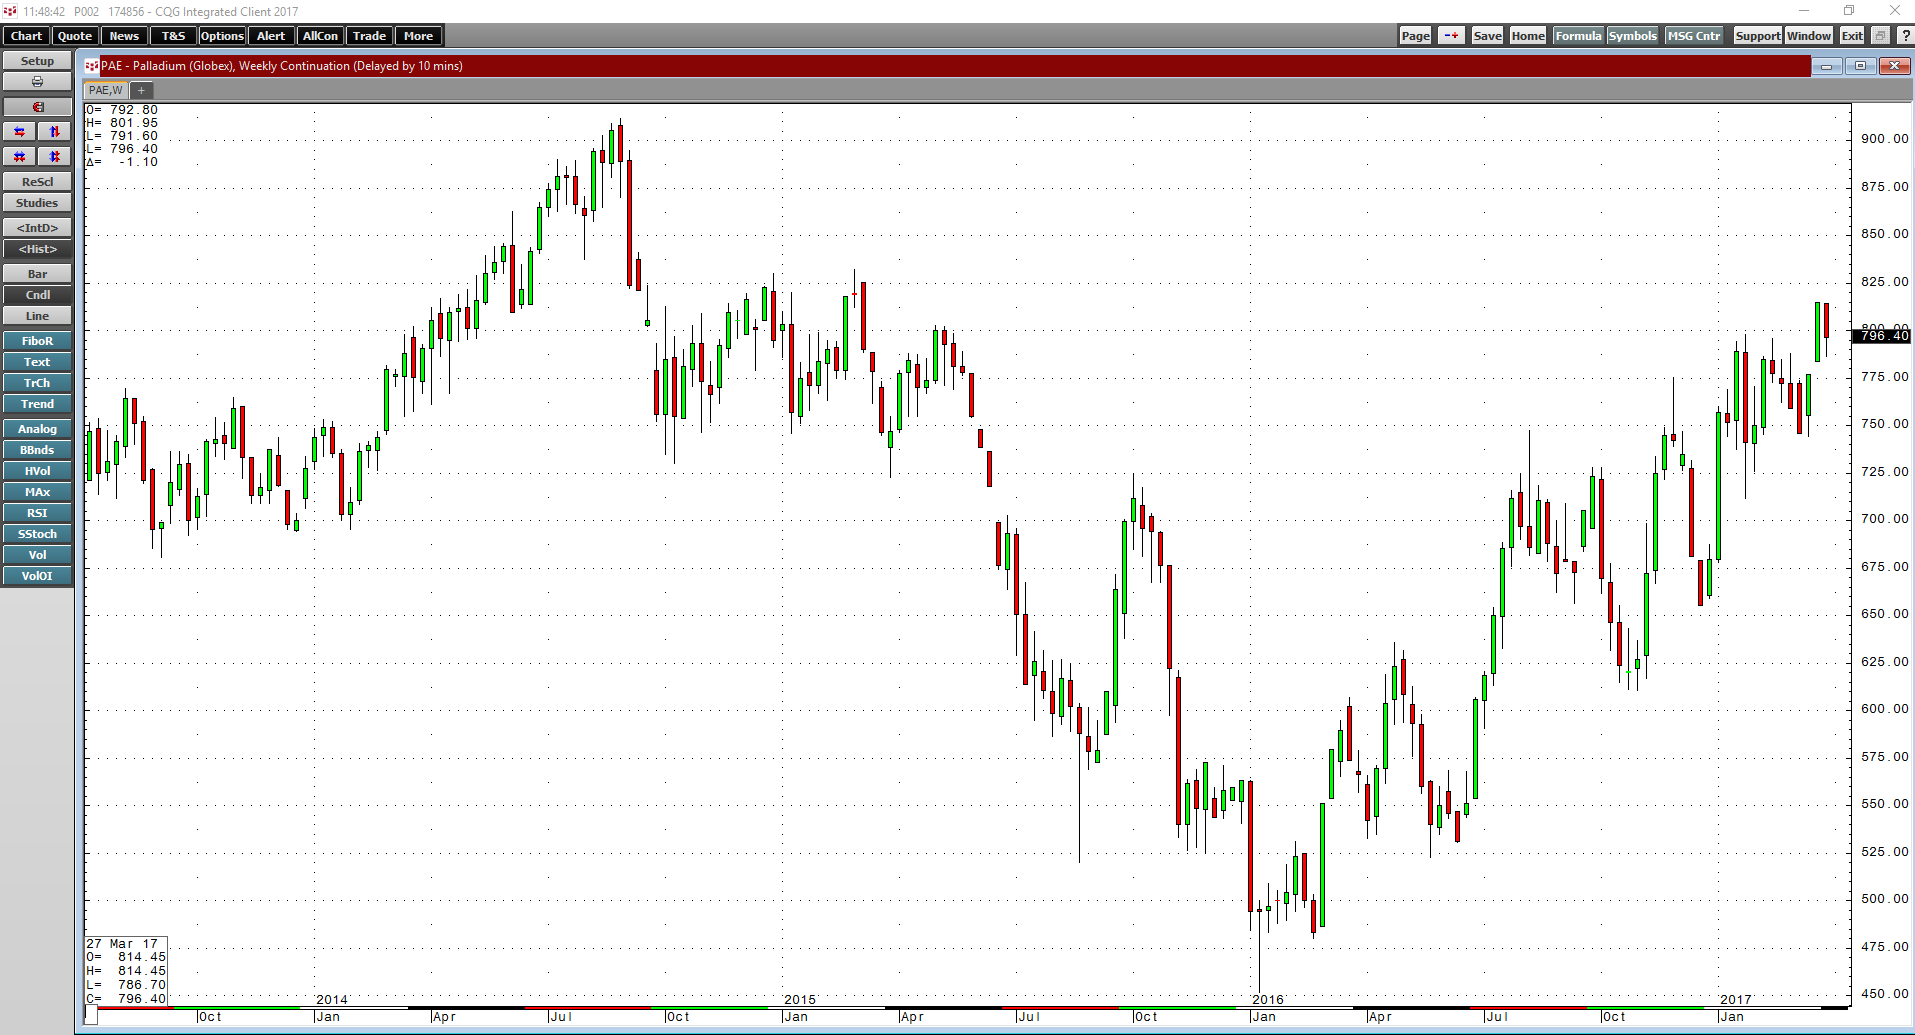
As the weekly chart illustrates, palladium was the best performer in the commodity sector in Q1 with a gain of almost 17.5%. Palladium rose to the highest price since March 2015.
The Losers
The biggest loser was the energy sector, which had been a leader in 2016. The composite of the primary energy commodities traded on US futures markets lost 5.35% during the first three months of the year. Soft commodities also lost ground during Q1 with a loss of 5.04% as three of the five commodities in the sector moved lower.
The biggest loser during Q1 was frozen concentrated orange juice futures, which lost 20.75 % of value.
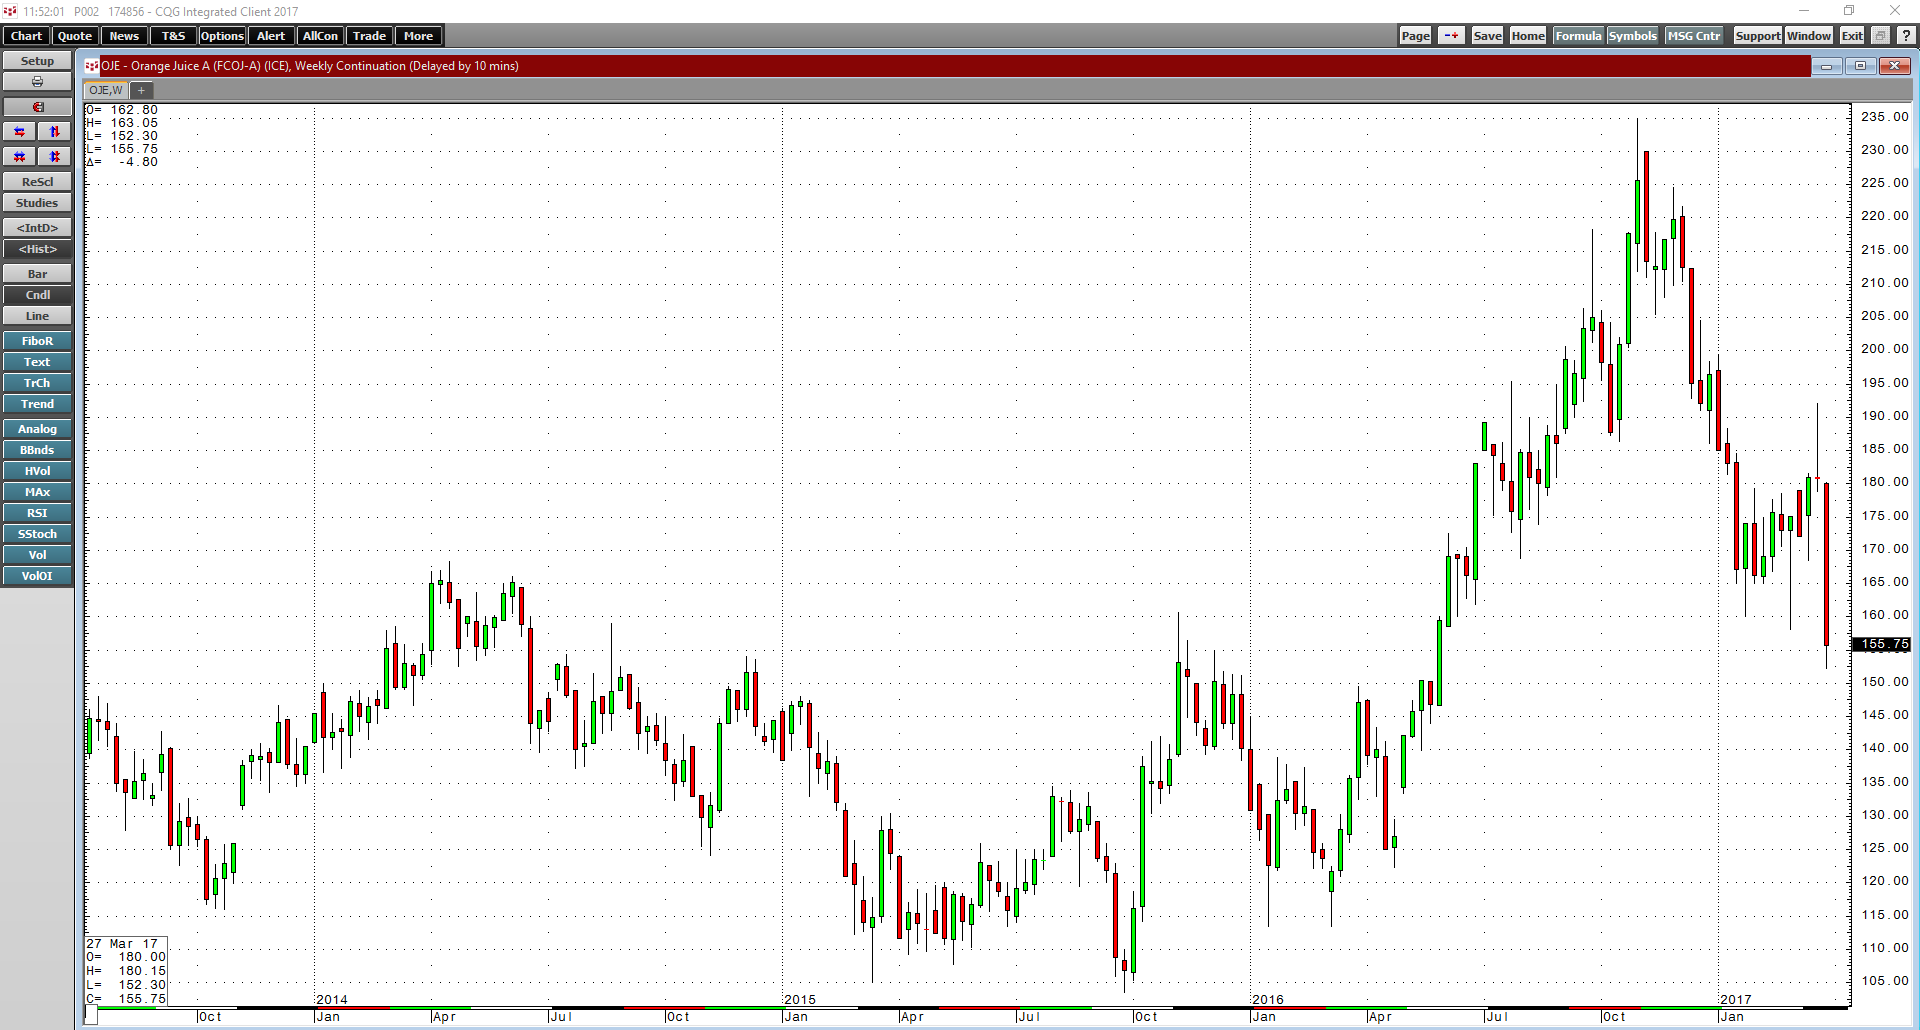
As the weekly chart of FCOJ futures highlights, the soft commodity fell from just under $2 per pound at the end of 2016 to just $1.57 at the end of Q1.
Sugar posted a 14.1% decline while natural gas moved to the downside by 14.85%. Heating oil lost 8.89% and WTI NYMEX crude oil shed 5.81% during the quarter. Brent crude was down just under 4%. Tin was down 4.56%. Soybeans dropped 5.07% while soybean oil lost 7.67%. Soybean meal dropped 1.44% over the first quarter of the year. Cocoa lost 1.46% and oats fell 1.86%. Nickel posted a 1.39% loss for the quarter. Other small losers include lean hogs, ethanol, and MGE wheat, which were all down less than 1%.
Q1 Highlights - Sweet and Sour Spots
The price of crude oil was stable throughout Q1 as increased shale production from the US balanced against the OPEC production cut, and the price of nearby NYMEX crude oil futures remained above the $50 per barrel level for the majority of Q1. Towards the end of the quarter, the price slipped to a low of $47.01 as inventories in the US rose to a record level according to the Energy Information Administration, but the price moved back to close on March 31 at just above the $50 mark. The $50 is a price that both consumers and producers around the world can support. For consumers, it is half the price that was trading in June 2014; and for producers, it is almost double the February 2016 lows at $26.05 per barrel. Therefore, $50 crude oil is a sweet spot for most market participants.
Speaking of sweet spots, sugar had been in a bull market that took the price from 10.13 in August 2015 to highs of 24.1 cents in October 2016. Sugar rallied because the low price and weather events caused a deficit to develop. However, as sugar moved above 20 cents per pound, output increased. It now looks like the market is shifting back to a surplus, and the price dropped below critical support at 17.84 cents during Q1.
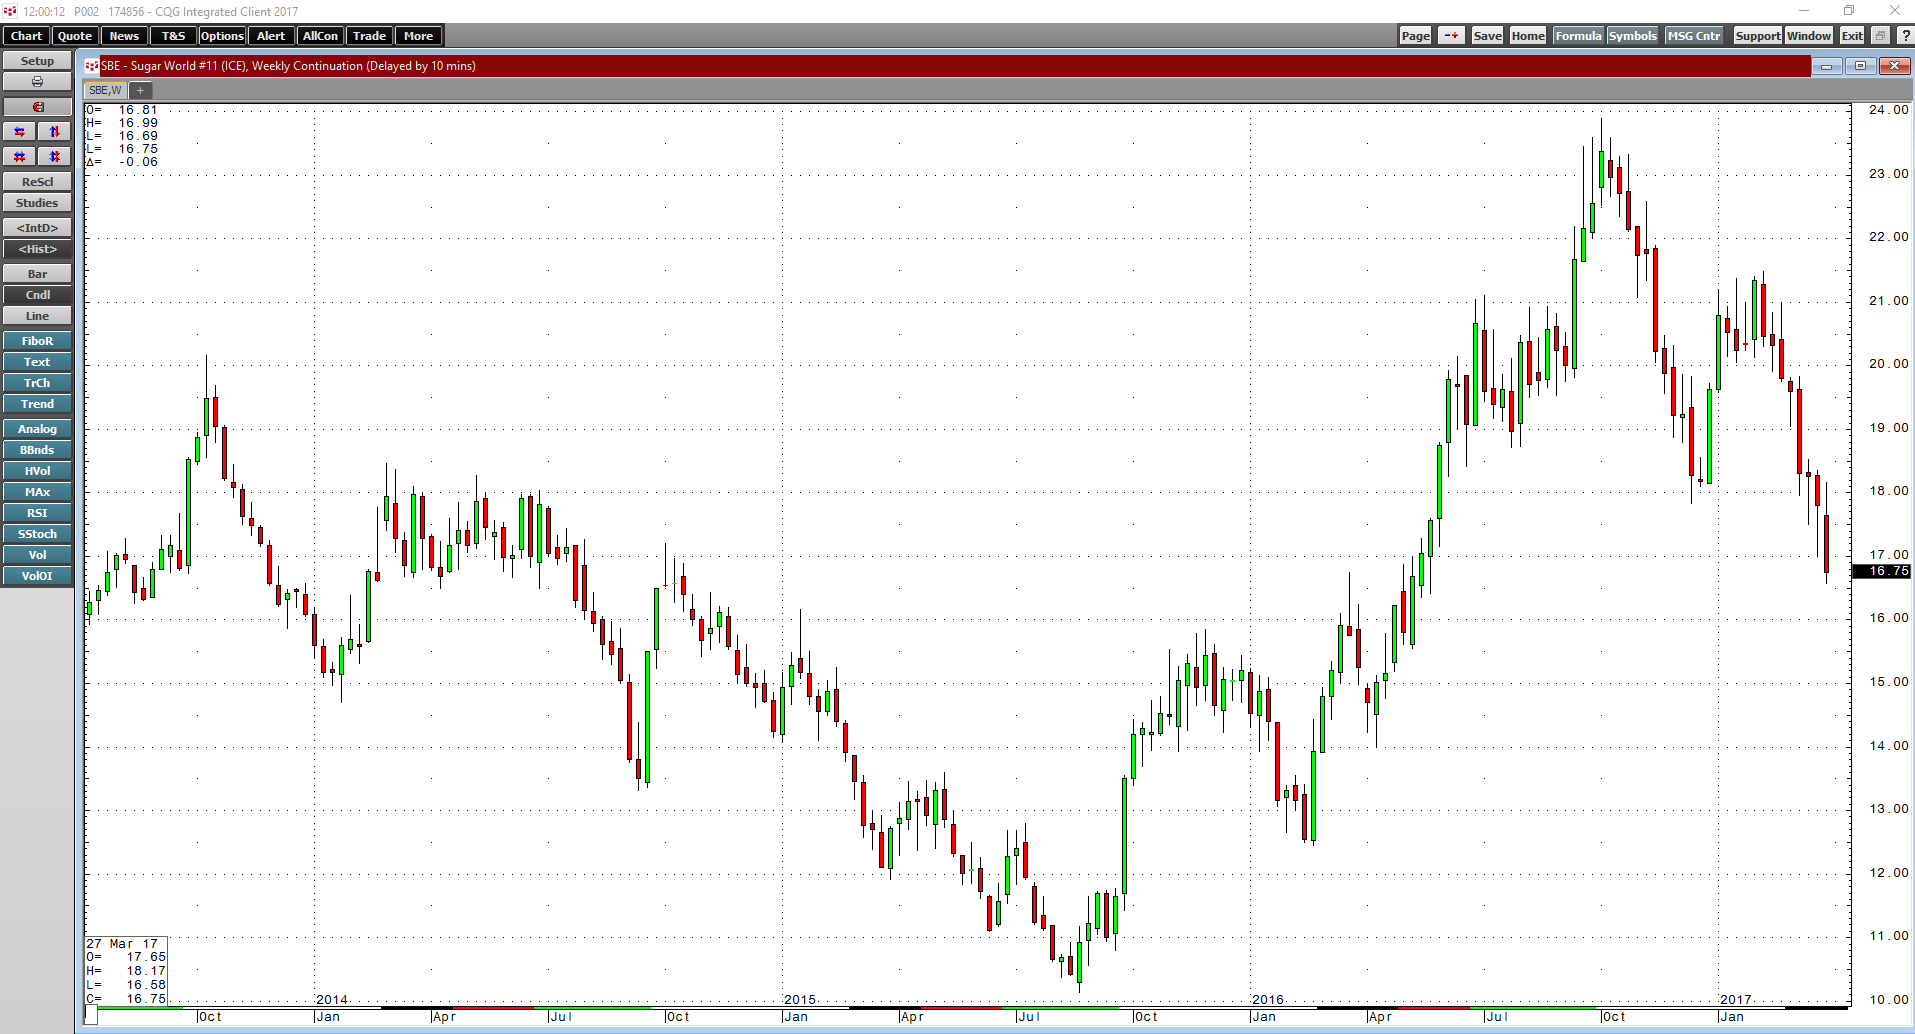
As the weekly chart of ICE sugar futures shows, the sweet commodities soured over the first three months of 2017 and closed Q1 below the 17 cent level. Sugar could be on its way to 15 cents in the weeks and months ahead.
Significant Events on the Horizon
As we head into the second quarter of 2017, there are lots of issues on the horizon that are likely to cause volatility across all asset classes, and commodities are no exception. Elections in France and Germany will result in increased variance in currency markets as the future of the European Union, and even the euro currency, will depend on the results. The US administration is likely to present initiatives on infrastructure building, trade, and tax reform before Congress, which will represent a departure from the status quo. Additionally, in the wake of the most recent Fed rate hike on March 15, the central bank has signaled that more increases in the Fed Funds rate are on the way throughout the balance of 2017.
All of these issues, as well as the unexpected surprises that always seem to occur over the course of a quarter, are likely to stoke volatility in markets, and commodities tend to be the asset class with the most price variance.