Gold opened 2017 with a roar after hitting lows in December. The price of the yellow metal has made higher lows and higher highs so far with the most recent peak coming on April 17, when the active month June COMEX futures contract hit $1297.50 per ounce.
The geopolitical landscape had been highly supportive of gains in the price of the yellow metal. The new President of the United States has faced many issues around the globe during his first 100 days in office. In the aftermath of a chemical weapons attack in Syria, President Trump bombed a Syrian airbase causing relations with the Russians to deteriorate. In Asia, the nuclear ambitions of North Korea have created fear and uncertainty to rise as the US Administration has been trading rhetoric with the North Korean leadership. At the same time, the French election could threaten the future of the European Union and euro currency, which weighed on the minds of many investors. Gold had found support around the world through the first three and one-half months of 2017, but recently the price has been correcting to the downside.
Gold Reached a New High for 2017 in April
Gold hit its most recent peak on April 17, but since then it has been correcting lower. It's been trading over $40 per ounce lower as weakness in silver, platinum, and other commodities have caused a price decline.
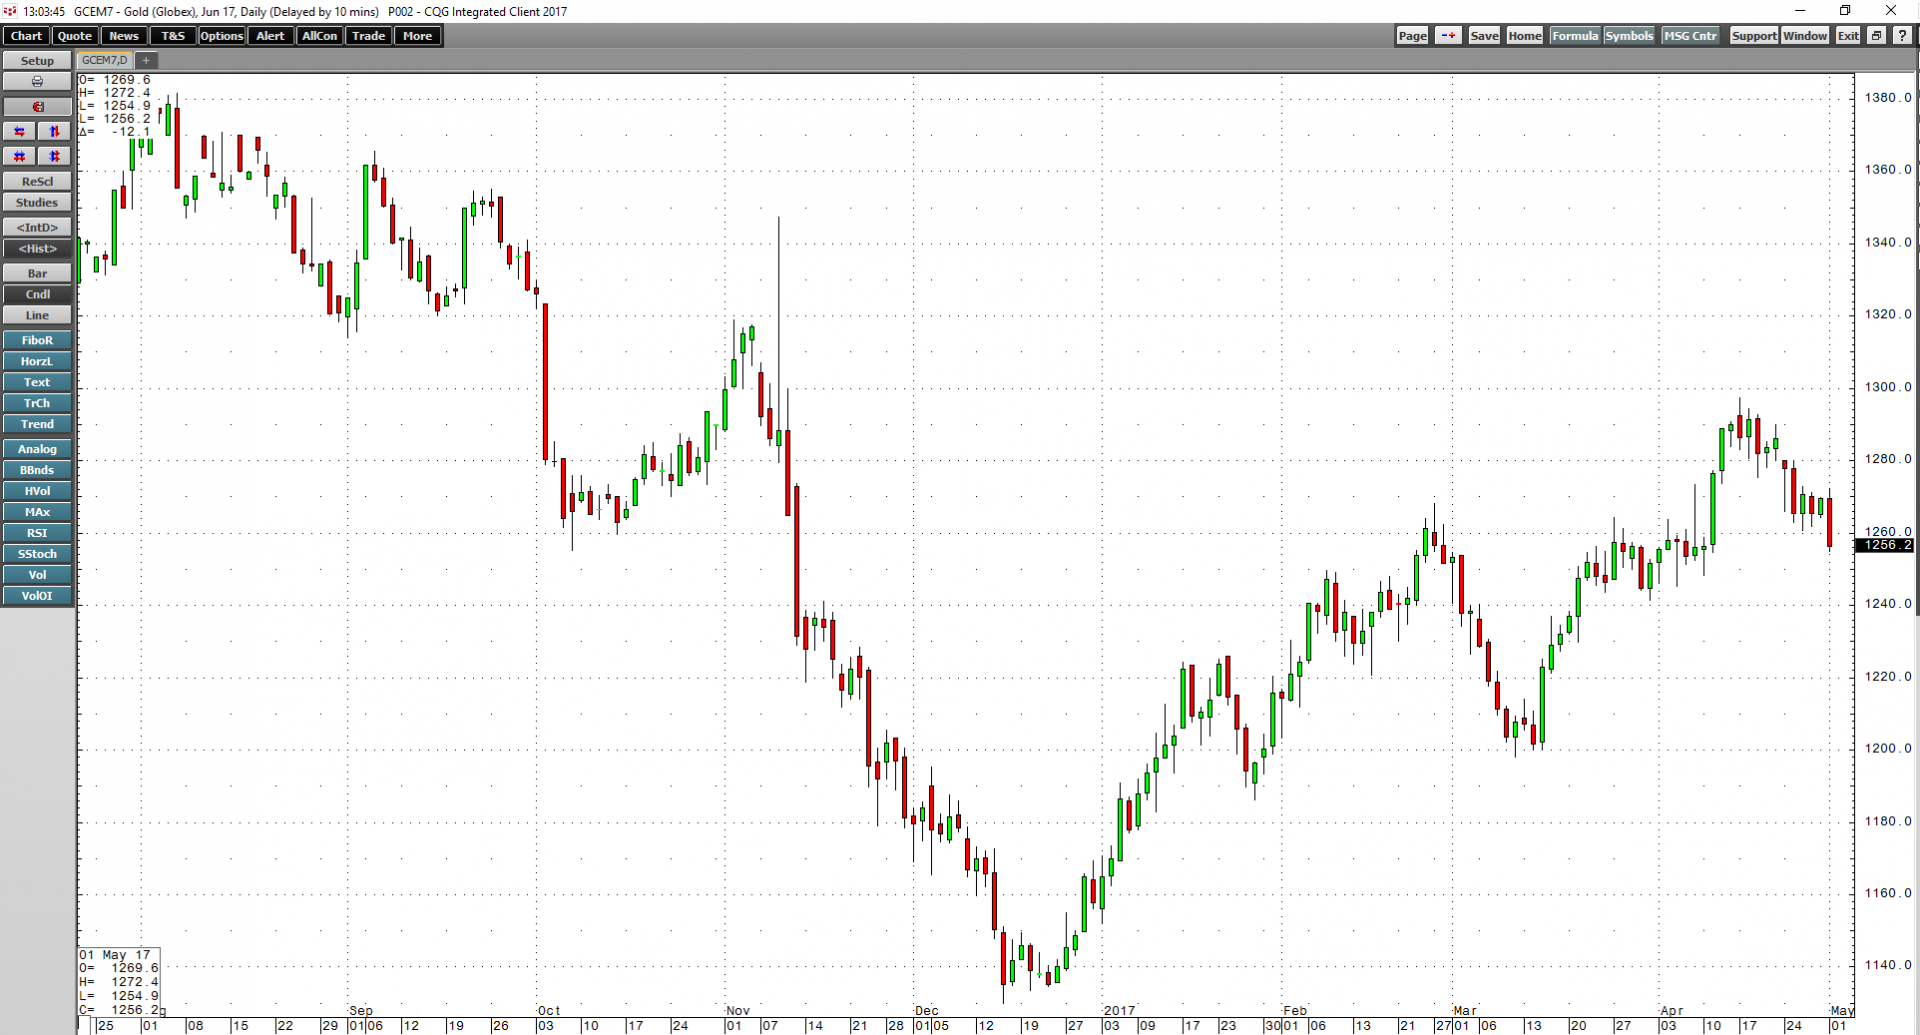
As the daily chart shows, after the most recent highs, the yellow metal has fallen around 3.3% to lows of $1254.90 on May 1. The drop in gold has been tame compared to silver, which has moved from $18.725 on the day gold made its highs to $16.81 on May 1. Silver has shed 10.2% of its value. At the same time, platinum has also moved lower over recent weeks.
The weakness in the precious metals sector comes at a time when uncertainty is still gripping the global economic and political landscape. When it comes to gold right now, the future path of least resistance for the price is a tale of three charts.
The Daily Chart - Bearish
After the most recent selling in gold, the daily chart is clearly in a downtrend.
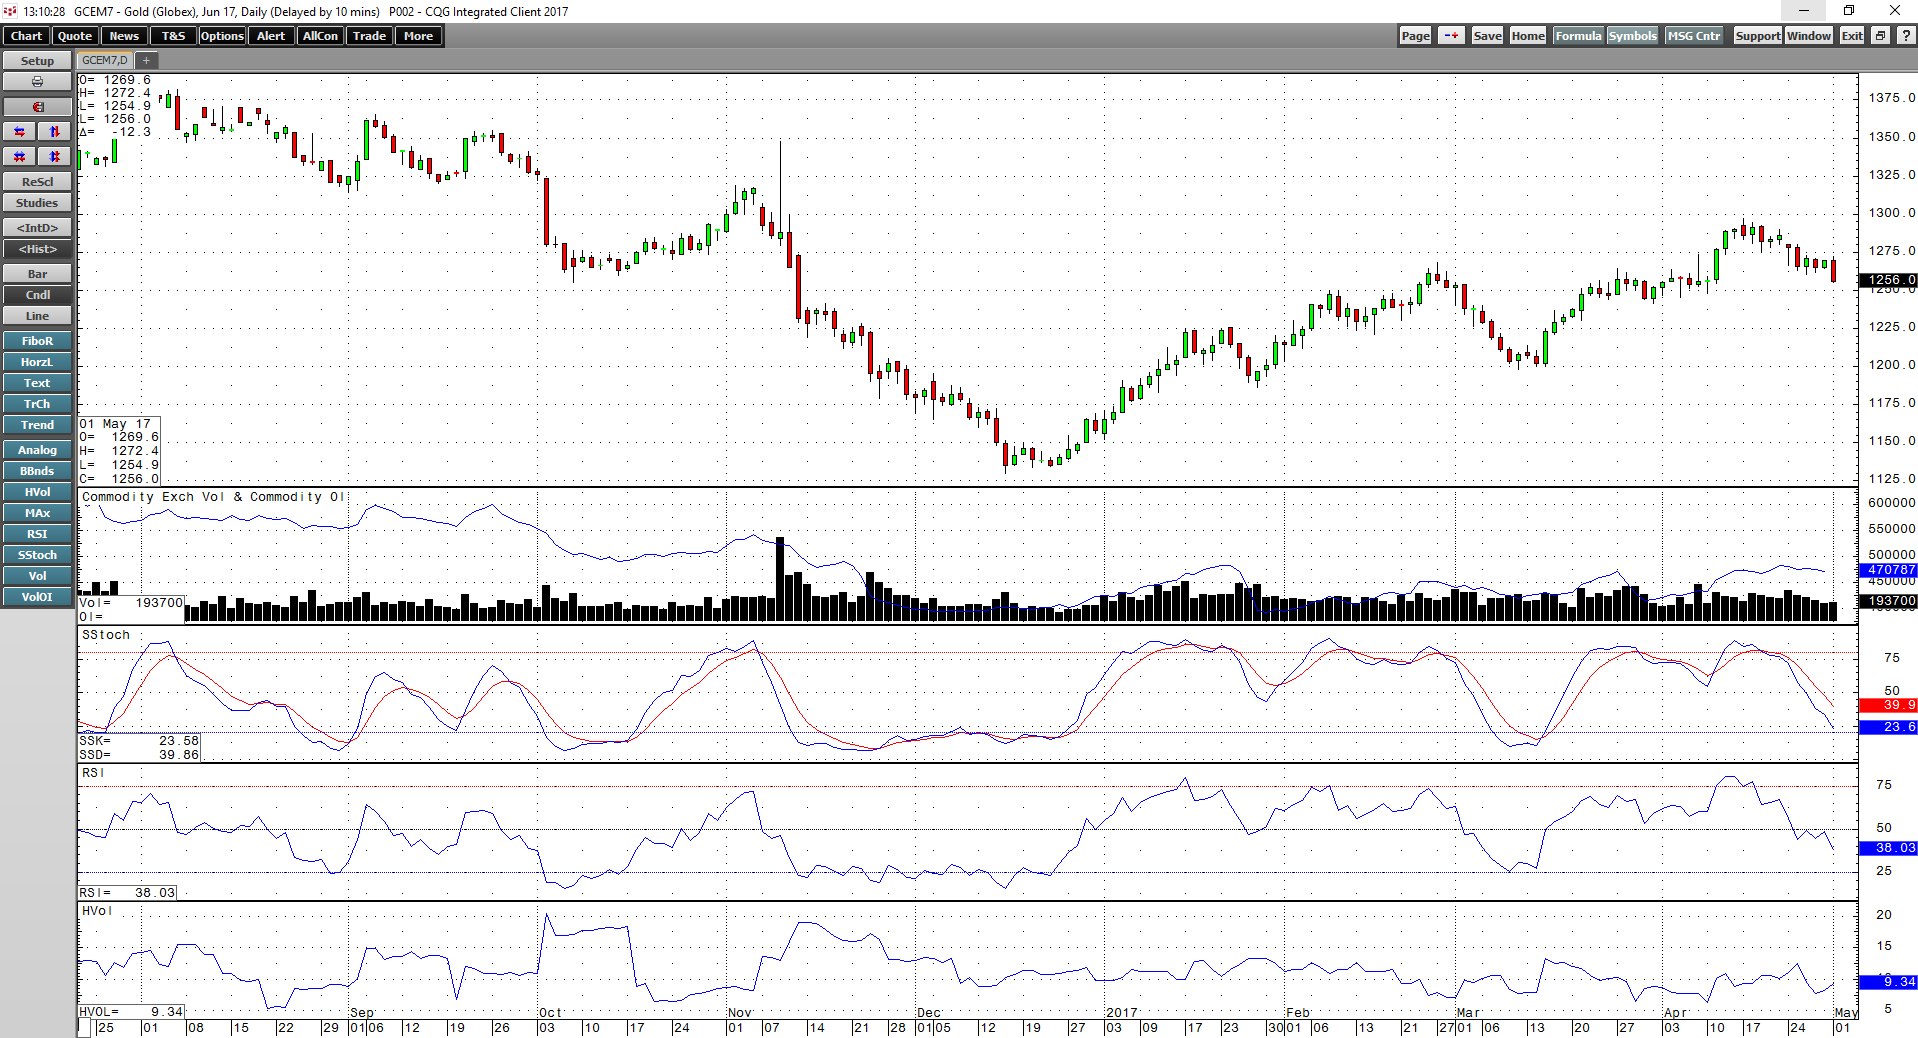
The daily chart highlights the fall in gold. The slow stochastic, a momentum indicator, has been falling since April 19, when it was in overbought territory. The relative strength metric also points to a downtrend for the price of gold at the start of May. Open interest, the number of open long and short positions, in COMEX gold futures has been stable; falling from around 474,250 contracts on the day gold hit the high to just under 471,000 on the final trading day of April. However, on Monday, May 1, gold played catch-up with other precious metals and the yellow metal put in a bearish key reversal trading pattern, which could mean more selling is on the way in the sessions ahead.
The Weekly - Crossing Lower
The weekly pictorial is also indicating that gold could be on its way down to test a critical area of technical support.

The recent price weakness has caused the slow stochastic to cross to the downside in overbought territory. The weekly chart is signaling a possible move down to test the $1246.80 support level. Below there, the area of critical support on the weekly chart is at the mid-March lows of $1194.50 per ounce.
The daily and weekly charts in gold do not paint a pretty picture for bulls in the market, but the monthly chart is painting a different picture.
Monthly - Some Hope for the Bulls
Gold put in a bearish key reversal trading pattern on the monthly chart in November 2016, which led to the December lows.
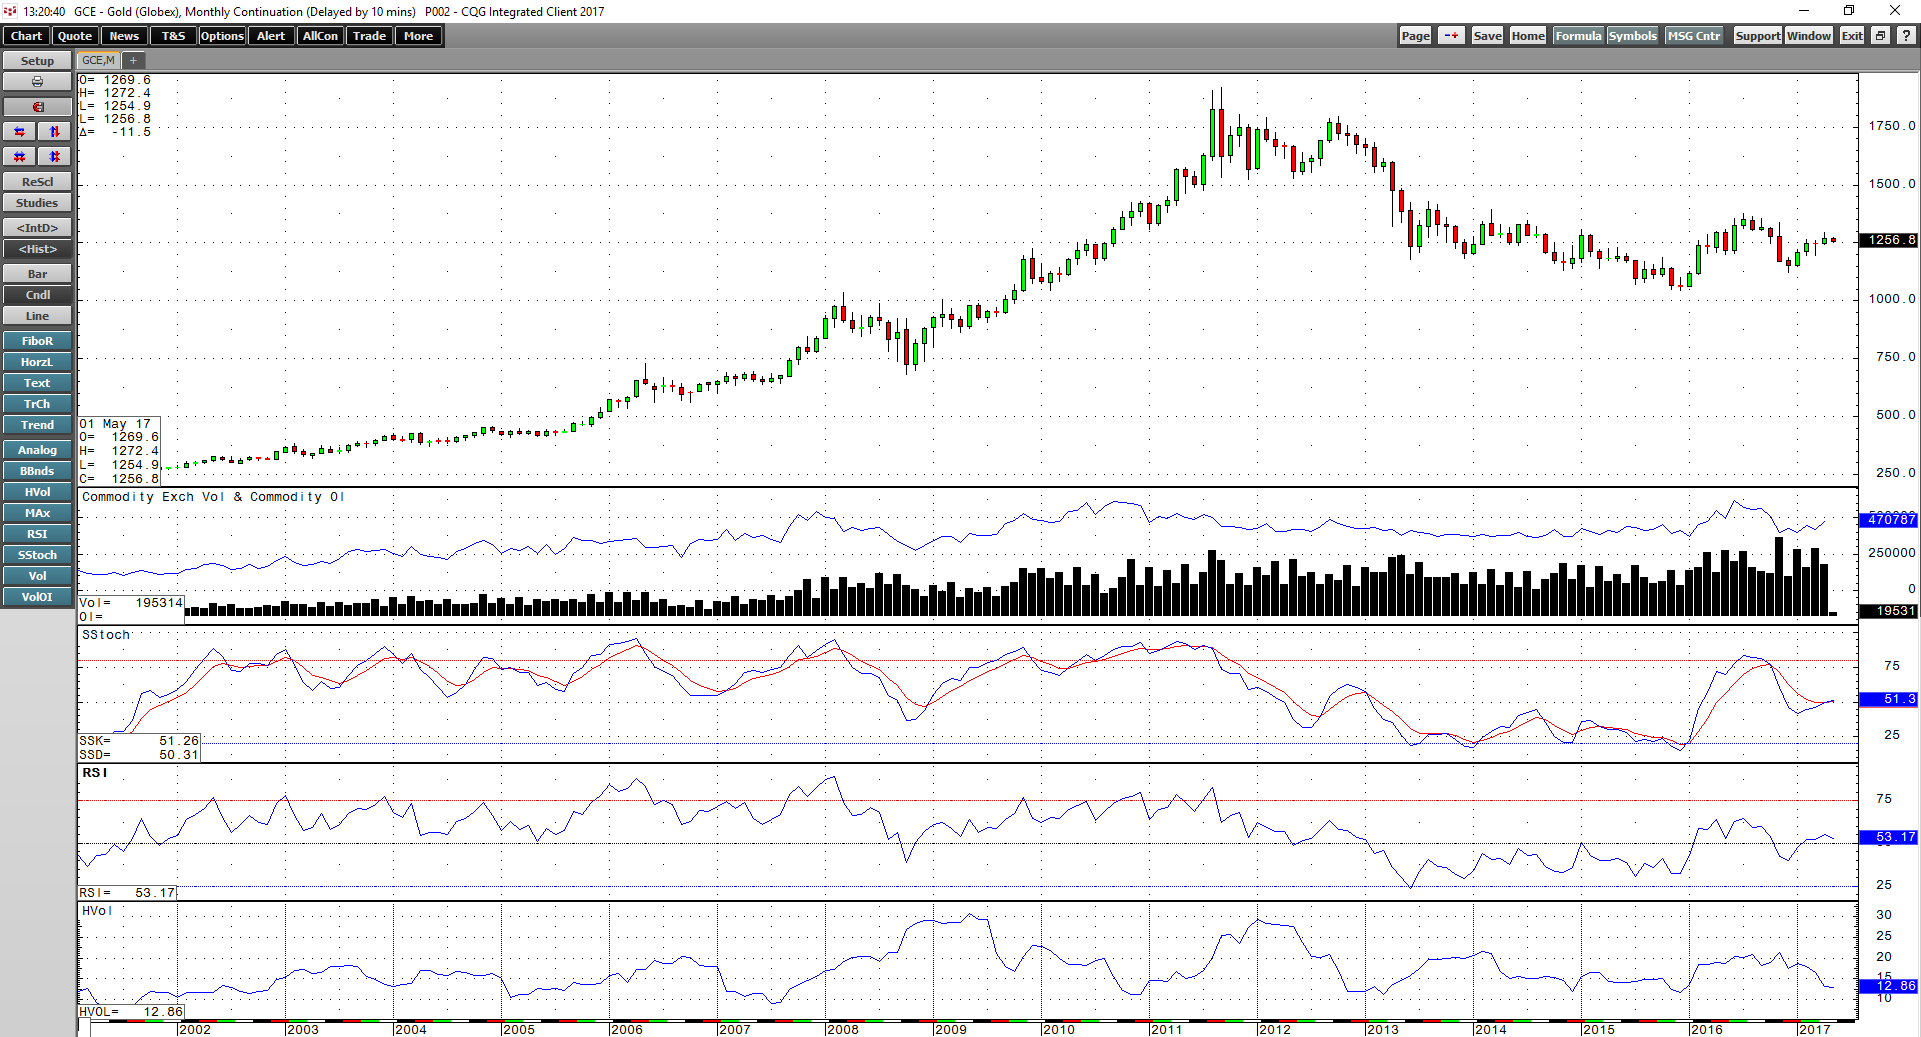
As the monthly chart illustrates, the momentum indicator currently looks like it is preparing to cross to the upside in neutral territory after the rally that commenced in late December and has taken gold to the April highs at just under $1300 per ounce. At the same time, open interest has been rising with the price of the precious metal over recent months, which is a technical validation of the upward trajectory of gold on the monthly chart.
The monthly chart tells us that gold is now at a critical level and the next move will likely establish the path of least resistance for the price. The daily and weekly charts are bearish, and the monthly chart is still at a level where a move above resistance at $1300 per ounce could turn the short-term bear back into a long-term bull.
A Confusing Picture, but Volatility Ahead
From a technical perspective, there is a confusing picture in gold these days. The price action on the first day of May only added to the confusion with a bearish key reversal trading pattern on the daily chart.
Fundamentals for gold remain supportive given the uncertainty of issues facing the world in the Middle East, Asia, and Europe. Looking at the short-, medium-, and long-term price charts for the precious metal does nothing to clarify the situation or provide reliable clues for the path of least resistance for the price.
So far in 2017, gold has done well, and the metal has increased its lustrous shine. However, the recent sell-off in gold and other precious metals could mean that a deeper correction is on the way. Meanwhile, one piece of news from any corner of the world could turn the short-term price trend around on a dime. I expect that the confusing technical picture for gold will result in increasing volatility during the month of May.