The dollar index moved lower by 4.79% in the second quarter of 2017. Out of the 29 commodities that I follow, 22 posted losses during the three-month period that ended last Friday, June 30. Commodities are watching the dollar move lower while interest rates are heading up. A weak dollar tends to be bullish for raw material prices, but higher real interest rates increase the cost of carrying inventories of commodities. Therefore, the results from raw materials sector reflected individual fundamentals as the macroeconomic picture remains confusing.
A Marginal Winning Quarter
During the period from April 1 through June 30, 2017, the animal protein sector, led by gains in lean hog futures was the best performing sector in the commodities market with a gain of 15.13% for the second quarter. The grain sector came in a close second in the commodities asset class with a composite gain of 13.34%. While agriculture ruled, the soft commodities sector did not participate.
The big winner in Q2 was MGE, which climbed 43.7% over the three months. Lean hogs appreciated by 38%, oats moved 29.32% higher, followed by KCBT wheat and CBOT wheat, which were up by 21.58% and 19.81% respectively.
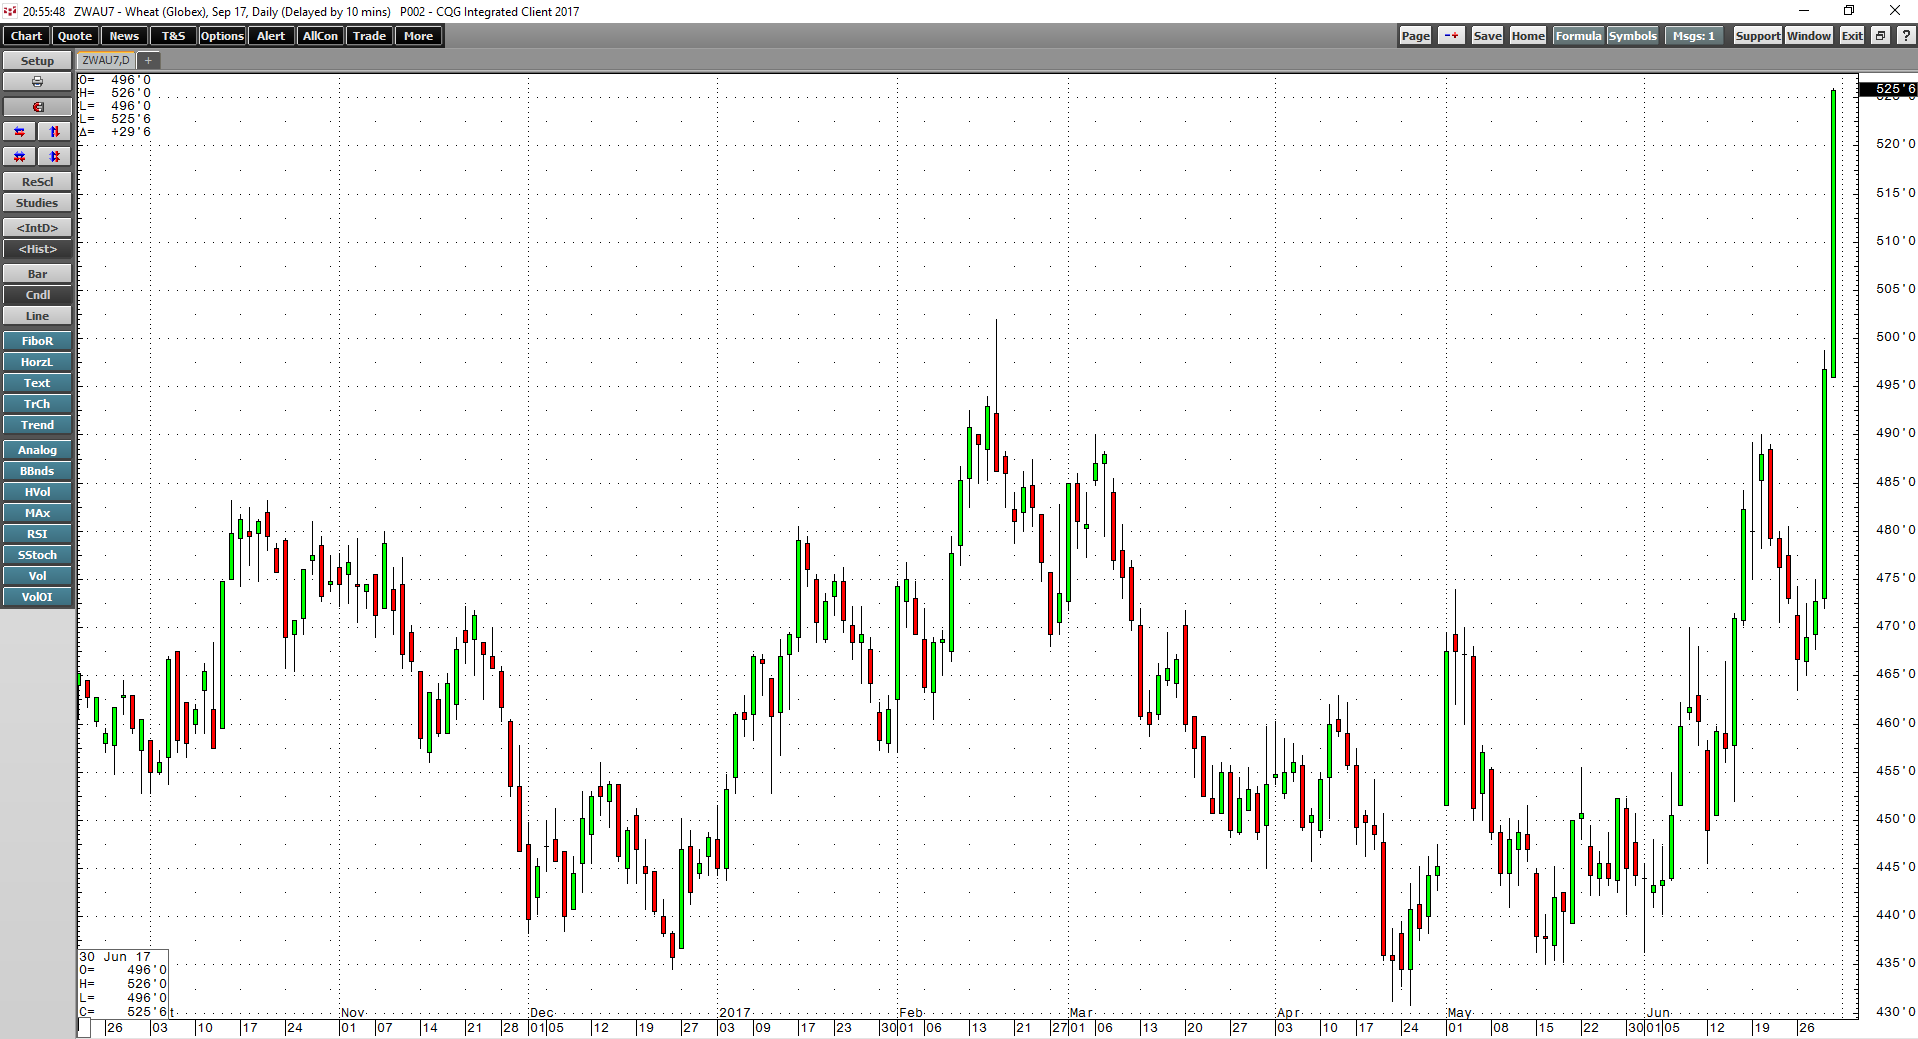
As the daily chart of CBOT wheat highlights, all of the gains in the wheat complex came at the end of Q2.
Rice futures gained over 16% during Q2. The only other double-digit gainer was feeder cattle which moved 10.43% to the upside over the three-month period that ended on June 30, 2017.
The Winners
Other notable gainers during Q2 were palladium, which added to gains from previous quarters rallying another 4.78%, and copper which was up 1.66% on COMEX and 0.94% on the LME. Corn futures were 1.72% higher, and soybean oil managed to gain 3.62% despite losses in the other two commodities in the oilseed complex. All of the other major commodities came out on the losing side in Q2, which was a quarter that saw lots of price corrections to the downside.
Many More Losers
The biggest loser was the soft commodities sector where each of the five commodities posted losses. The composite of sugar, coffee, cocoa, cotton, and frozen concentrated orange juice traded on the Intercontinental Exchange lost 11.52% during the second quarter of the year.

As the daily chart of ICE sugar futures illustrates, losses in the sweet commodity occurred throughout the quarter.
The second worst performer was the energy sector where losses in oil, oil products, natural gas, and ethanol added up to a move of 7.61% to the downside for the sector. Precious metals, the best performer in Q1 dropped 2.09% as the weak dollar could not bolster the prices of gold, silver, and platinum over the past three months. Base metals were down 1.84% in Q2 as copper was the only commodity in the sector to post a gain.
The biggest loser during Q1 was the volatile Baltic Dry Index which fell by 30.51% over the three month period. The price of iron ore shed 21.37% of its value in Q2, and sugar futures lost 17.60% of their value. Gasoline futures moved 11.16% lower, and coffee futures dropped 10.95%. Crude oil, cocoa, and silver all lost between 9 and 10% of their value while nickel’s loss amounted to just over 6.25%. Heating oil, ethanol, and natural gas all lost around 5%. While platinum, aluminum, cotton, and live cattle all lost between 2 and 5% in Q2. Other small losers of between 0-2% include gold, lead, tin, zinc, soybeans, and soybean meal.
Q2 Highlights
The most significant issues facing commodities markets during Q2 were the divergence between the dollar and interest rates in the U.S.

As the weekly chart of the US Dollar Index shows, the dollar hit the highest level since 2002 in early January, and it has been all downhill for the greenback since. Critical support now stands at the May 2016 lows at 91.88 and the index closed below its first level of support at 95.80 on the September futures contract on June 30 at 95.421.
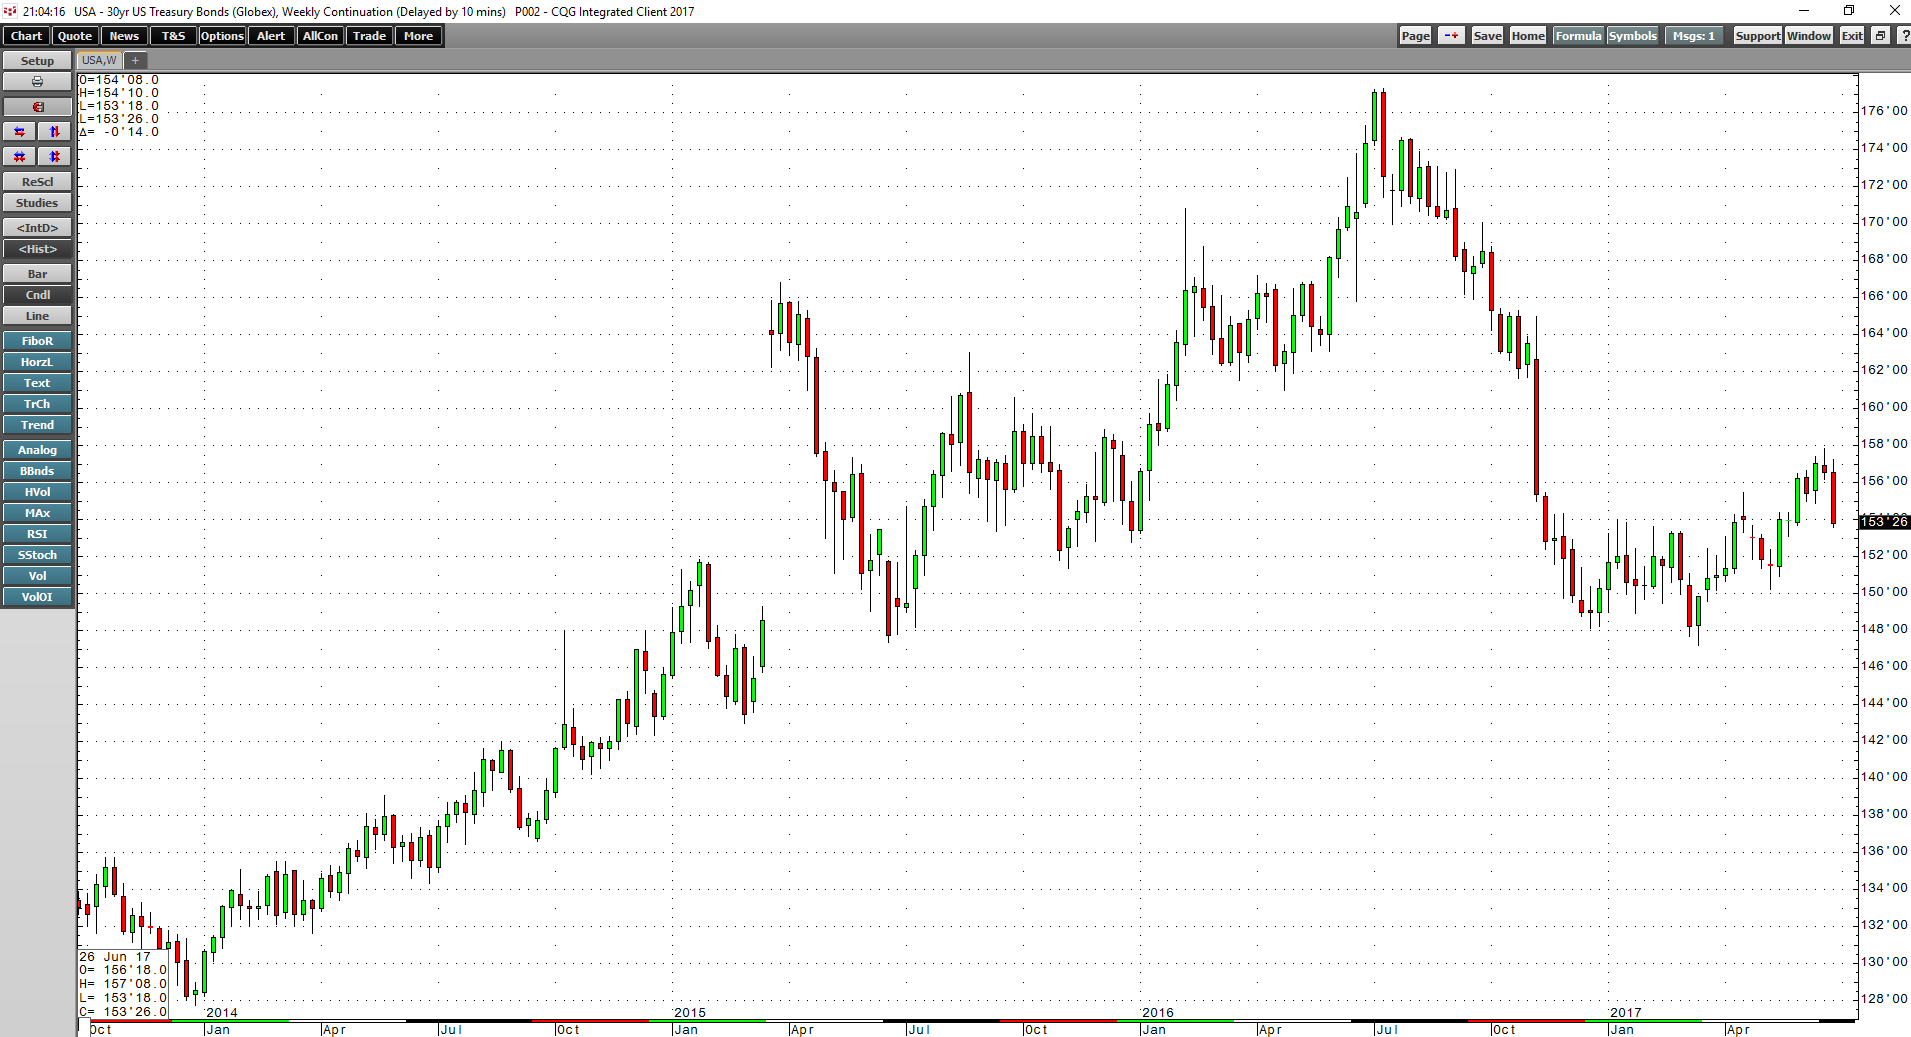
Meanwhile, the US long bond has declined after an attempt at a rally in the face of interest rate hikes and tighter monetary policies from the US Fed. Aside from hiking the Fed Funds rate again in June and stating that there will be another increase before the end of 2017, the central bank plans to reduce its balance sheet by $50 billion per month. At the same time, hawkish language from ECB President Mario Draghi means that higher rates may not just be a US phenomenon and the euro currency has rallied with the prospects of less accommodation in Europe.
Most commodities prices posted losses in Q2. Only the agricultural sectors, sans soft commodities, moved higher on weather-related issues. As we head into Q3, there are several significant events to watch when it comes to the path of least resistance for the raw material markets.
Significant Events on the Horizon
Commodities rallied in late 2016 and early 2017 on optimism about fiscal stimulus via a large infrastructure rebuilding project in the United States, but optimism has turned to pessimism. In Q3, legislative outcomes could lead to a return of optimism for infrastructure rebuilding projects.
In Europe, Germans will go to the polls in September. Right now it looks like Chancellor Angela Merkel will get a fourth term, and her re-election will be another vote of confidence for the European Union. The euro currency could likely move higher in the wake of a victory. A stronger euro and weaker dollar could lead to volatility and gains in many commodities markets.
The fall season tends to be the time of the year for corrections in the stock market on a historical basis. Any volatility in equities could lead to risk-off periods as well as capital in search of alternative investment vehicles, like commodities.
As always, commodities are the most volatile asset class, and there are plenty of issues that could ignite periods of massive price swings. The weather, political and economic events, and the unknown are all reasons to look for potential opportunities in many of the raw material markets.