The dollar index moved lower by 1.14% in the fourth quarter of 2017, and commodities prices moved higher with five of the six major sectors posting gains. Out of the 29 commodities that I follow, 16 posted gains during the three-month period that ended last Friday, December 29. The composite gained 4.88% in Q4 and finished 2017 with a 7.95% gain. While the dollar declined, higher interest rates are on the horizon in 2018. Optimism about the global economy caused rallies in many of the industrial commodities.
A Winning Quarter - Animal Proteins Lead the Way
During the period from October 1 through December 29, 2017, the animal protein sector was the big winner in the commodities asset class. Lean hogs posted a 29.85% gain for the three-month period, and the sector composite rose by 12.39%. All sectors, except for grains, moved higher in Q4. Energy climbed 7.78% to the upside with crude oil and oil products all up more than 23% for the three-month period. Precious metals were up 5.23% with palladium leading the way once again. Base metals moved 5.05% higher, and LME nickel jumped over 15% to the upside while copper also posted a double-digit gain. Soft commodities were up 1.73% on increases in sugar and cotton futures.
The big winner in 2017 was palladium futures, which climbed 56% on the year.
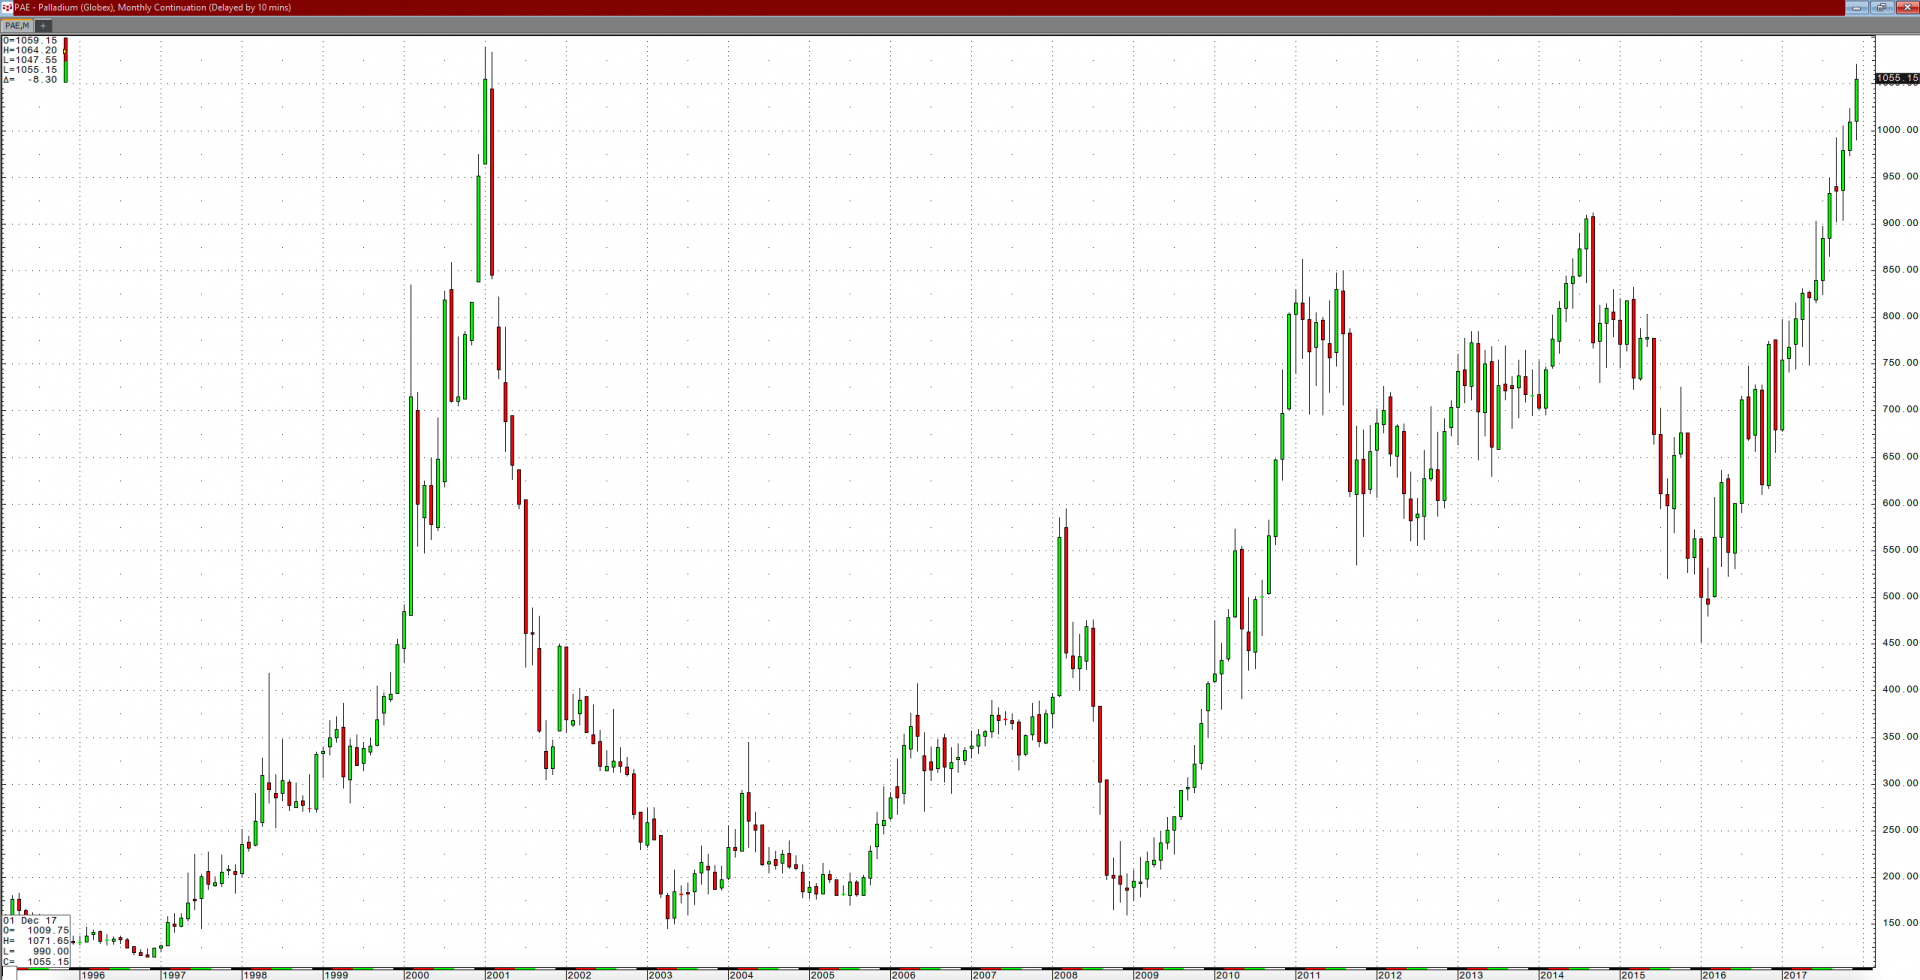
As the monthly chart of NYMEX palladium futures highlights, the price closed at its highest level since 2001, with March futures settling last Friday at the $1061 per ounce level. The all-time high in 2001 was at $1090.
Lots of Winners
Crude oil was a big winner in Q4 as NYMEX crude oil climbed 16.93% over the three months, while Brent crude oil appreciated by 16.56%. Heating oil and gasoline moved 14.35% and 13.01% to the upside during Q4 as they moved alongside crude oil in a sign that global demand for oil products remains strong. Nickel rallied at 15.44% over the final three months of the year. Cotton appreciated by 13.82% on a pair of bullish WASDE reports, while palladium continued to forge higher moving 13.45% to the upside in Q4. The other double-digit gainers were COMEX and LME copper, which rallied by 11.98% and 10.11% respectively; sugar, which was 11.96% higher; and live cattle, which moved 11.41% higher in Q4. Iron ore added 16.53% during the final three months of the year, while lumber was 11.39% higher.
The CFTC has defined digital currencies as commodities, and this asset class experienced some of the most explosive gains in history in Q4 and 2017. Bitcoin was just over 250% higher in Q4 and over 1420% higher in 2017. Ethereum increased by over 90-fold in 2017.
Few Losers
The only sector that suffered a loss in Q4 was grain where prices moved to the downside on the back of the fifth straight year of bumper crops and record inventory levels. The grain sector lost 2.90% during the fourth quarter of the year, but it posted a 6.03% gain on the year as the lower dollar provided some support for the sector.
The most significant loser during Q4 was ethanol, which fell by 12.35% over the three-month period. Frozen concentrated orange juice shed 8.32% of its value in Q4, and cocoa lost 7.39% of its value. LME tin fell by 4.46%, feeder cattle moved 4.09% to the downside, and CBOT wheat lost 4.74% in Q4. Oats were down 4.08%, KCBT wheat fell around 3.5%, and rice lost 2.63%. Natural gas lost only 1.86% of its value thanks to a big rally on the final days of the quarter. The Baltic Dry index, soybeans, corn, MGE wheat, and coffee all were down between 1 and 2% in Q4. LME lead was down just 0.28% for the three-month period. Only the soft commodities sector posted a loss on the year.
Q4 Highlights - Industrial Commodities Thrive While Agricultural Prices are Weak
In the final quarter of the year, a trend continued that was in place throughout 2017. Economic growth around the world and a lower dollar caused bullish price action in industrial commodities. Metals and minerals were the big winners in Q4 and 2017, while energy commodities also posted gains. The dollar slipped by over 10% on the year and many of the raw materials that are sensitive to economic conditions posted double-digit increases in 2017. Agricultural commodities were weak as weather supported crops and there were sufficient supplies to feed a growing world. Inventories moved higher, causing price weakness in many of the commodities in the grain and soft commodities sectors.
Many times, the worst performing sectors one year become the next year’s biggest winners. However, when it comes to agriculture, Mother Nature is always the judge for the path of least resistance of prices. The one constant in these commodities is that each year demand rises with gains in population and wealth around the world.
Prospects for Q1 - Volatility Ahead in 2018
As we head into the first quarter of the New Year, there were two patterns on the long-term charts that developed in December that are worth watching in the weeks ahead.
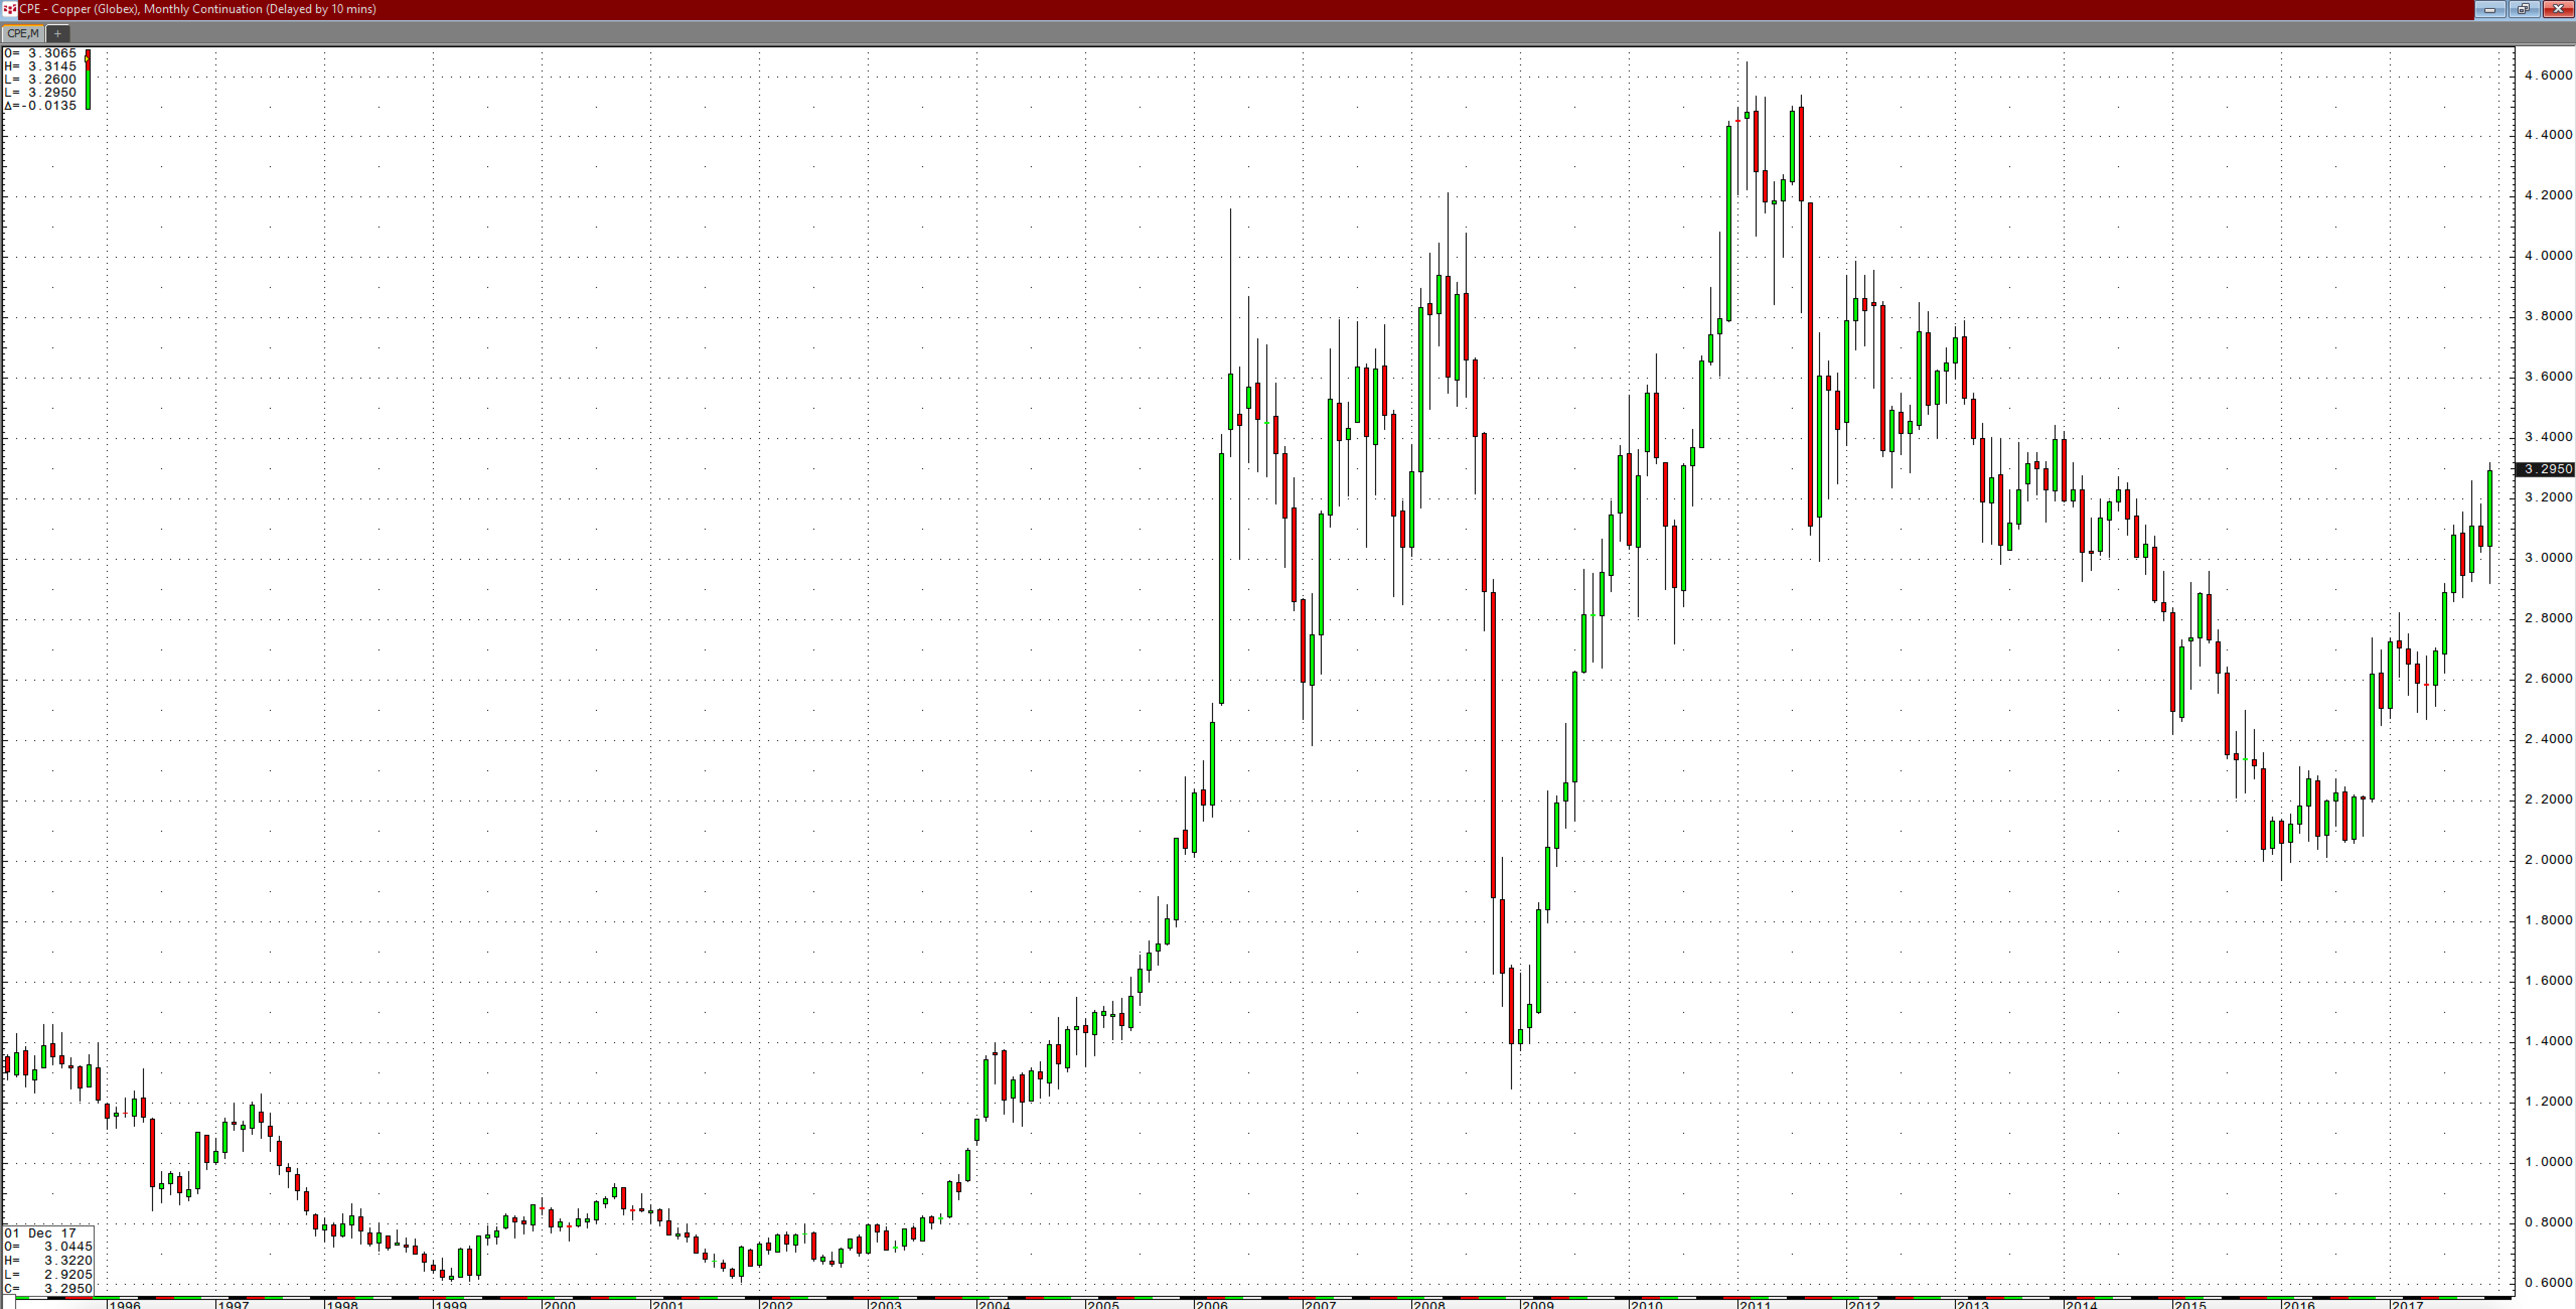
As the monthly chart highlights, COMEX copper put in a bullish key reversal trading pattern on the monthly chart in December. The red metal fell to a price that was lower than November’s low and closed above the highs of the prior month. Copper is a bellwether commodity that tends to diagnose the overall health of the global economy. March copper futures rose to a high of $3.3220 per pound at the end of the year and settled 2017 just above the $3.30 level, which is the highest price since 2014. A continuation in the bull market in copper could be a bullish signal for the commodities sector in the coming year.
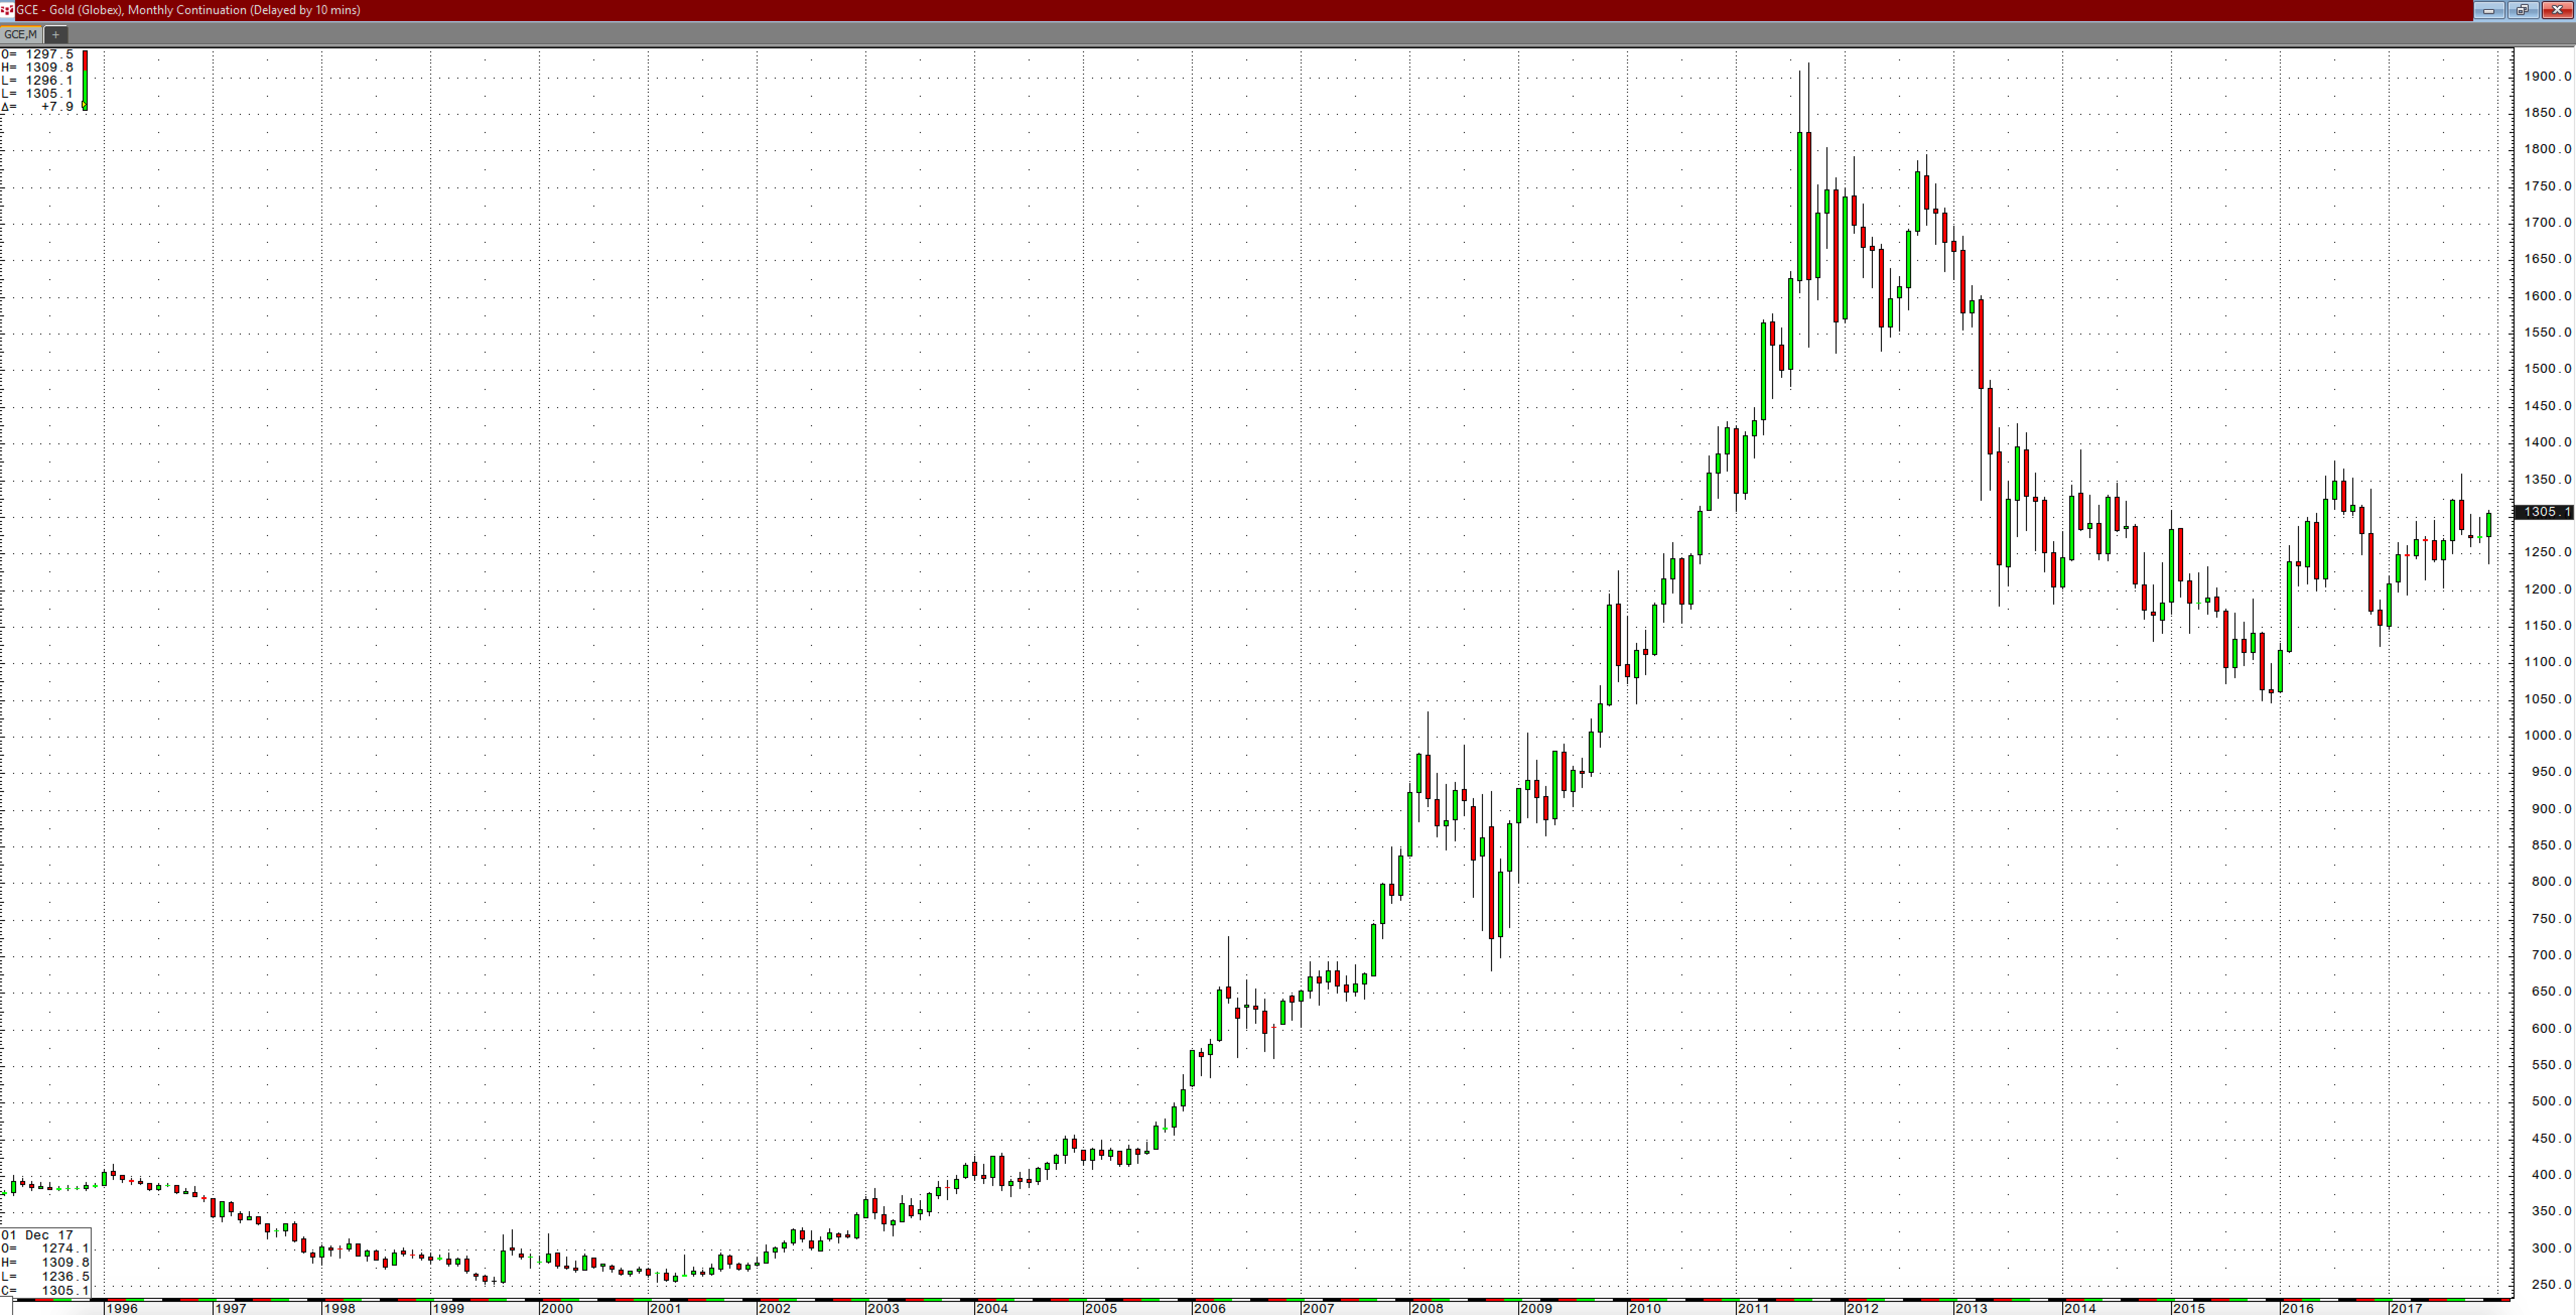 It was a rough start to the final month of the year for gold as it fell to a low of $1236.50 on the continuous COMEX futures contract in mid-December. However, the monthly chart illustrates that the yellow metal also put in a bullish key reversal trading pattern on the long-term chart as gold rallied to close the year above $1300 per ounce.
 Finally, as the monthly chart of NYMEX crude oil shows, the energy commodity finished 2017 on the highs and settled above $60 per barrel at the end of the year for the first time since 2013. Crude oil was trading at the highest price since June 2015, and technical resistance is at the $62.58 level, the peak from May 2015.
Commodities tend to be the most volatile asset class of all, and the current economic and geopolitical landscapes could make 2018 a rollercoaster of volatility in markets across all asset classes. Volatility is an investor’s nightmare, but a trader’s paradise as it tends to create myriad of opportunities.
Happy New Year and all the best for a happy, healthy, and profitable 2018!