The dollar index moved lower by 2.19% in the first quarter of 2018, and commodities prices edged lower with three of the six major sectors posting gains. Out of the 29 commodities that I follow, 16 posted gains during the three-month period that ended last Thursday, March 29. The composite gained 7.95% in 2017. While the dollar declined, higher interest rates and increased volatility in the stock and bond markets caused some risk-off behavior in markets across all asset classes.
Animal Proteins Were the Worst Performing Sector
During the period from January 1, 2017 through March 29, 2017, the animal protein sector was the big loser in the commodities asset class. Lean hogs posted a 20.24% loss for the three-month period, and the sector composite declined by 11.78%.
The second worst performing sector was precious metals, which fell by 4.08% for the three-month period. Palladium futures led the way on the downside, posting an 11.05% loss for the quarter. Silver lost over 5% of its value while gold was marginally higher, and platinum fell just over 1% since the start of the year.
Base metals that trade on the London Metals Exchange lost 0.96% of their value in Q1, led by losses in aluminum, which declined by 10.53% for the quarter. The aluminum market was front and center when it came to the Trump Administration’s tariffs of 10% on imports of the base metal.
Other notable declines in the commodities markets came in ICE sugar futures, which fell by 18.54%, and COMEX copper, which dropped 8.33% since the start of the year.
The CFTC has defined digital currencies as commodities, and after an explosive year on the upside in 2017, prices imploded. The cryptocurrency asset class, that was all the rage in 2017, melted in Q1 with Bitcoin falling 53.70%, Ethereum dropping 49.75%, and the market cap of the asset class as a whole moving from $615.3 billion to $255.3 billion, down 58.50% for the three-month period.
Grains Appreciate and Lots of Other Winners in Q1
The big winner in Q1 was cocoa futures, which climbed 35.1% over the three-month period that ended last Thursday.
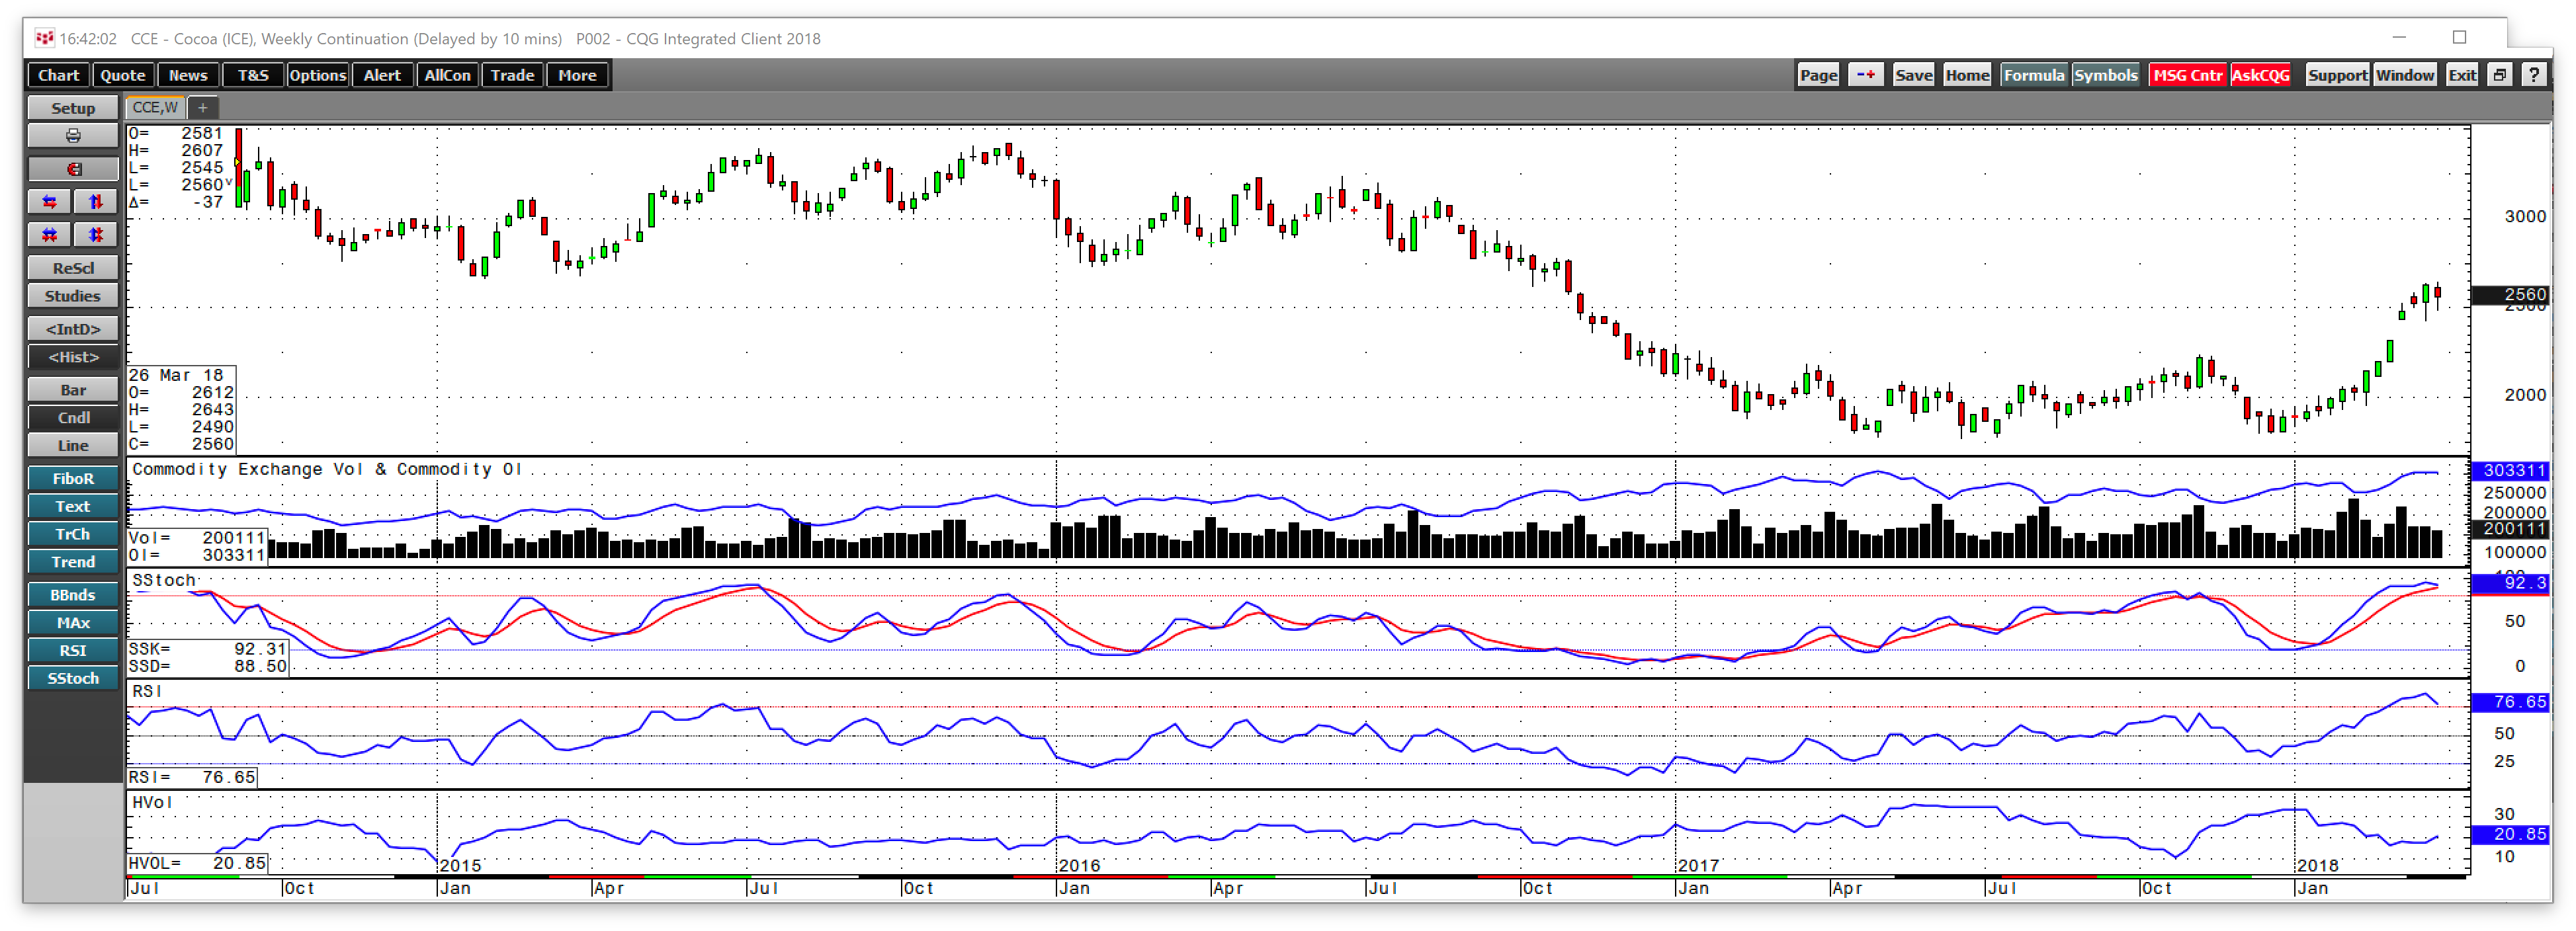
As the weekly chart highlights, ICE cocoa futures came out of the gate rallying in 2018, and they hit their high for the quarter at $2643 per ton during the final week of March. Open interest rose with the price, which was a technical validation of the bullish price action. However, the primary ingredient in chocolate confectionery products left a gap from $2320 to $2430, which could come into play during Q2 as price action tends to fill voids on charts.
The grain sector was the top performer in Q1, posting a 5.02% increase, with corn up 10.55% and soybeans moving 9.77% to the upside. Dry conditions in Argentina and uncertainty about the 2018 crop year led to gains. On the final day of trading in the quarter, grain prices exploded higher.

As the daily chart illustrates, the price of soybeans moved appreciably to the upside on the final day of trading in Q1 on heavy volume. Soybean meal, a product of the raw oilseed, posted a 22.84% increase for the first three months of the year that ended last week.
Energy was the second best performing sector of the commodities market, moving 4.02% higher. WTI and Brent crude oil, gasoline, and ethanol appreciated while natural gas and heating oil futures declined. Gasoline and ethanol posted double-digit gains on a percentage basis in Q1.
Soft commodities moved 3.51% to the upside for the quarter, led by the price action in cocoa, while cotton and orange juice futures also moved higher. However, losses in sugar and coffee futures weighed on the results in the sector.
Q1 Highlights – Volatility Returns to Markets
After a steady and consistent bull market in equities that began after an 11.5% drop in the S&P 500 index during the first six weeks of 2016, stocks hit a wall in Q1 2018.
The VIX Index, which measures the implied volatility of stock options on shares listed in the S&P 500, spent the majority of 2017 trading around the 10 level. In early February, a selloff inspired by rising interest rates caused the VIX to explode to over 50. The index closed Q2 at 19.97, a level that was higher than the highs in all of 2017. The volatility in stocks and bonds caused lots of price action in markets across all asset classes, including commodities.
Another highlight of the first three months of the year was the Trump Administration’s imposition of 10% and 25% tariffs on aluminum and steel and $60 billion of the protectionist tool against China. Tariffs and subsidies tend to distort price action in commodities markets because they interfere with the natural supply and demand fundamentals.
Finally, the dollar continued on its downward path, and it is possible that we could see it fall further against other major currencies. From 1985 through 2017, the dollar index has alternated between seven-year declining trends and nine-year rallies. A continuation of volatile trading conditions in equity and debt markets increases the chances for risk-off periods where traders and investors move to cash and sell all assets.
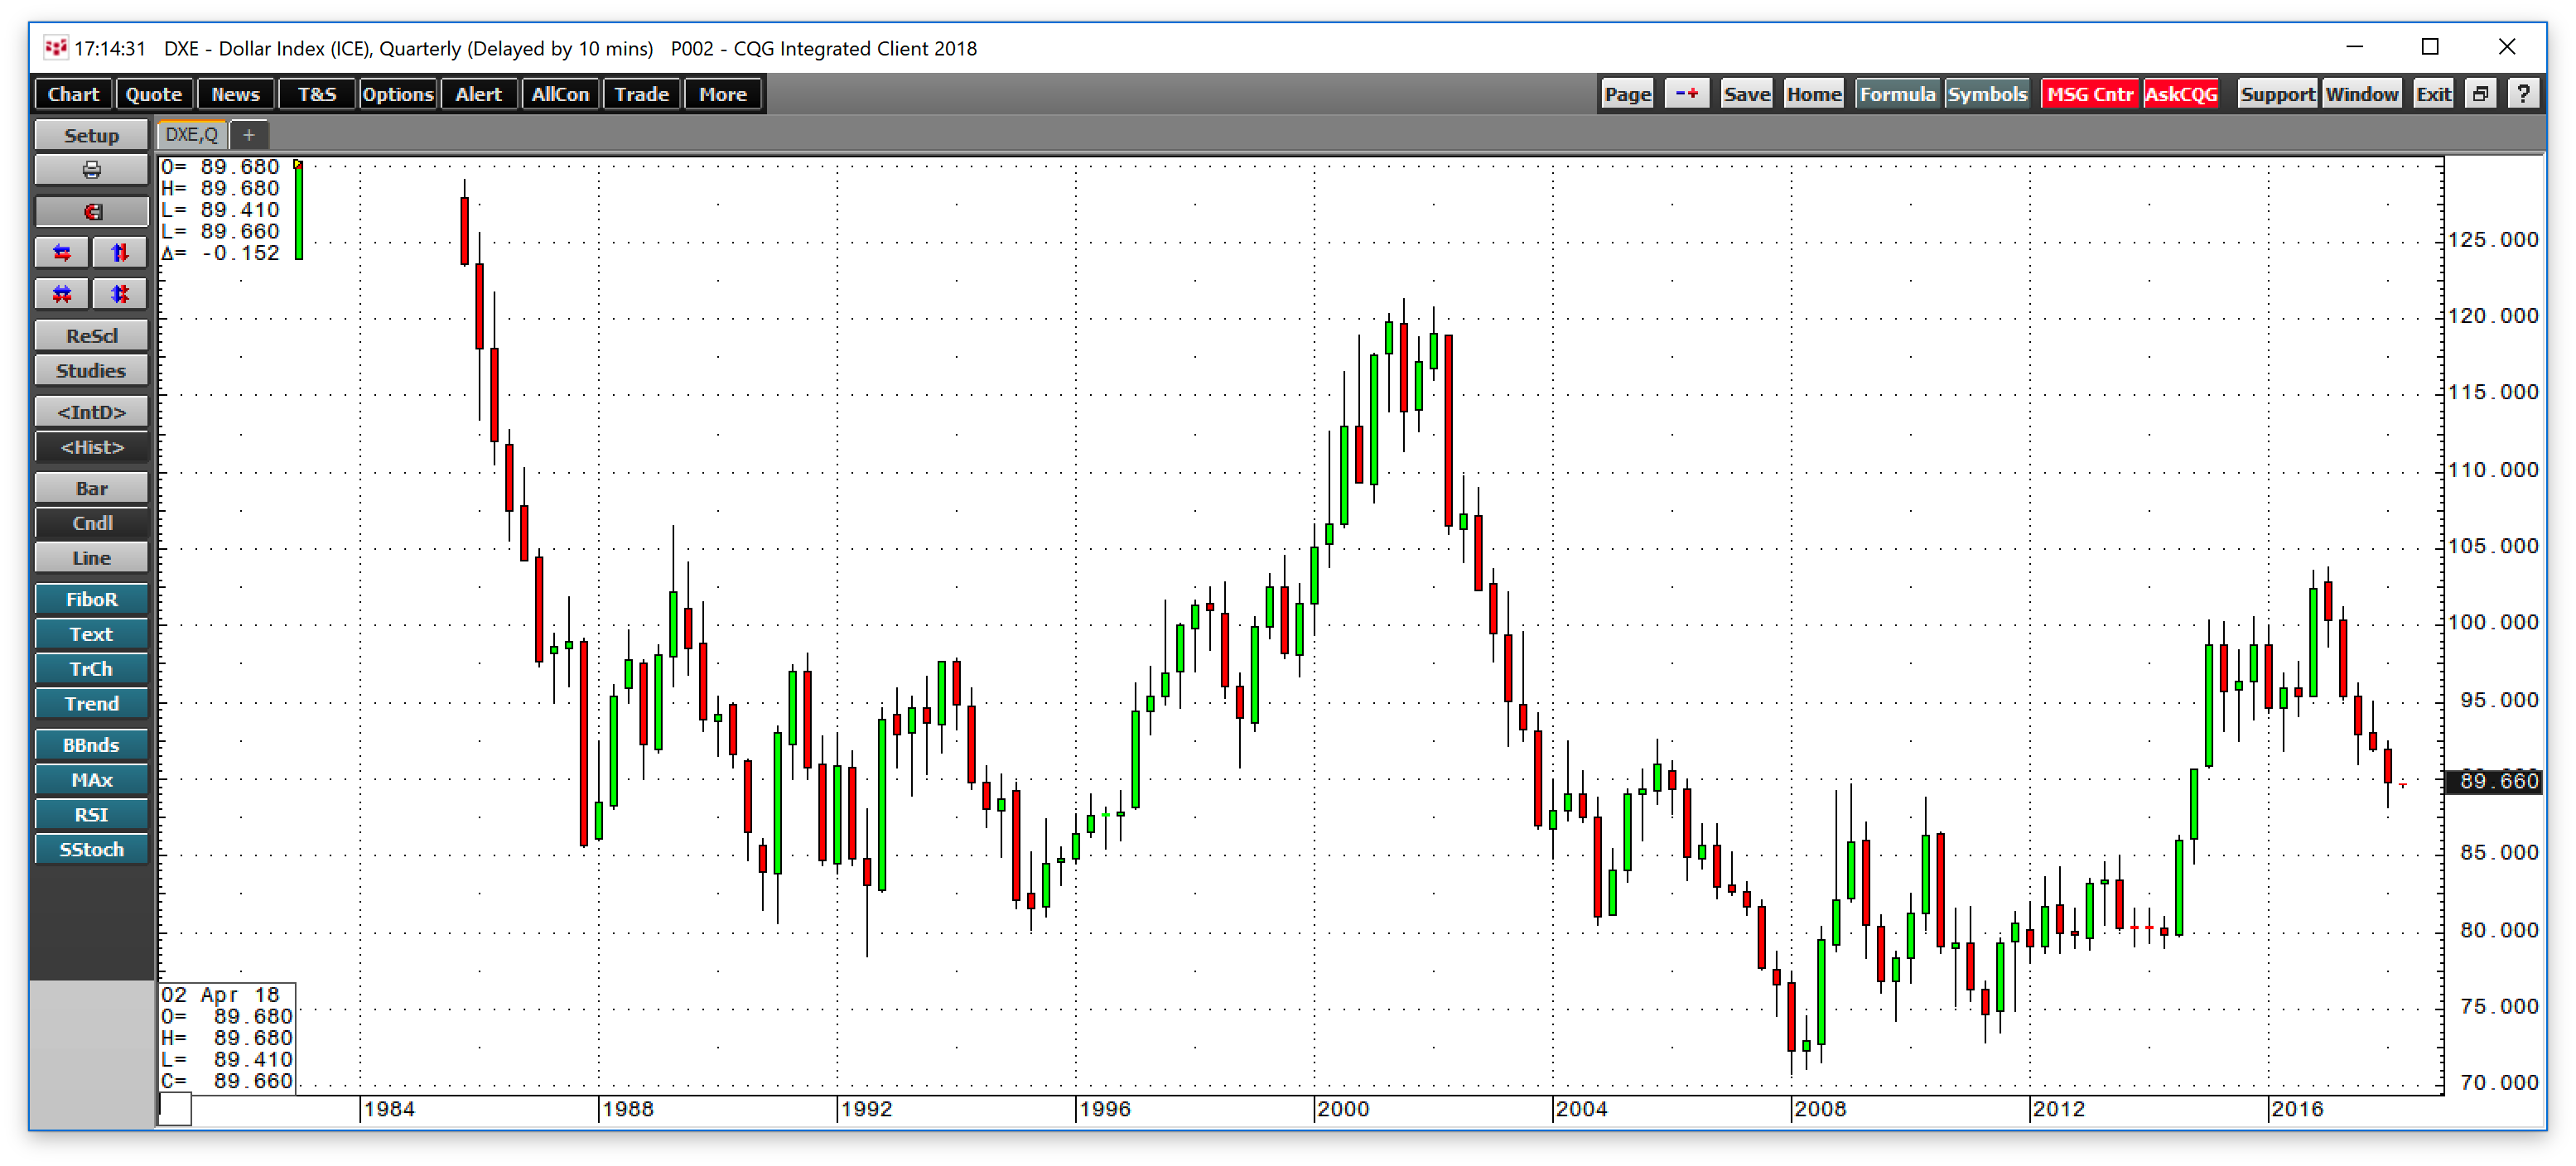
As the quarterly chart illustrates, if the greenback index repeats its trading pattern over the past thirty-three years, we could see it trend to the downside until 2024.
Prospects for Q2 – A Potential for Lots of Price Variance
As we head into the second quarter of 2018, commodities will look forward to the driving season in gasoline, the injection season in natural gas. At the same time, the 2018 crop year gets underway with the planting season for grain markets. On Memorial Day weekend, the grilling season, which is the peak time of the year for demand for animal proteins will commence.
Meanwhile, the US central bank will continue its gradual path towards tightening credit. And positive economic data could cause the FOMC to pick up the pace of rate hikes. In Q2, President Trump may meet with North Korean leader Kim Jong Un. OPEC will meet to discuss production policy at the end of the second quarter, but the Iran nuclear nonproliferation agreement is likely to take center stage during the coming weeks and months.
Mid-term elections in the US could exacerbate political divisions in the coming months. All of these issues, and more, are a prescription for increasing price variance in markets across all asset classes.
Commodities tend to be the most volatile asset class of all, and the current economic and geopolitical landscapes point to a continuation of price volatility that started in Q1. Volatility is an investor’s nightmare, but it is also a trader’s paradise as it tends to create myriad of opportunities.
All the best for Q2!