The best opportunities in commodities markets often occur when they are at the top or bottom of their cycles when it comes to supply and demand. Soft commodities can be one of the most volatile at times, as weather and crop diseases can alter market fundamentals in the blink of an eye. Two agricultural commodities are starting to show some signs of life after prolonged periods of selling. These days, I am focusing lots of attention on sugar and coffee. Both of these markets offer the potential for price gains with an attractive balance between risk and reward when it comes to technical indicators on a long-term basis.
The commodities pricing cycle
Commodities prices typically rise to levels where production increases, demand declines, and inventories build, which leads to a top or peak price for the raw material. One a high is in place, the price action typically declines over a period until it falls to a level where output declines, demand increases, and inventories decline, which leads to a bottom or floor price for the commodity. While subsidies, tariffs, and other exogenous factors can interfere with the classic economic model for price action, commodities often do a good job when it comes to reflecting economic theory.
When analyzing a commodity market to make assumptions and projections about the path of least resistance of its price it is always wise to remember the lessons learned in economics 101 about the pricing cycle. Short-term price action can be blinding in the volatile world of raw material markets. I always like to look for markets that are displaying signs that they are at a peak or bottom when it comes to their price cycle. I then incorporate technical analysis to determine entry and exit points when it comes to developing a plan that reflects a disciplined approach to risk and reward.
Sugar will be sweet again
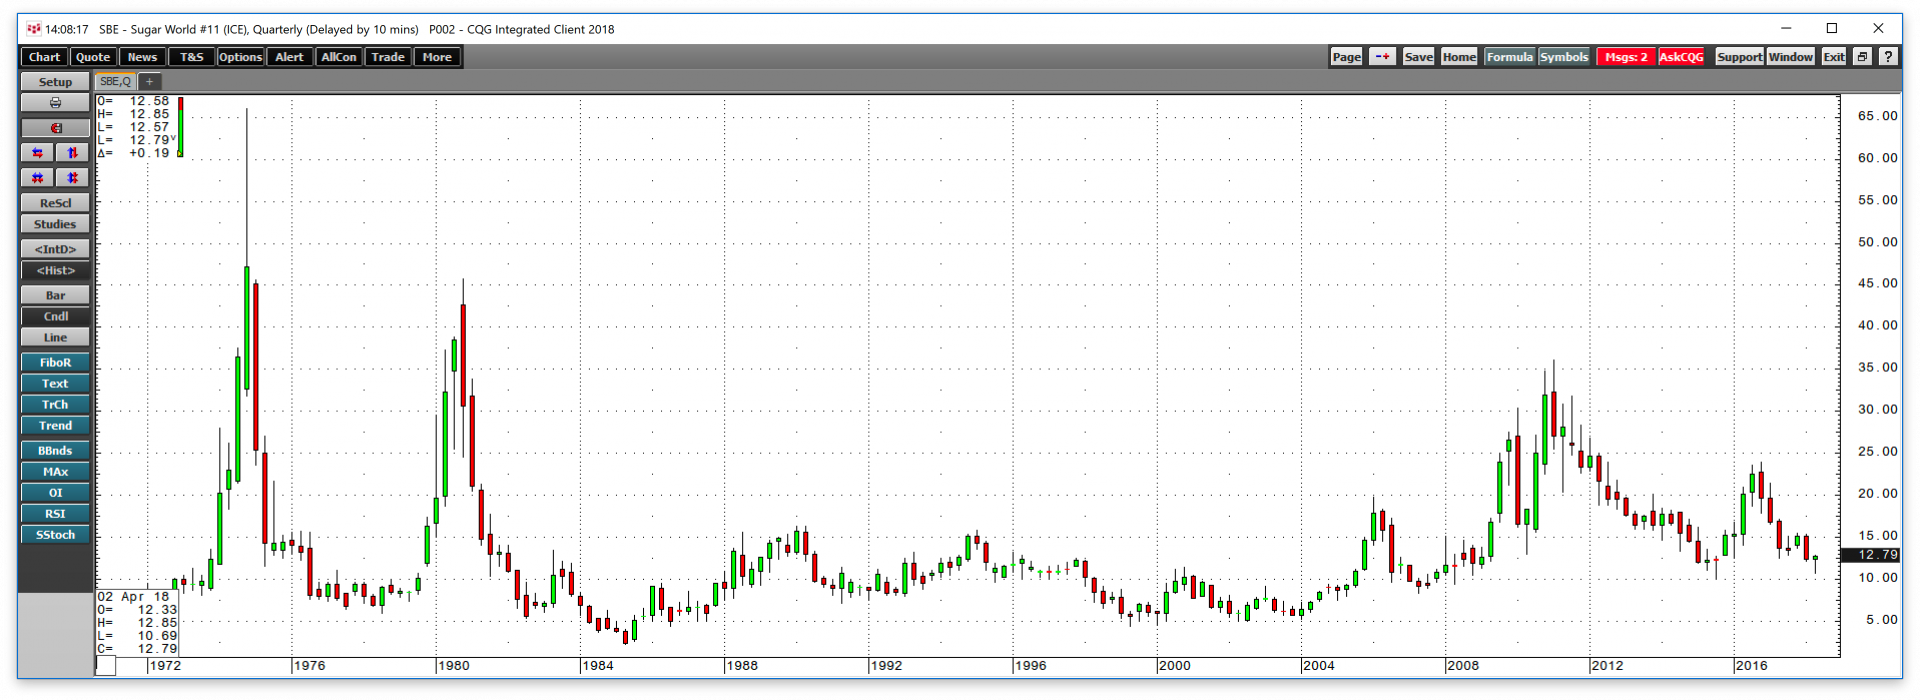
The sugar futures market that trades on the Intercontinental Exchange can be one of the most volatile of all of the agricultural commodities. Since the early 1970s, sugar futures have traded in a range from lows of 2.29 cents to highs of 66 cents per pound. Sugar routinely doubles and halves in prices, and since August 2015 the price moved from lows of 10.13 cents to highs of 23.90 cents in October 2016, and then back down to lows of 10.69 cents in April 2018. A deficit developed in the sugar market where demand outstripped supplies at the 2015 lows which led to a surplus at the October 2016 high. The most recent low at 10.69 cents likely influenced the behavior of the supply and demand side of the fundamental equation for the sweet commodity, if history is a guide. Sugar fell to only 0.56 cents above its 2015 bottom, on news of abundant supplies from India and Brazil, two of the world’s leading producers of sugar cane.
A long-term pattern of higher lows
Commodities markets typically move dramatically higher or lower when a supply shock hits the market that thrusts it into a deficit or glut conditions. However, the impact of demand on prices can be a slow and steady process. In the sugar market, the price trend for over three-decade points to increasing demand’s effect on prices even during periods where supplies are ample, and there is a condition of oversupply.
As the quarterly chart highlights, sugar has been making higher lows from a long-term perspective since way back in 1985 when the price hit bottom at 2.29 cents per pound. The next significant low came in the second quarter of 1999 at 4.36 cents, and in Q2 of 2002, the low was at 4.97 cents. In Q2 if 2007, sugar put in its next nadir at 8.36 cents, with the next low coming in Q3 2015 at 10.13 cents. To keep the pattern of higher lows intact, the sweet commodity must hold that level, and in April of this year, sugar fell to 10.69 cents and bounced from that level. Sugar has a habit of recovering dramatically from lows, and at 12.79 cents on May 31, it still may have a way to go on the upside. History could be telling us that sugar reached the bottom of its price cycle and now will work its way back to a top.
Coffee will percolate on the upside
Like sugar, the evidence points to a similar fundamental situation in the coffee market that trades on the ICE futures exchange.
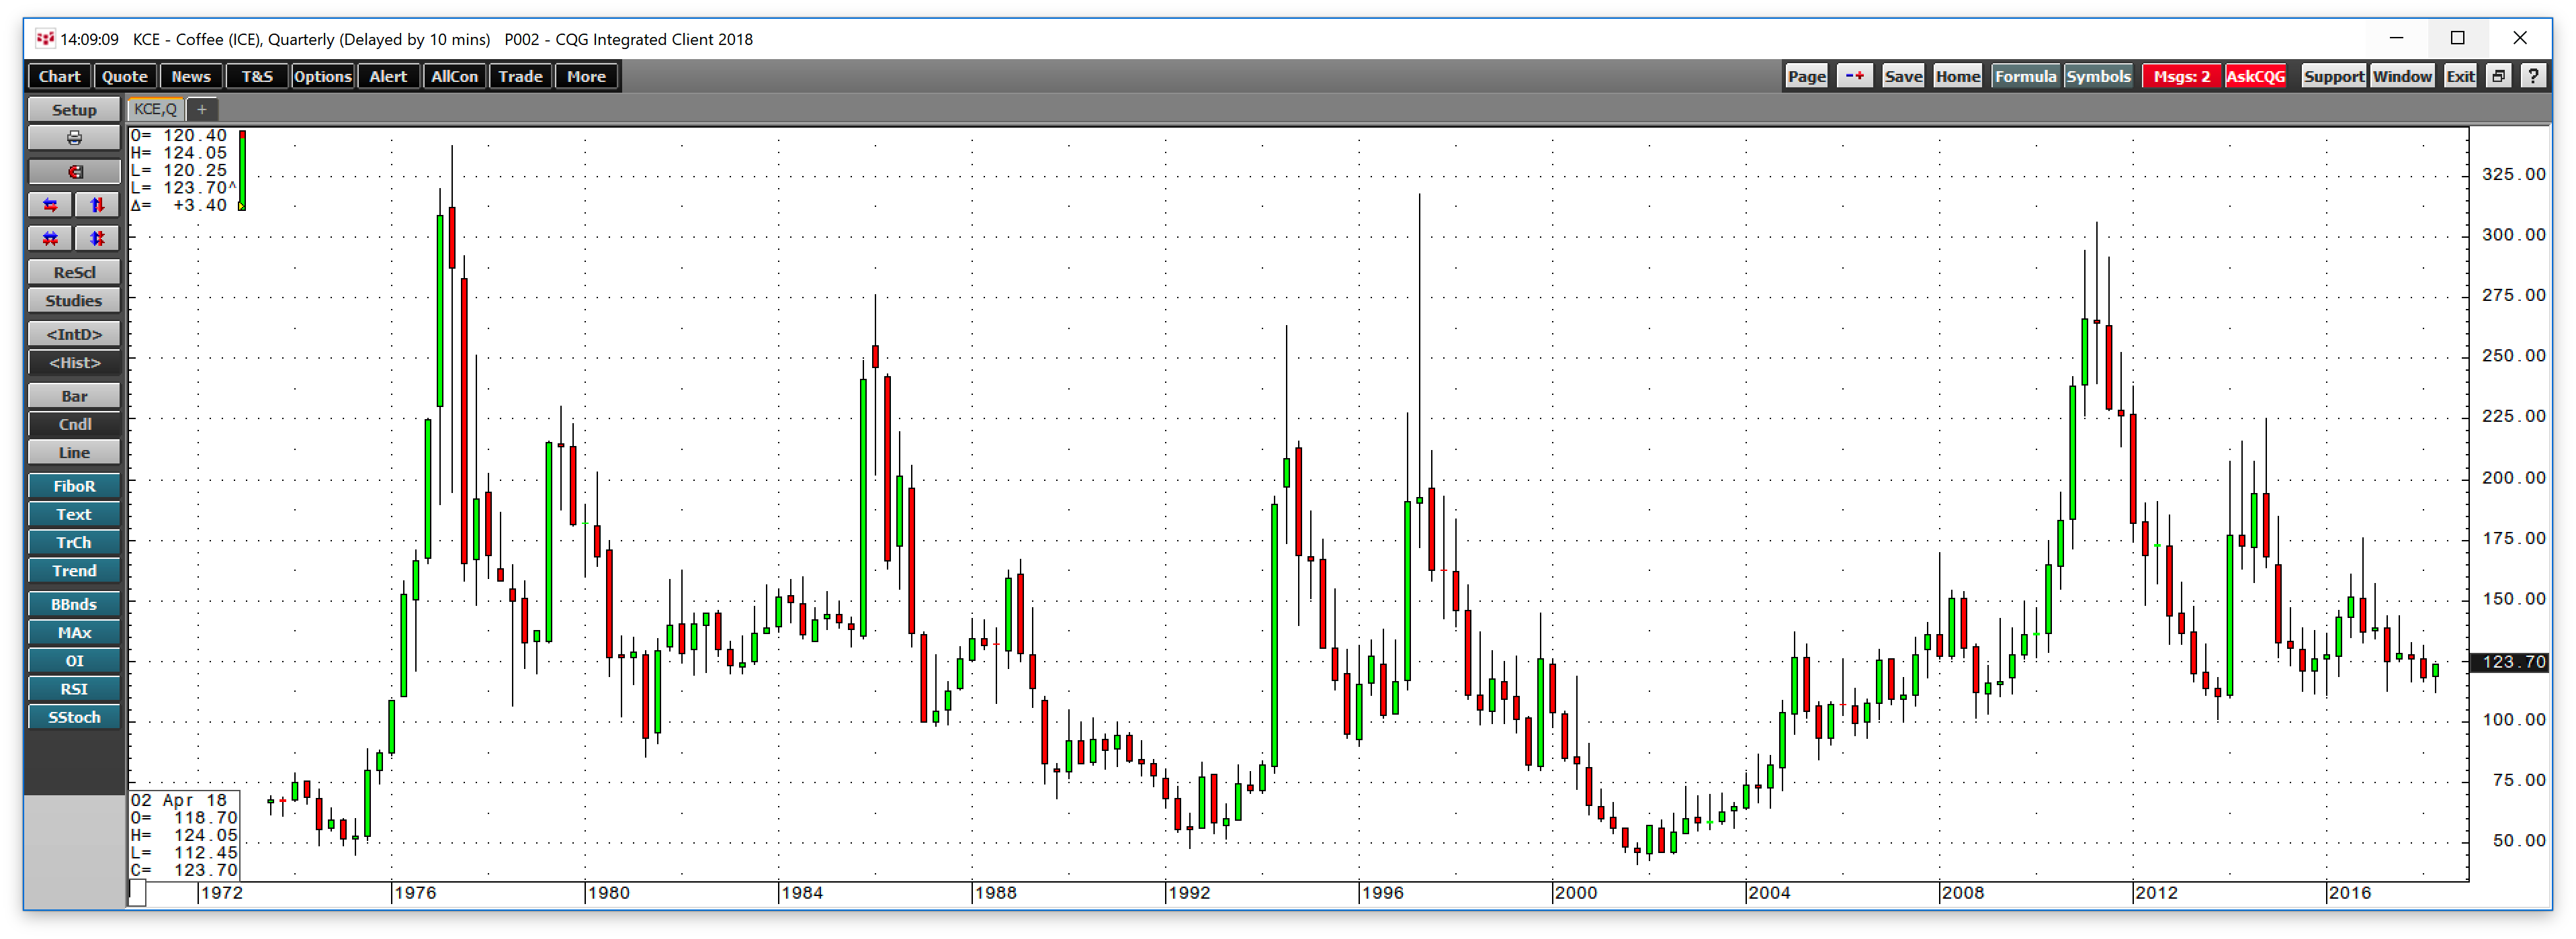
The quarterly chart of the nearby coffee futures contract shows that it has been making a series of higher lows since 2001 when the price fell to 41.5 cents per pound. The last time coffee trades below the $1 per pound level was back in 2006, a dozen years ago. Over the period, the price has been as high as $3.0625.
With coffee trading at the $1.2370 level at the end of May, it is a lot closer to a low than a high, and it is likely that it is close to the bottom end of its pricing cycle. Therefore, risk-reward favors the upside based on historical prices and patterns for over a decade.
Demographics are constant and the fickle nature of supplies
In all agricultural commodities, the demand side of the equation has been a reflection of demographics. In 2000, there were six billion people on the earth. In May 2018, that number stood at 7.476 billion and growing. Each quarter the world adds approximately 19 million more mouths to feed, and like many other agricultural products, sugar is a staple ingredient in a myriad of foods. Therefore, the addressable market for sugar and coffee consumption has displayed constant growth which has been exponential. With wealth increasing on our planet, more people, with more money are competing for finite agricultural products each day, and sugar and coffee are not exceptions.
Therefore, the risk-reward picture for both sugar and coffee is looking very attractive these days. While it could take a while for sugar to become sweet and coffee to percolate on the upside again, buying at close to lows in the pricing cycle is a limited risk strategy that can offer excellent rewards.

