The dollar index moved higher by 5.05% in the second quarter of 2018, but commodities prices managed to post gains with four of the six major sectors moving to the upside.
Out of the 29 commodities that I follow, 15 posted gains and 14 losses during the three-month period that ended last Friday, June 29. The composite gained 3.61% in Q2 and was 2.28% higher over the first six months of 2018. Last year, it moved 7.95% higher. There was lots of price action in the raw material futures markets as trade issues, and the OPEC meeting in late June dominated the news over recent weeks.
Animal proteins and energy lead the way on the upside in Q2
During the period from April 1, 2018, through June 29, 2018, the animal protein sector was the big winner in the commodities asset class. Lean hogs posted a 44.76% gain for the three-month period, and the sector composite moved 17.44% higher. The sector rallied despite the trade issues which could weigh on U.S. exports of beef and pork. However, the price performance of hog futures was mostly the result of contract rolls going into the peak season of demand during the period.
The second best performing sector was energy, which gained 8.21% for the three-month period. Both Brent and WTI crude oil moved over 14% higher with gains coming in the wake of the June OPEC meeting where the oil ministers decided to increase production less than the market had expected.
Soft commodities moved 1.66% higher in Q2 with gains in FCOJ and cotton which traded to highs of 96.50 cents per pound during Q2. Base metals climbed only 0.11% with nickel and aluminum moving to the upside.
Several commodities moved higher by over 10% in Q2 including crude oil, nickel, CBOT wheat, oats, frozen concentrated orange juice, feeder cattle, lumber, and lean hogs.
There were lots of losers in Q2 as some commodities are ground zero for the tariff issue
The biggest loser in Q2 was the precious metals sector that declined by 3.37% over the three month period. Precious metals fell led by losses in platinum and gold. The price of silver also moved lower over the period. The grain sector moved 2.38% to the downside with losses in soybeans and soybean products, corn, MGE wheat, and rice.
The biggest loser during Q1 was the soybean market which fell by 17.83% over the three-month period.
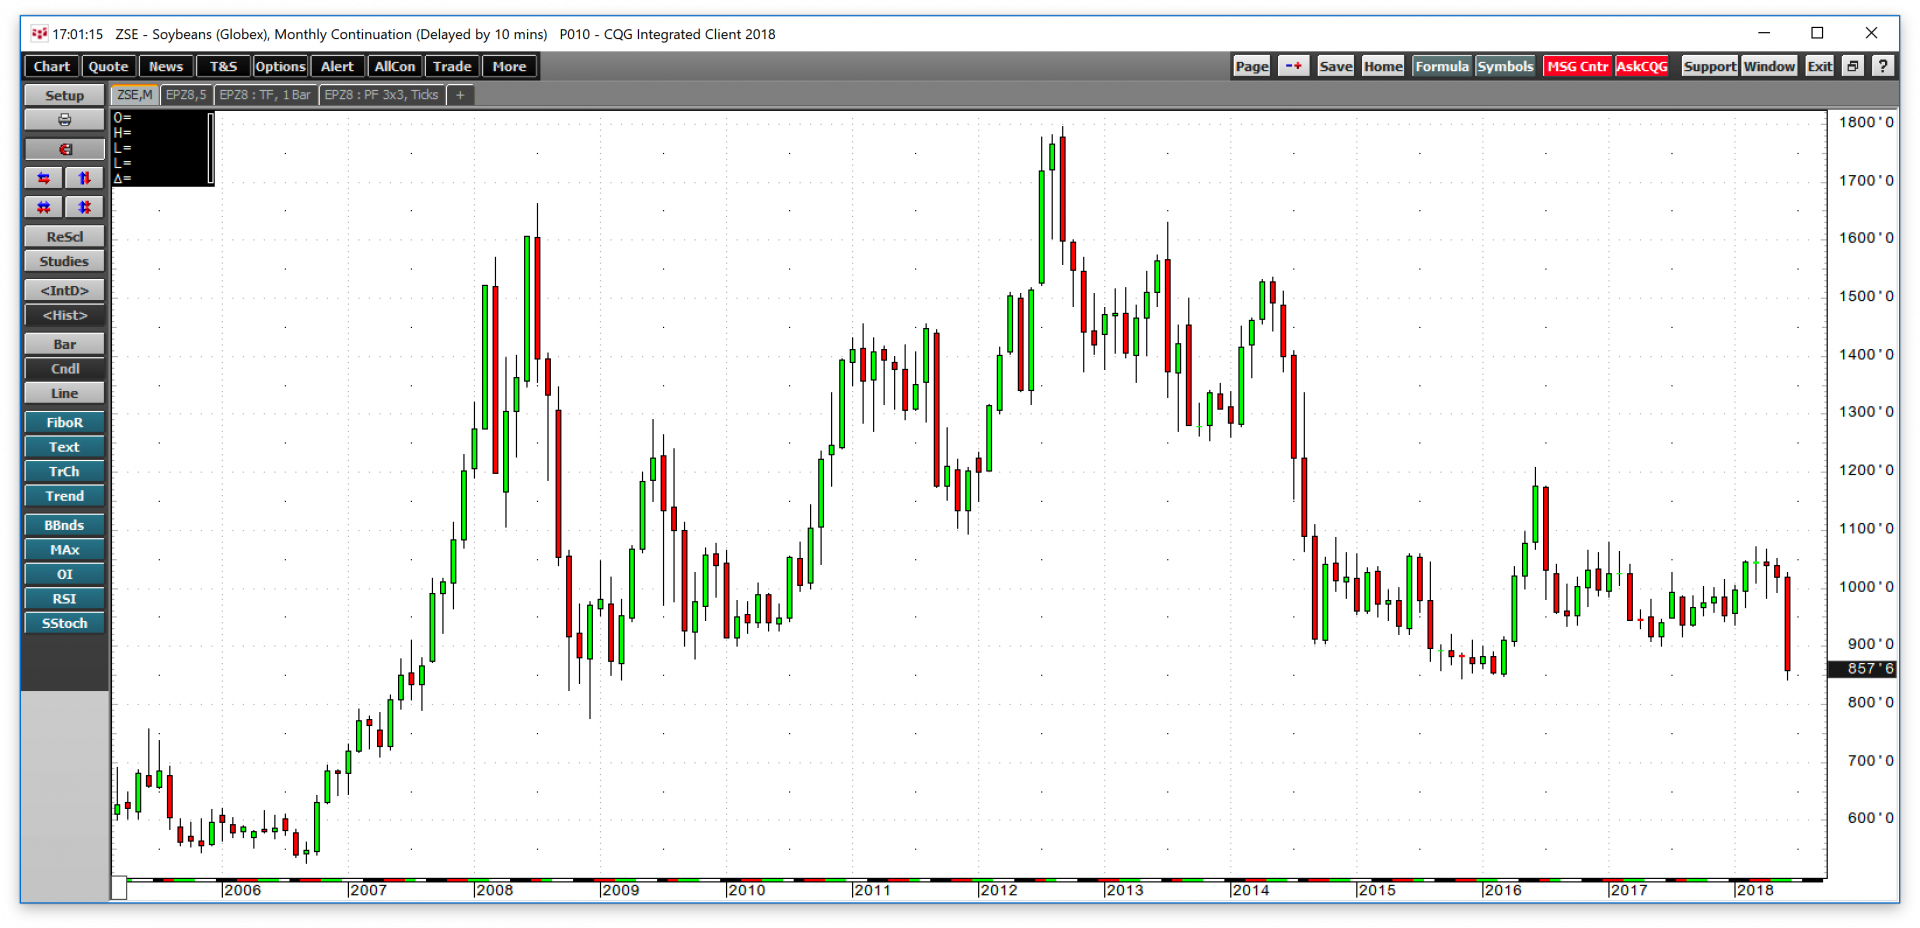
As the monthly chart highlights, CBOT soybeans dropped to their lowest price in almost a decade in June when they hit $8.4150 per bushel on the back of the ongoing international trade saga.
The price of soybeans fell dramatically at the end of Q2. China typically purchases one-quarter of the annual oilseed crop from the United States. Without exports to China, the chances of a glut in the bean market increase dramatically, especially if the 2018 crop is at the same level or higher than it was over the past half-decade. Soybeans turned out to be a market that was ground zero when it comes to tariffs and retaliation between the U.S. and China.
While eight commodities moved higher by over 10% in Q2, three posted double-digit percentage losses including soybeans, soybean meal, and zinc.
In the energy sector, oil products underperformed crude oil. Gasoline and heating oil processing spreads moved 20.88% and 9.33% lower respectively compared to their closing levels at the end of Q1.
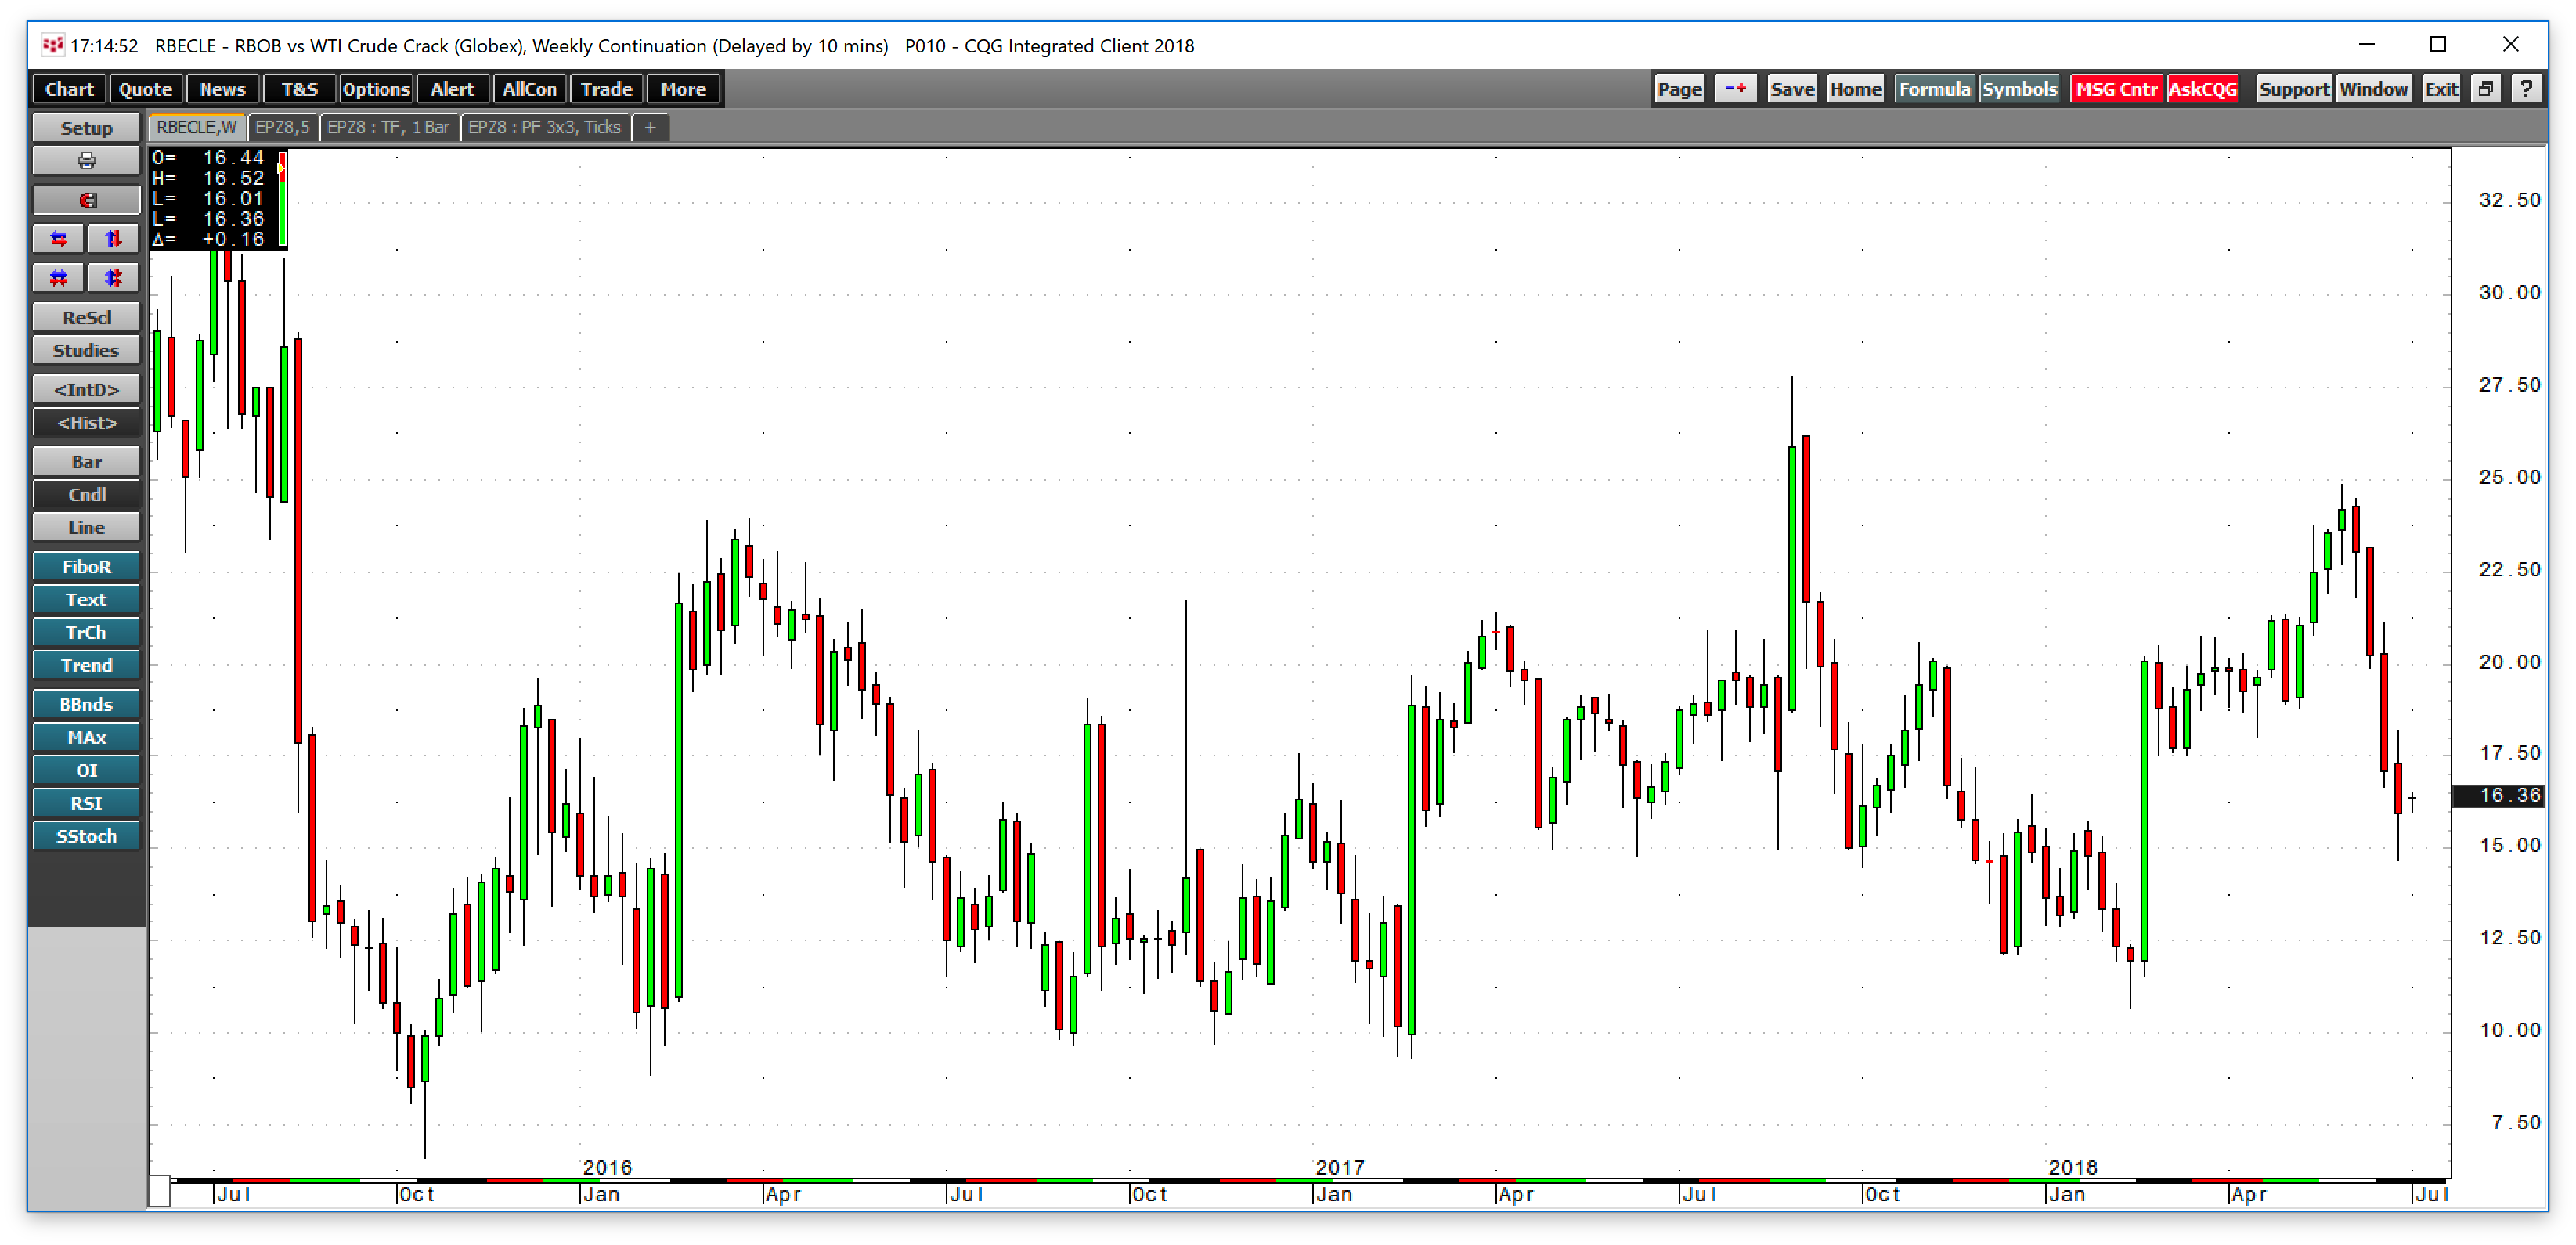
Gasoline cracks moved from $19.92 per barrel at the end of Q1 to settle at the $15.76 level on June 29.
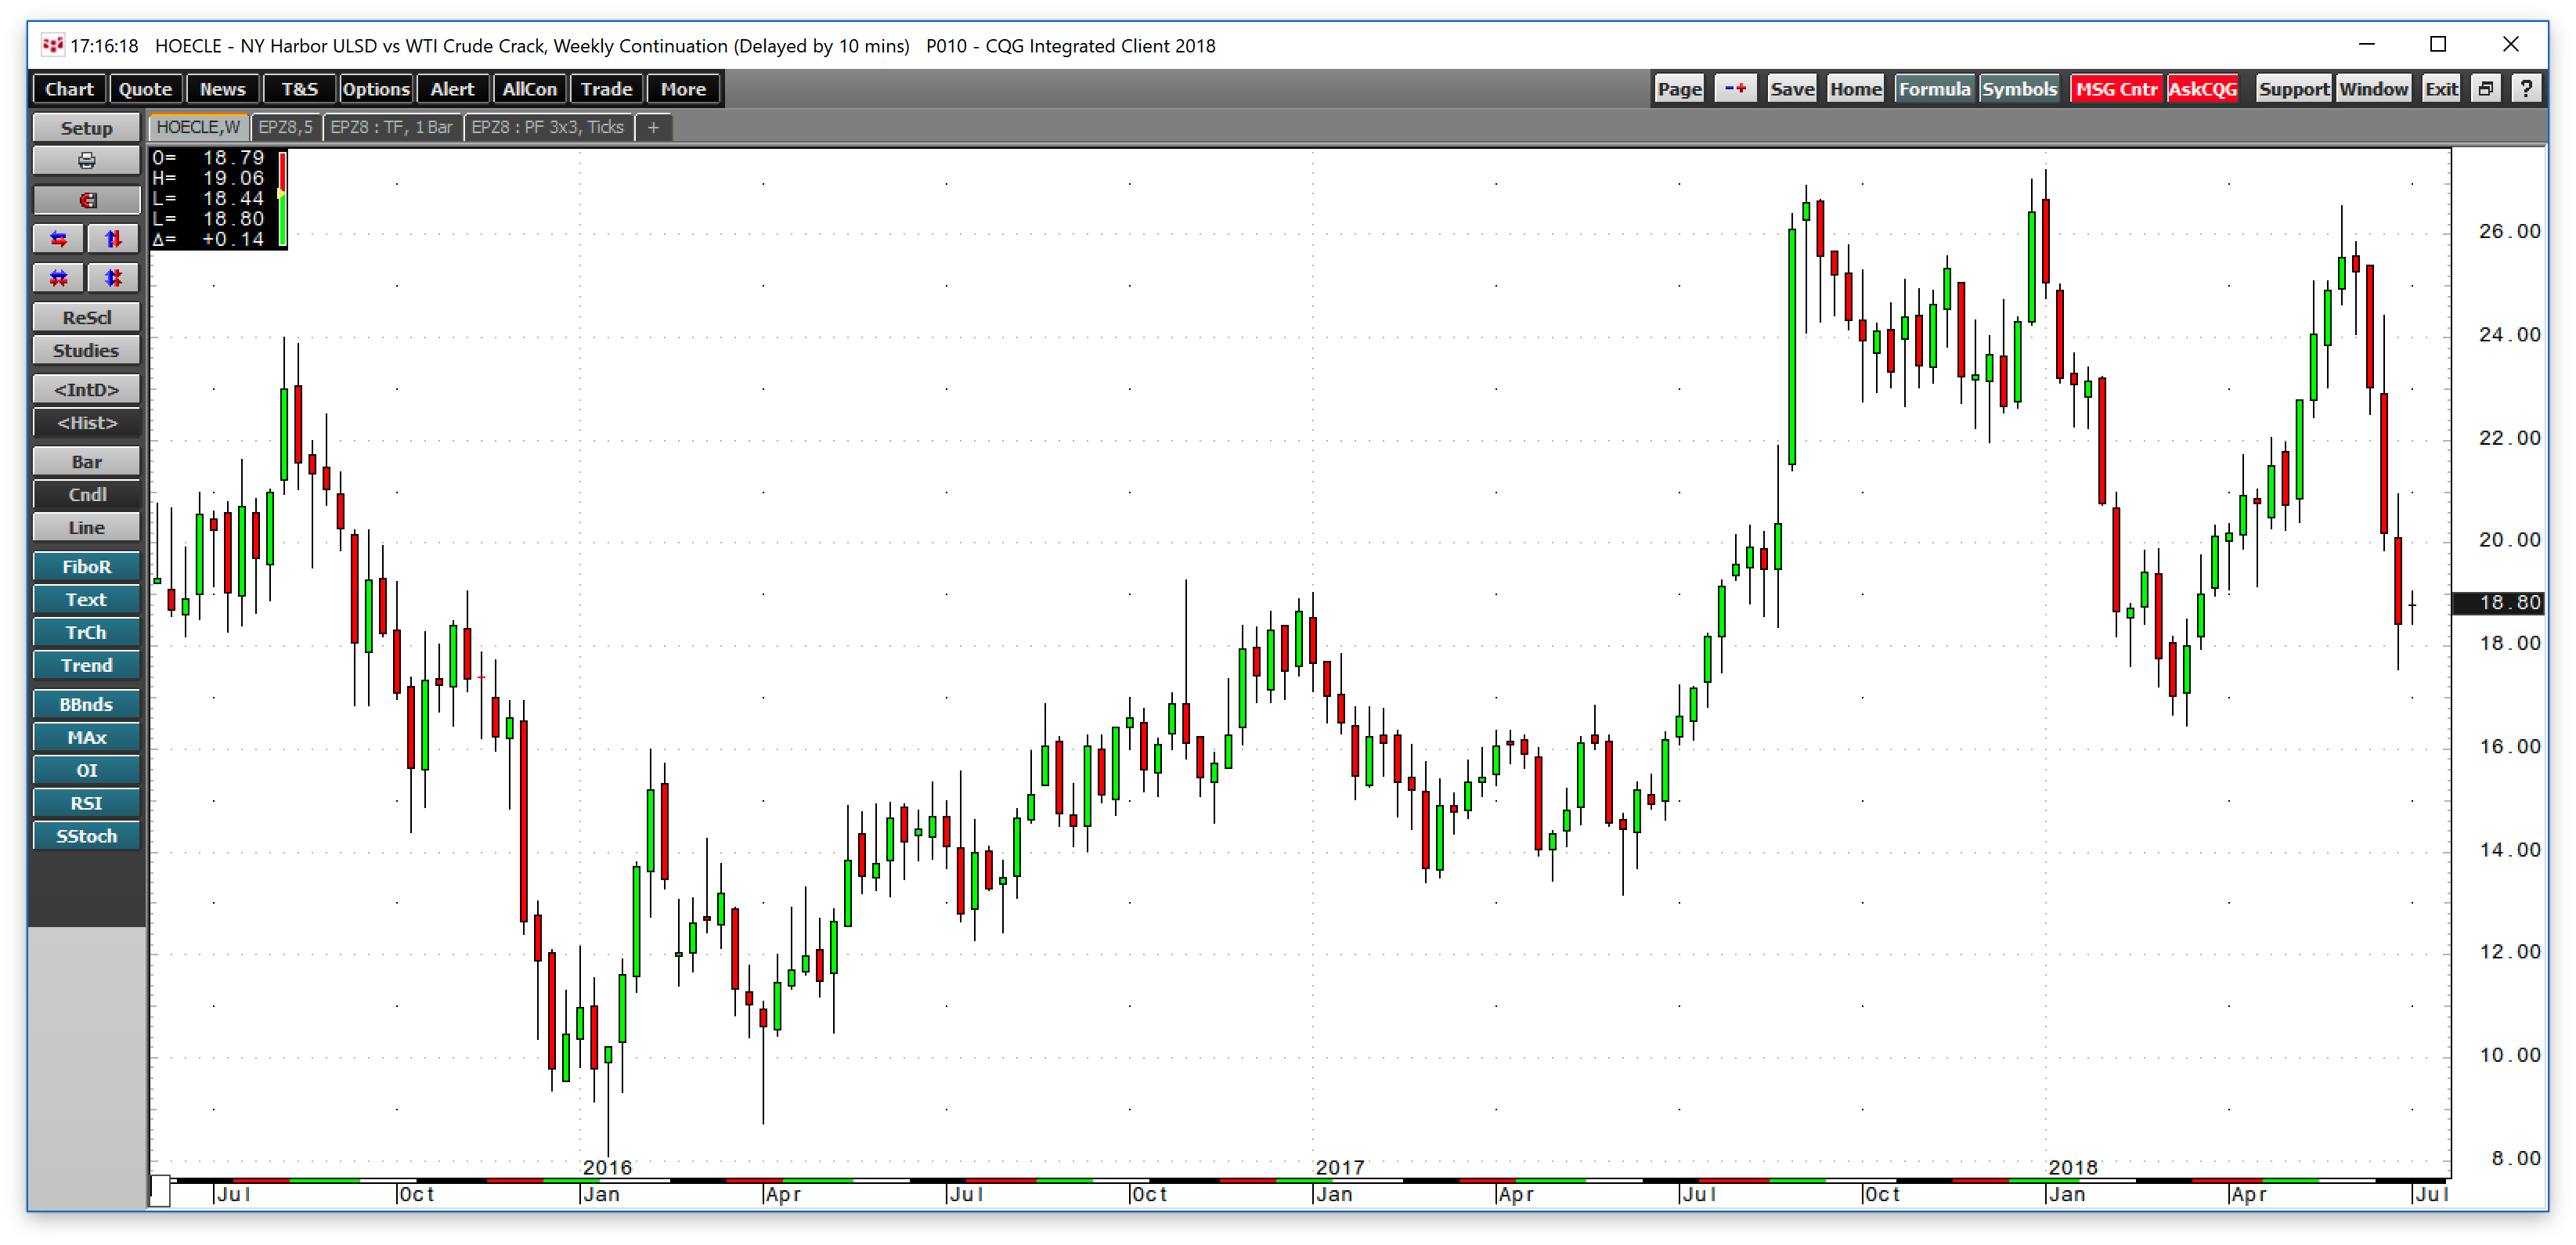
Heating oil or distillate cracks moved from $20.14 per barrel at the end of Q1 to settle at the $18.26 level on June 29. The decline in the processing spreads is a warning sign for the profits of refining companies as we head into the second half of 2018.
The CFTC defined digital currencies as commodities, and this asset class continued to slide in Q2. The cryptocurrency asset class that was all the rage in 2017 continued lower over the past three months with Bitcoin falling 12.21%, and many other of the digital currencies posting double-digit percentage losses. The market cap of the asset class as a whole moved from $255.3 billion to $235.9 billion, down 7.59% for the three-month period. And a whopping 61.66% since the end of 2017. One of the exceptions in Q2 was Ethereum which posted a 9.41% gain on the quarter, but it was still down over 45% in the first six months of 2018.
Q2 Highlights – A bounce in the dollar index
The U.S. dollar is a significant factor when it comes to commodity prices as it tends to have an inverse value relationship with raw material prices. The dollar index turned higher and posted a 5.05% gain over the quarter and was 2.75% higher for the first half of this year after falling 10.23% in 2017. The dollar found support from the widening interest rate gap with the euro and other currencies as a more hawkish Fed is picking up the pace of rate hikes while the ECB and BOJ leave short-term rates in negative territory.
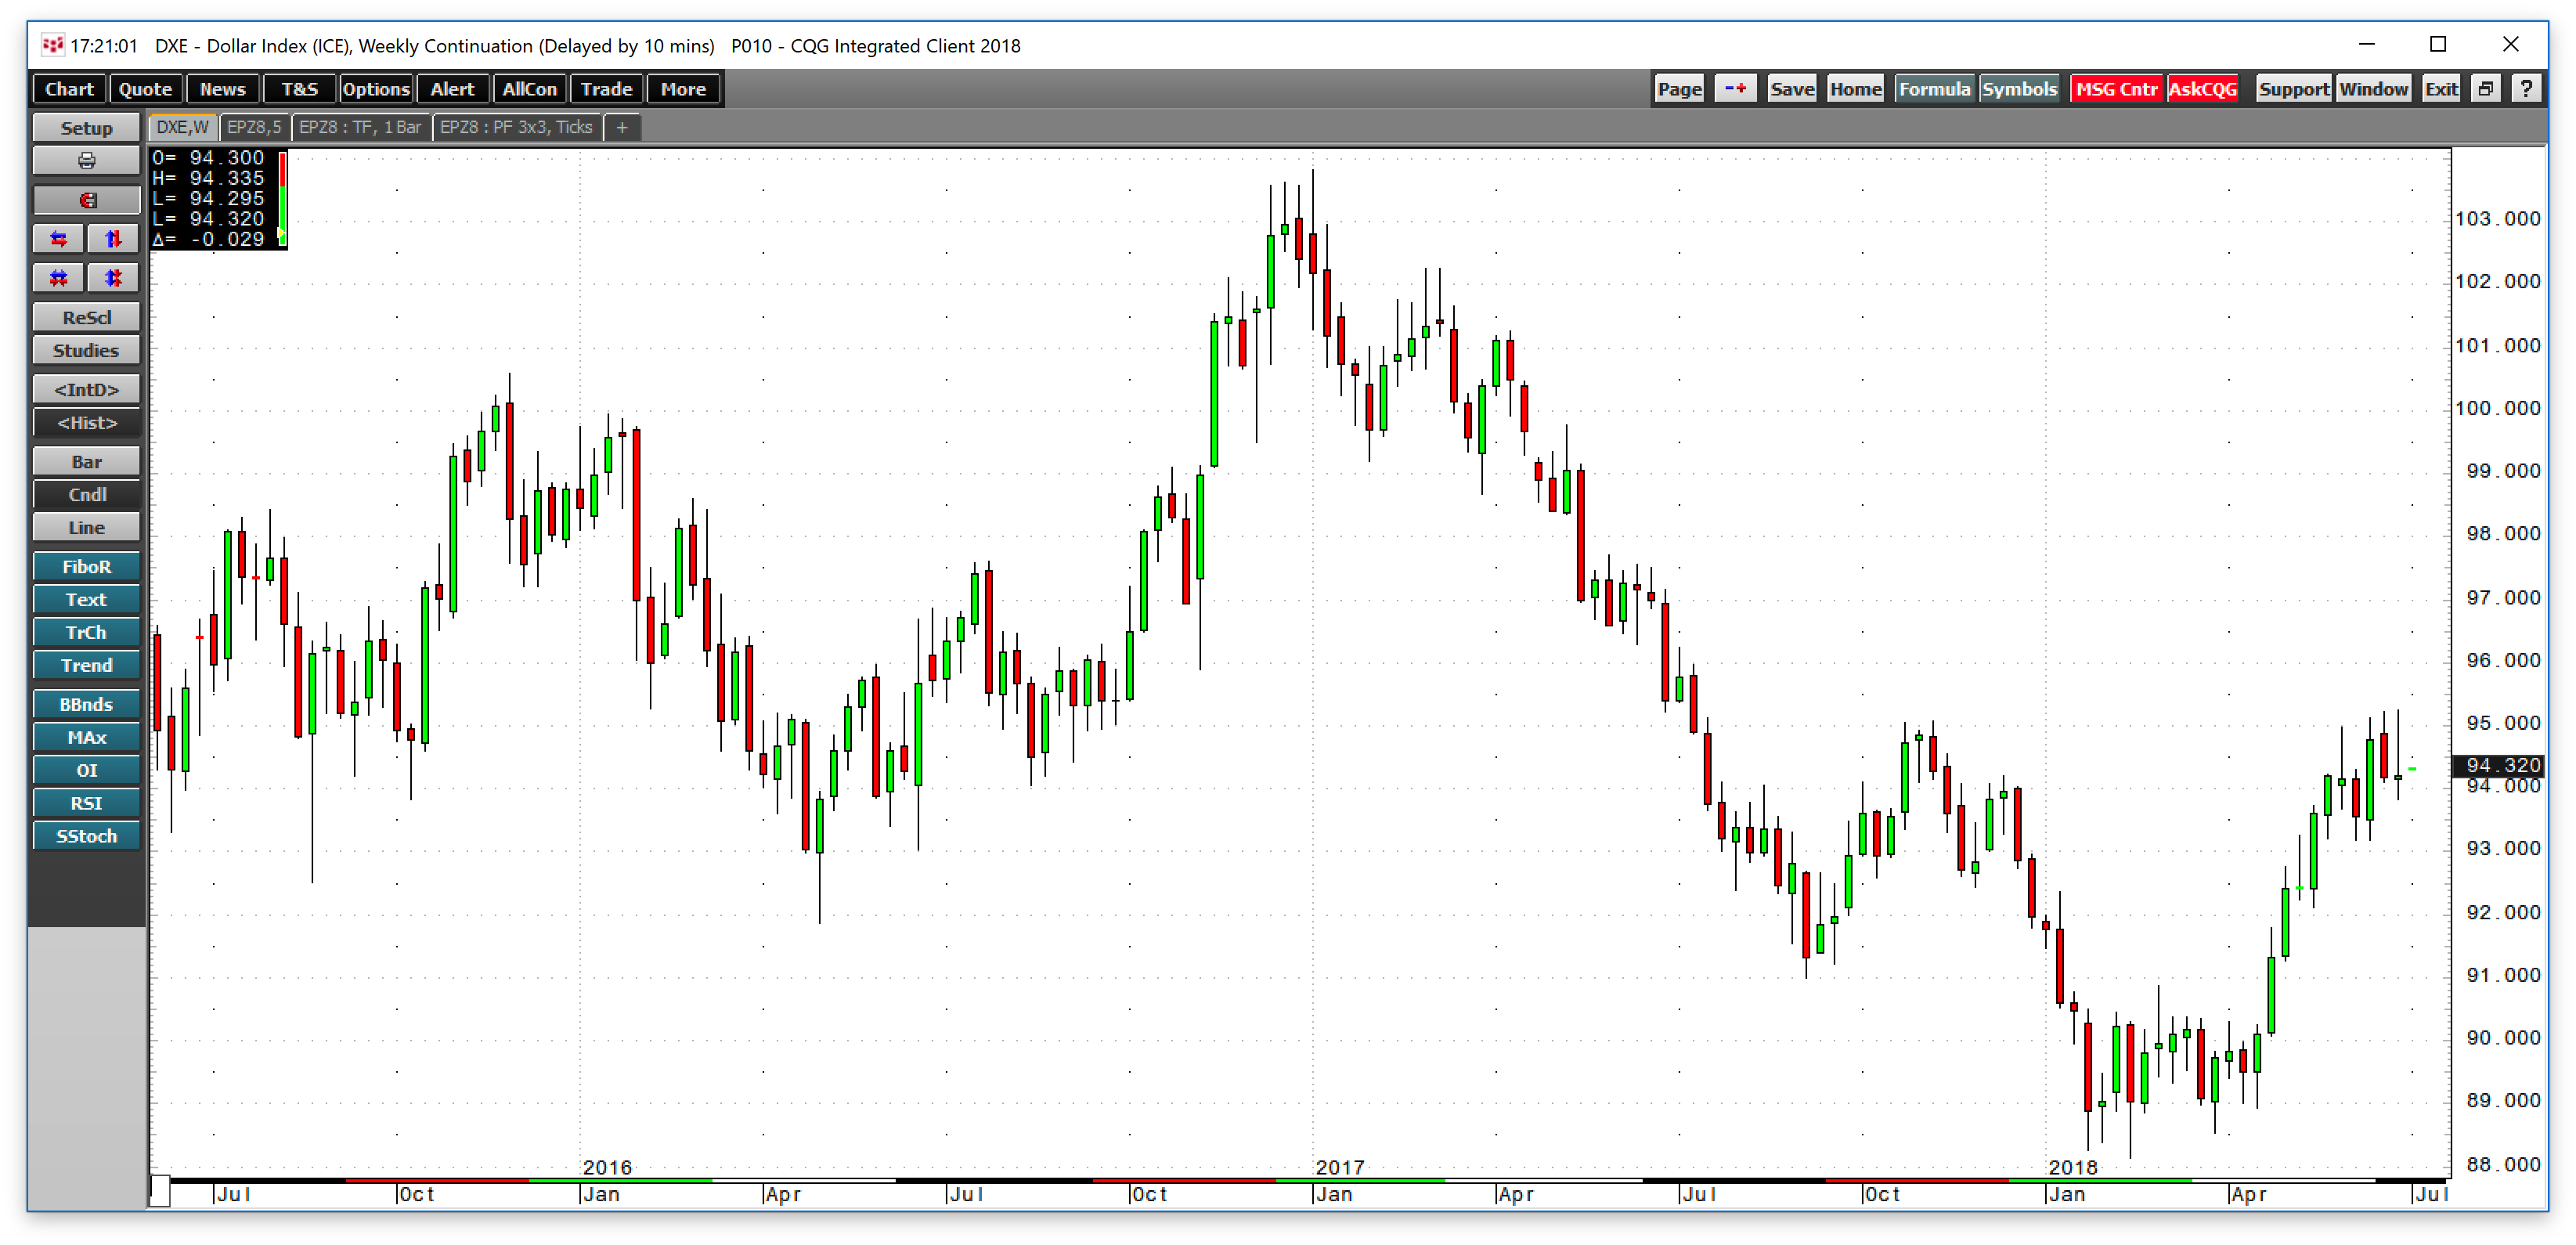
As the weekly chart of the dollar index shows, the greenback staged an impressive recovery which weighed on the prices of precious metals in Q2.
The Fed hiked rates by 25 basis points at their June meeting telling markets to expect at least two more increases before the end of this year, which will bring the Fed Funds rate to 2.25-2.50% by the end of 2018. The Fed led by Jerome Powell told markets they would take a “symmetric” approach to inflation meaning that they will allow the rate of the economic condition that eats away at the value of money rise to over 2% at times to encourage economic growth. However, the stronger dollar is a warning sign for the second half of 2018 in the world of commodities.
Prospects for Q3 – Lots of issues facing markets could cause high volatility in markets across all asset classes
As we head into the third quarter of 2018, the path of least resistance for grain markets will be a function of both the weather and trade issues that could impact U.S. exports. Animal proteins and industrial commodities will take their cues from the rhetoric surrounding international trade and the potential for new trade agreements or a trade war.
Energy markets will focus on inventory data, economic growth, and the turbulent Middle East. On June 30, President Trump asked the King of Saudi Arabia to increase production, which could weigh on the price of oil. Precious metals will be watching the dollar and interest rates. Gold moved to its lowest level of 2018 at the end of June and is threatening to challenge a level of critical support on the weekly chart.
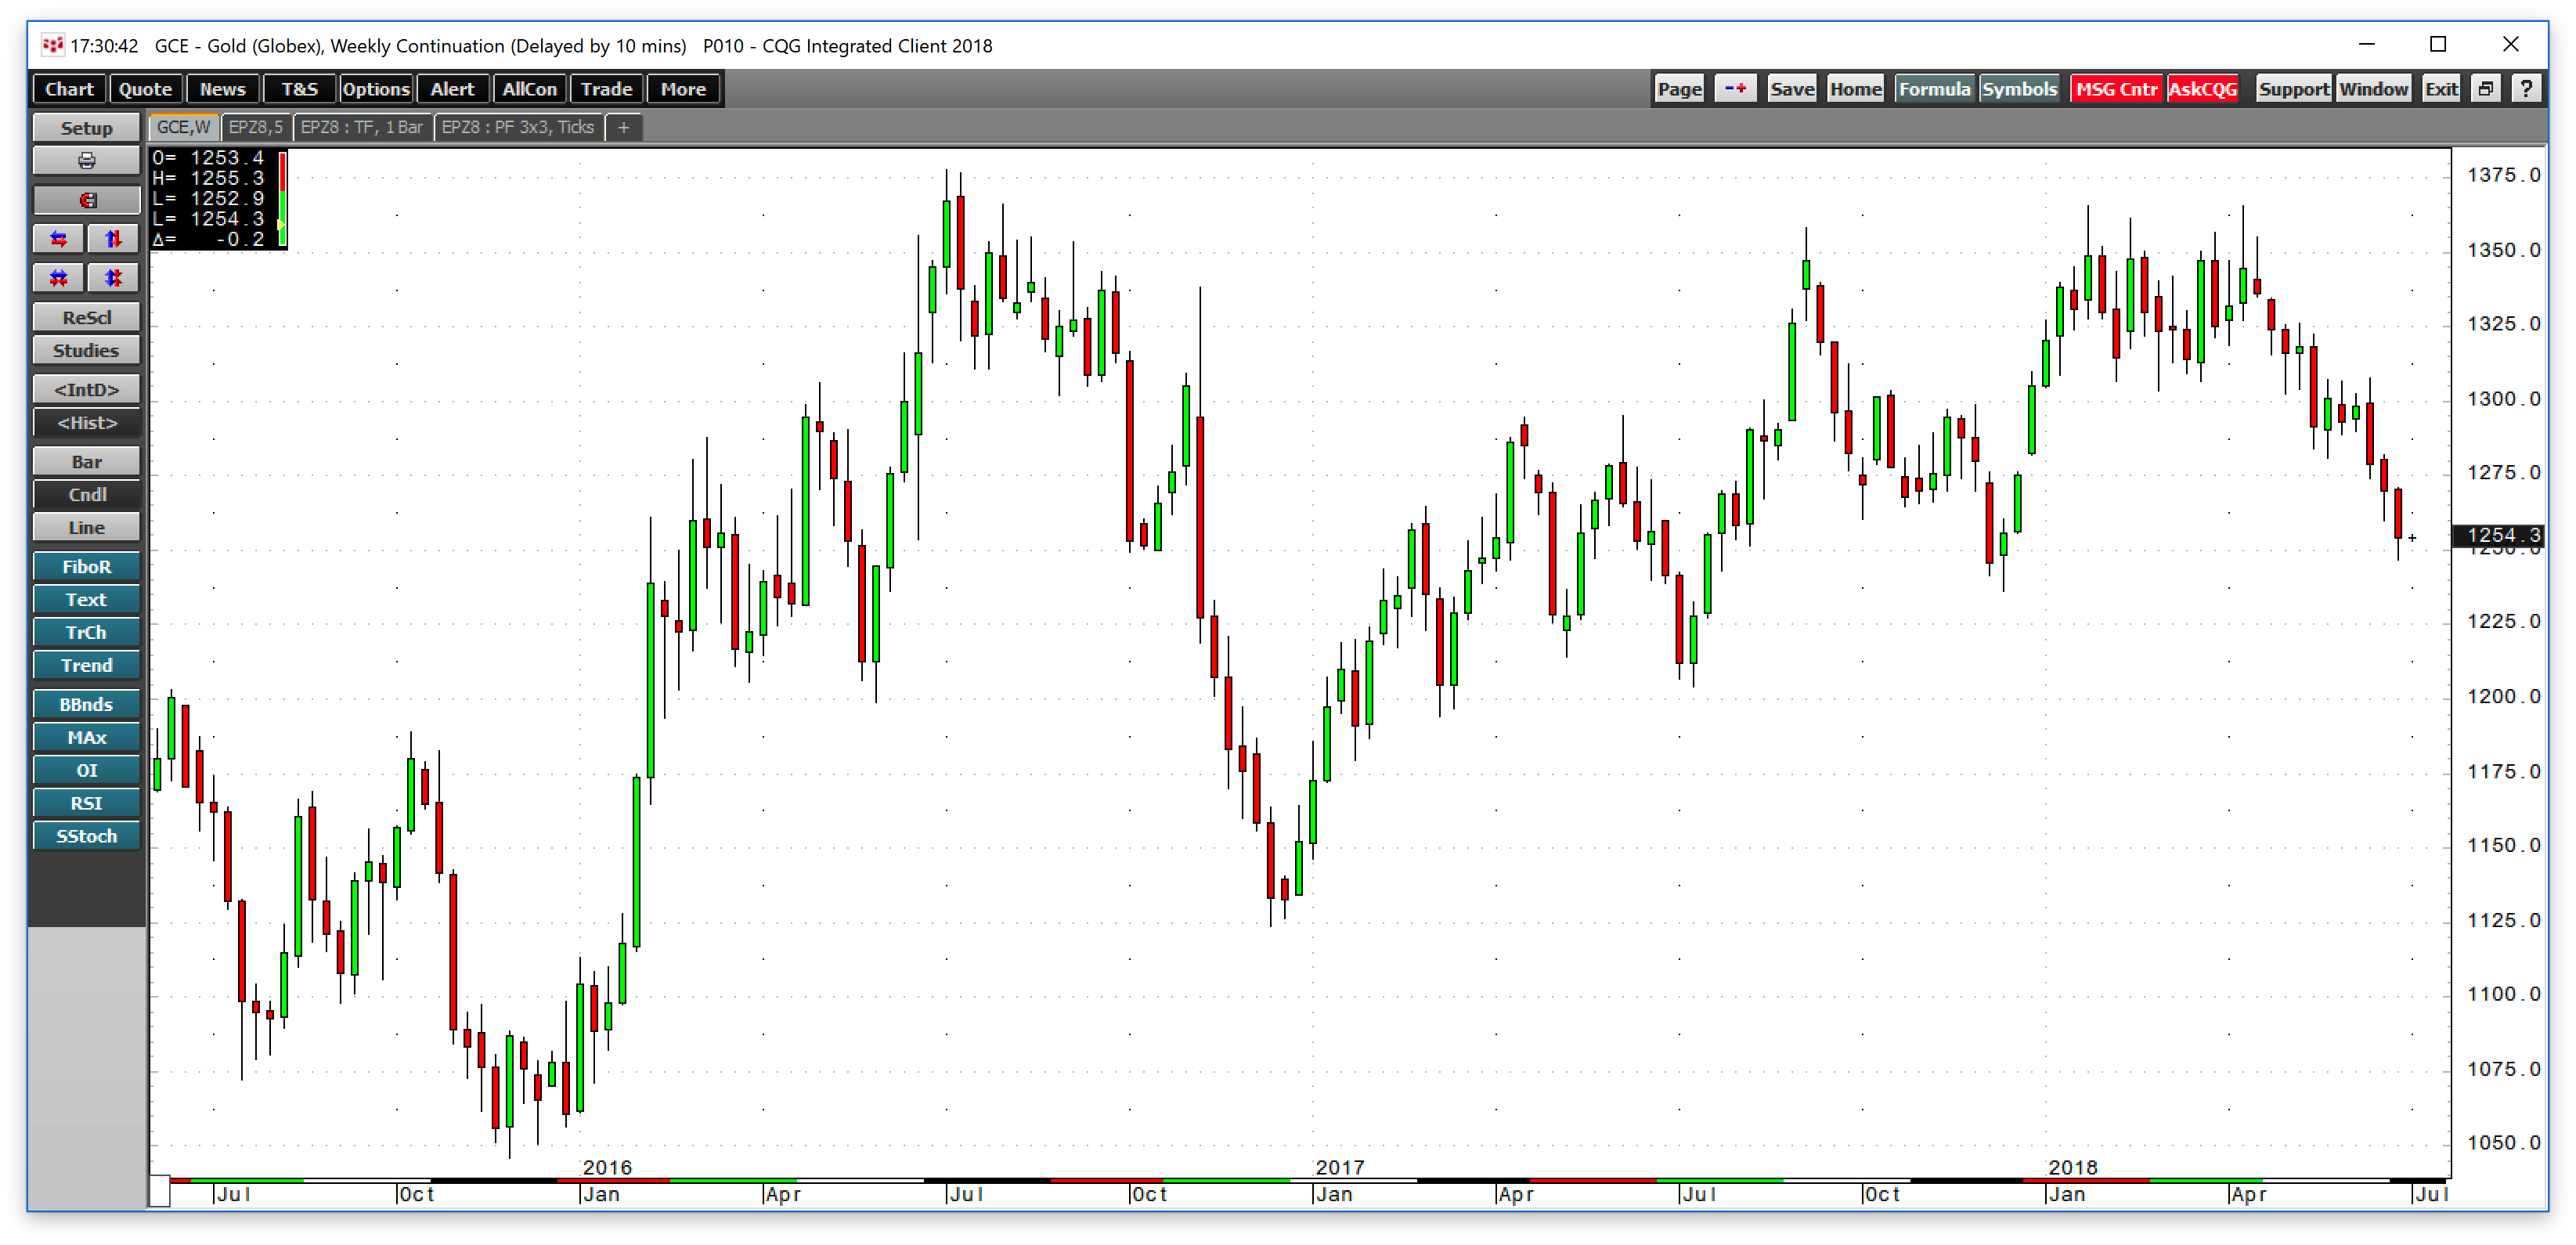
As the chart shows, the recent price action is threatening the bullish pattern of higher lows in the gold market that dates back to late 2015. A decline below last December’s low at $1236.50 per ounce on the nearby COMEX futures contract would negate that pattern.
When it comes to the commodities futures market, there are so many issues on the economic and political landscape, as well as supply and demand fundamentals, that are likely to fuel volatility in the second half of 2018. Volatility may be an investor’s nightmare, but it is a paradise for nimble disciplined traders who approach markets with a logical risk-reward profile.
All the best for Q3!