February 2019 was an excellent month for the prices of two high-profile metals that trade on the futures exchanges. Gold is a metal that has many roles. The yellow metal is a go-to favorite when it comes to jewelry, and its resistance to heat and ability to conduct electricity provide for its many industrial applications. However, gold is also the oldest form of money in the world. Central banks all over the globe hold gold as part of the foreign currency reserves. Gold is a symbol of wealth, a store of value, and a barometer of inflation, fear, and uncertainty in markets. The gold futures market on the COMEX division of the Chicago Mercantile Exchange is one of the most liquid futures contracts in the world.
Copper is an industrial metal that tends to be a barometer for economic growth or contraction around the world. Copper is the leader of the pack when it comes to the other nonferrous metals that trade on the London Metals Exchange. While the LME copper contract is for forward delivery, the COMEX also offers a futures contract on the red metal. China is the demand side of the fundamental equation in many raw material markets. Copper tends to reflect the economic state of the most populous nation in the world.
The prices of gold and copper have been moving higher over recent weeks. As we move into March, both metals are approaching significant technical levels on the upside that could launch a frenzy of buying if they break out over the coming weeks.
A bullish trend in gold since August 2018 despite the dollar
Gold fell to a low at $1161.40 per ounce in mid-August 2018 under the weight of a rising dollar and after the Fed added another rate hike to their agenda for last year. The price of the yellow metal found a bottom at that level and has been off to the races on the upside over the past months.
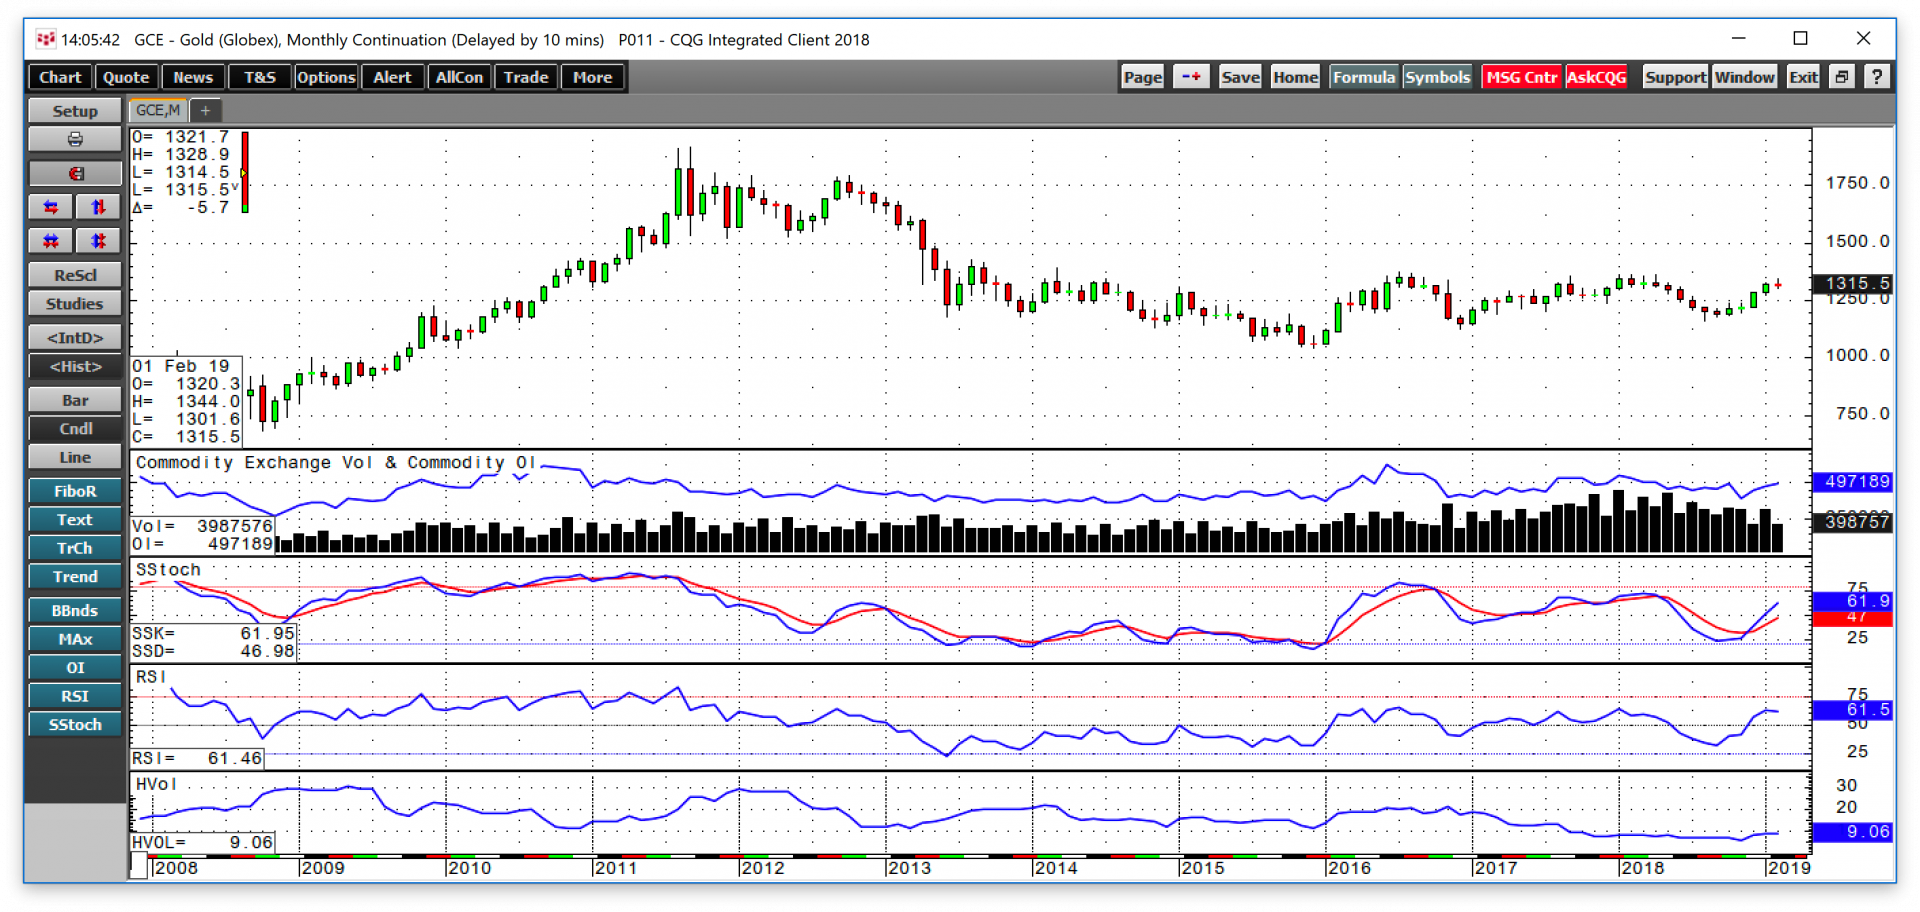
As the monthly chart highlights, gold has been in a bullish trend since last summer. Both price momentum and relative strength indicators point to higher prices. Open interest has been rising with the price moving from under 390,000 contracts in November to its current level at just over 498,000 contracts at the end of February. Gold posted gains over the past four of five months. April gold settled at $1316.10 on the final day of February.
Copper finds a low in early 2019
Copper tends to move lower during periods of global economic contraction and higher when the economy grows. In early 2019, the price of COMEX copper futures fell to a new and lower low at $2.5430 per pound. Since then, it has been off to the races on the upside for the red metal.
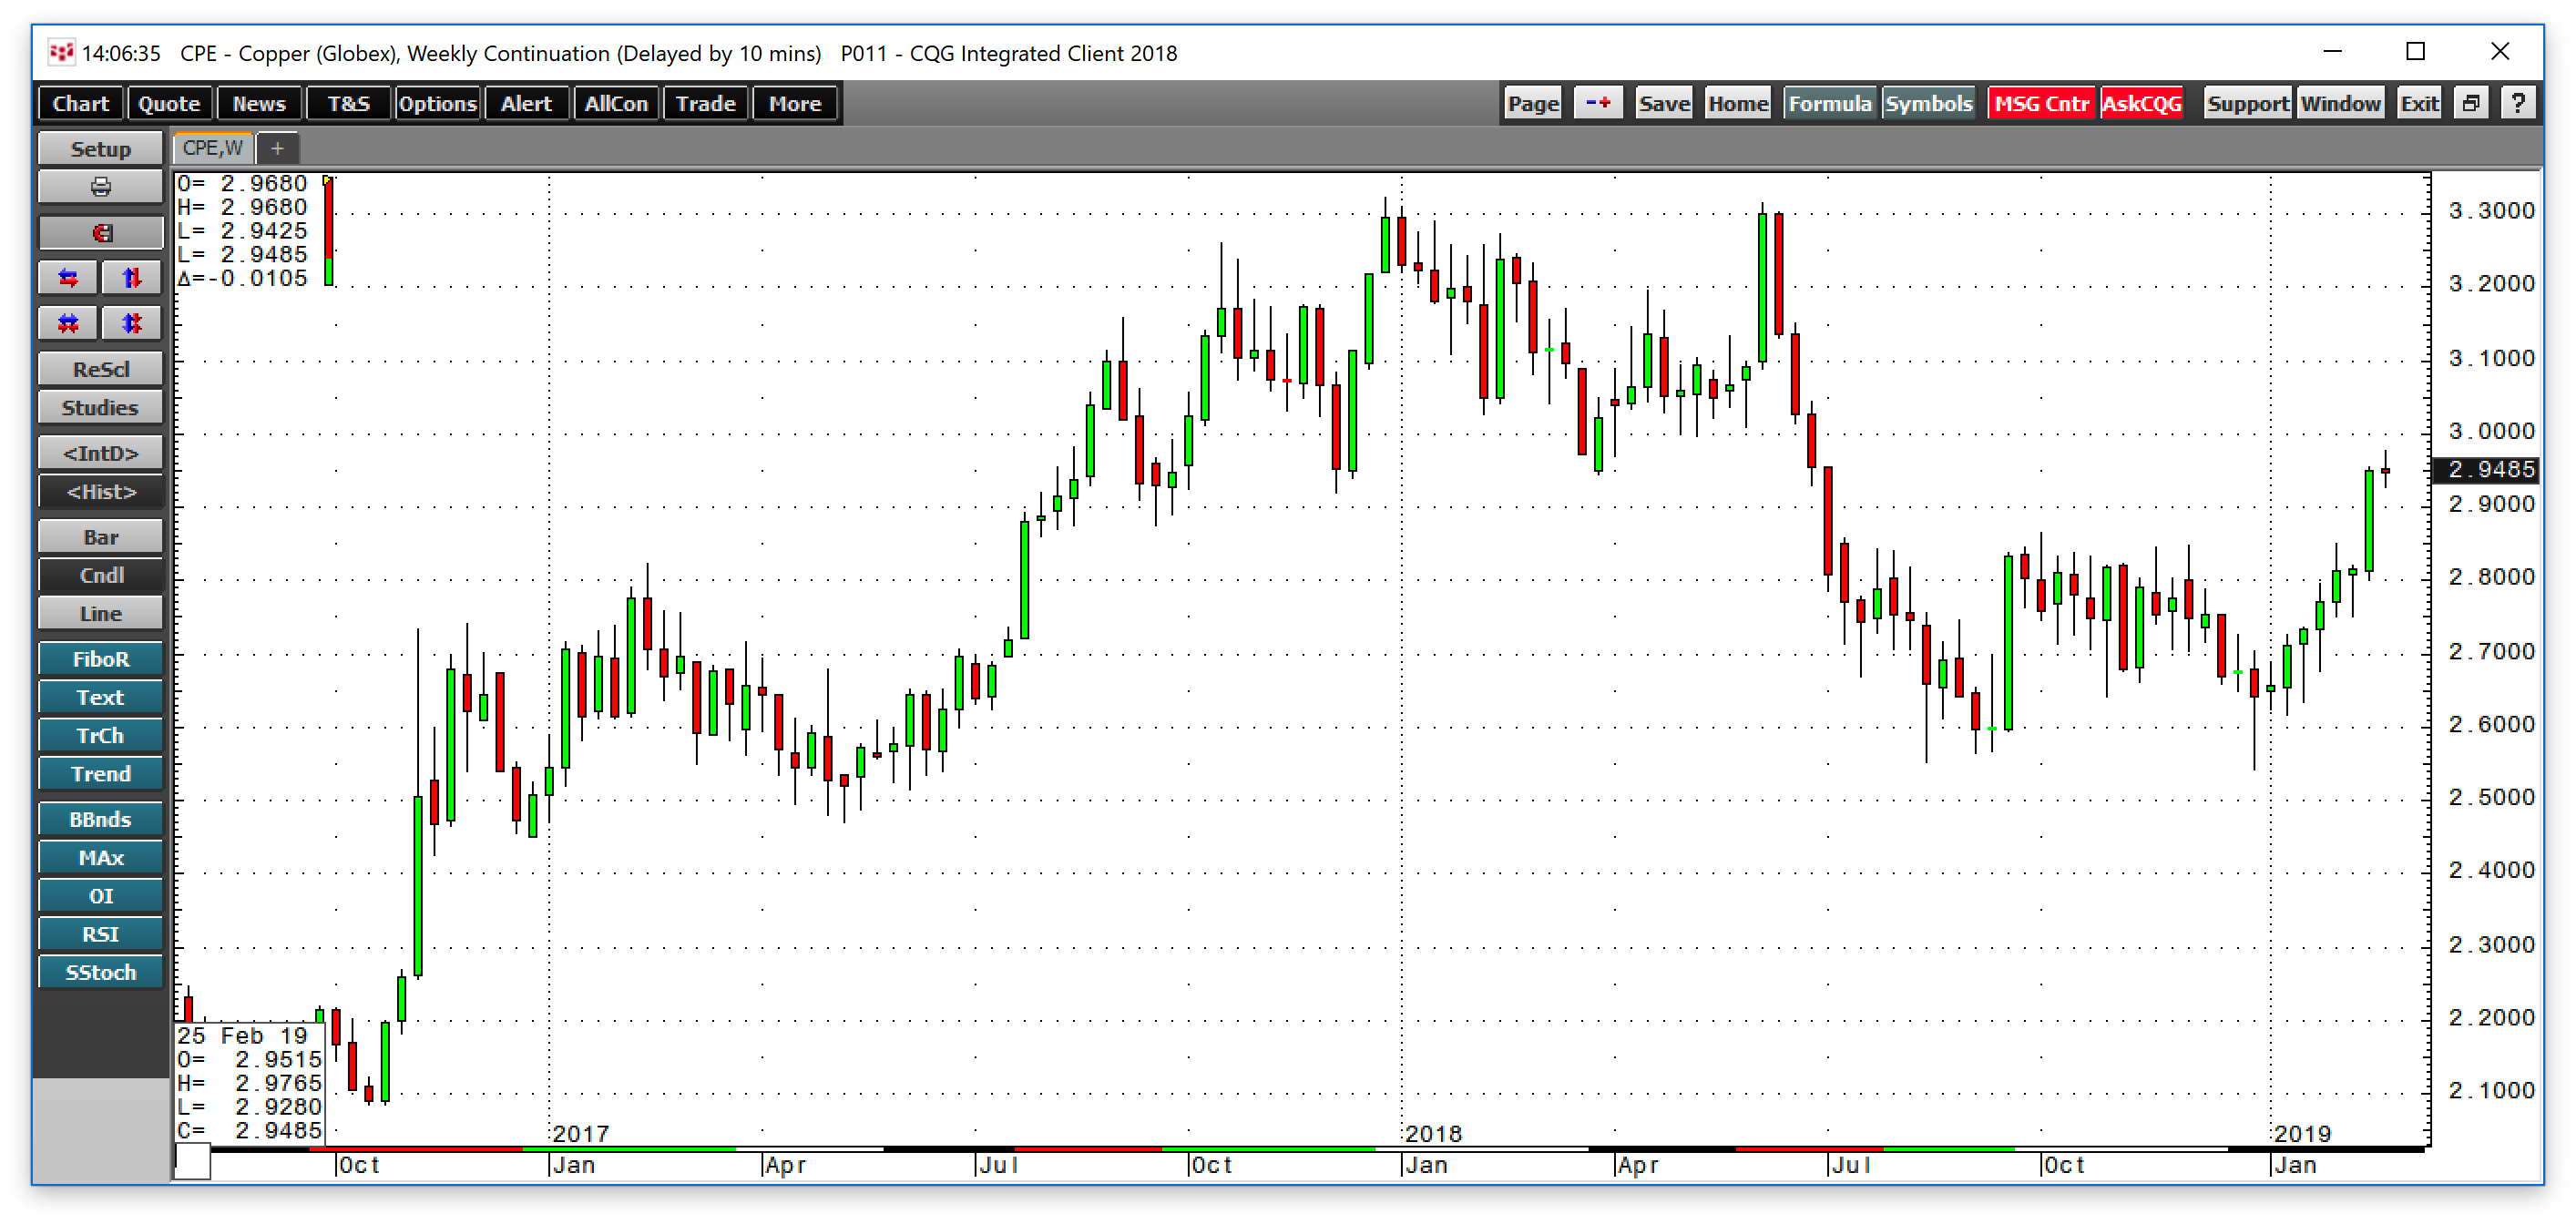
As the weekly chart displays, the price of copper broke through an area of technical resistance during the week of February 19 when the price rose above the early October high at $2.8665 per pound. On February 25 March copper futures traded to a high at $2.9765 per pound, the highest price since late June. It closed the month at $2.95 on the March futures contract.
Copper has recovered on the back of optimism over a trade deal with the US and China and low levels of inventories at both the London Metals Exchange and COMEX. Last year at this time stocks on the LME was well over the 300,000 metric ton level.
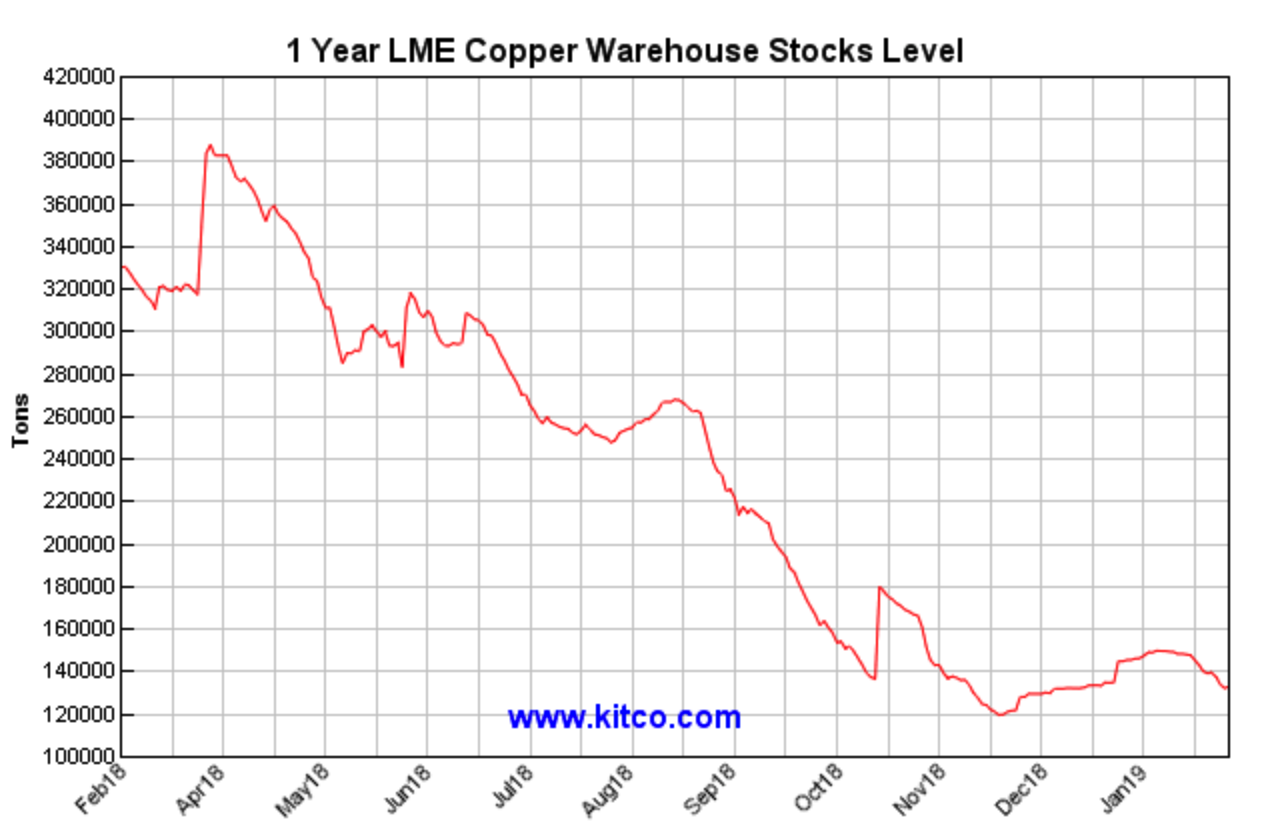
As the chart shows, LME inventories have declined to 130,925 tons as of February 28. Two months ago, copper stockpiles in COMEX warehouses were at over the 110,000-ton level.
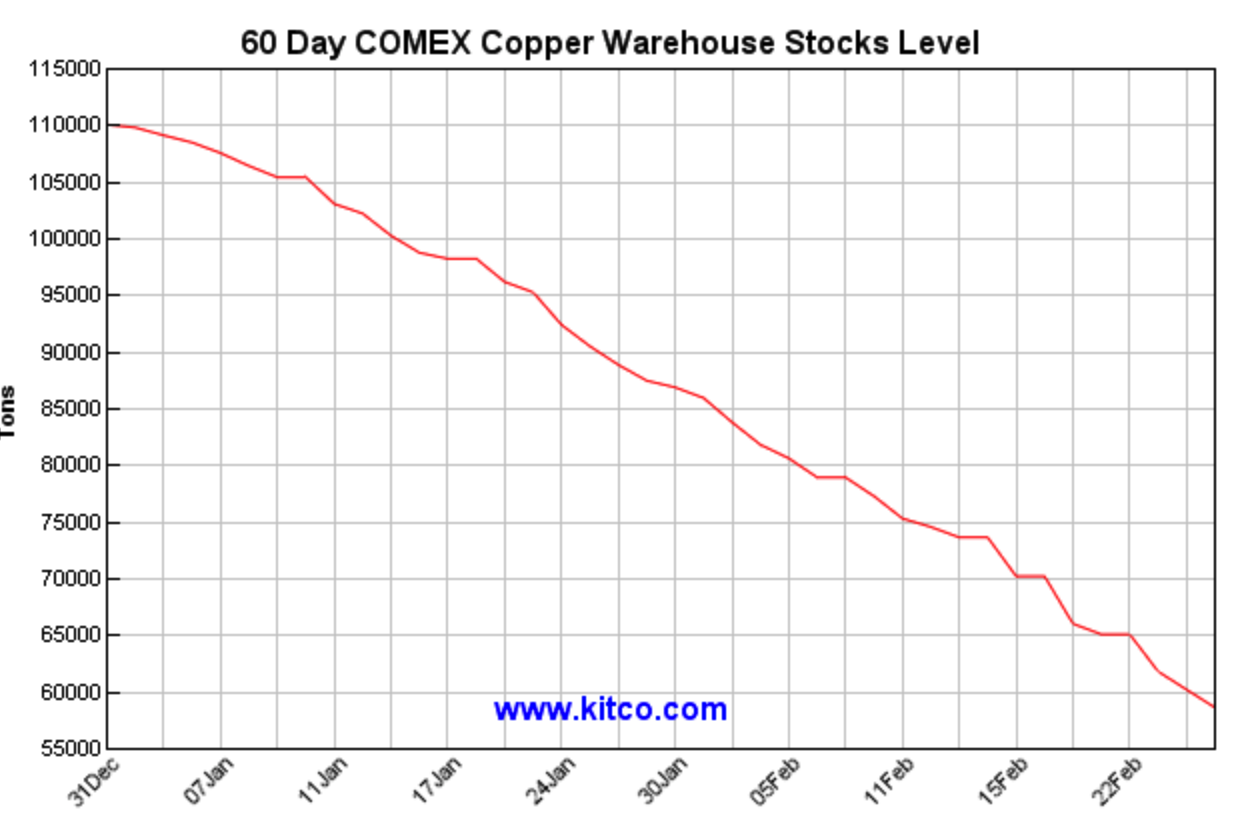
The chart displays the current stock level at under 60,000 tons.
The dollar index continues to make higher lows
Both copper and gold seem to have divorced from their traditional price relationships with the dollar. Gold may have declined and hit its low after the dollar index rose to a new high last summer, but since then the dollar has not backed off all that much, and it made another high in mid-December.
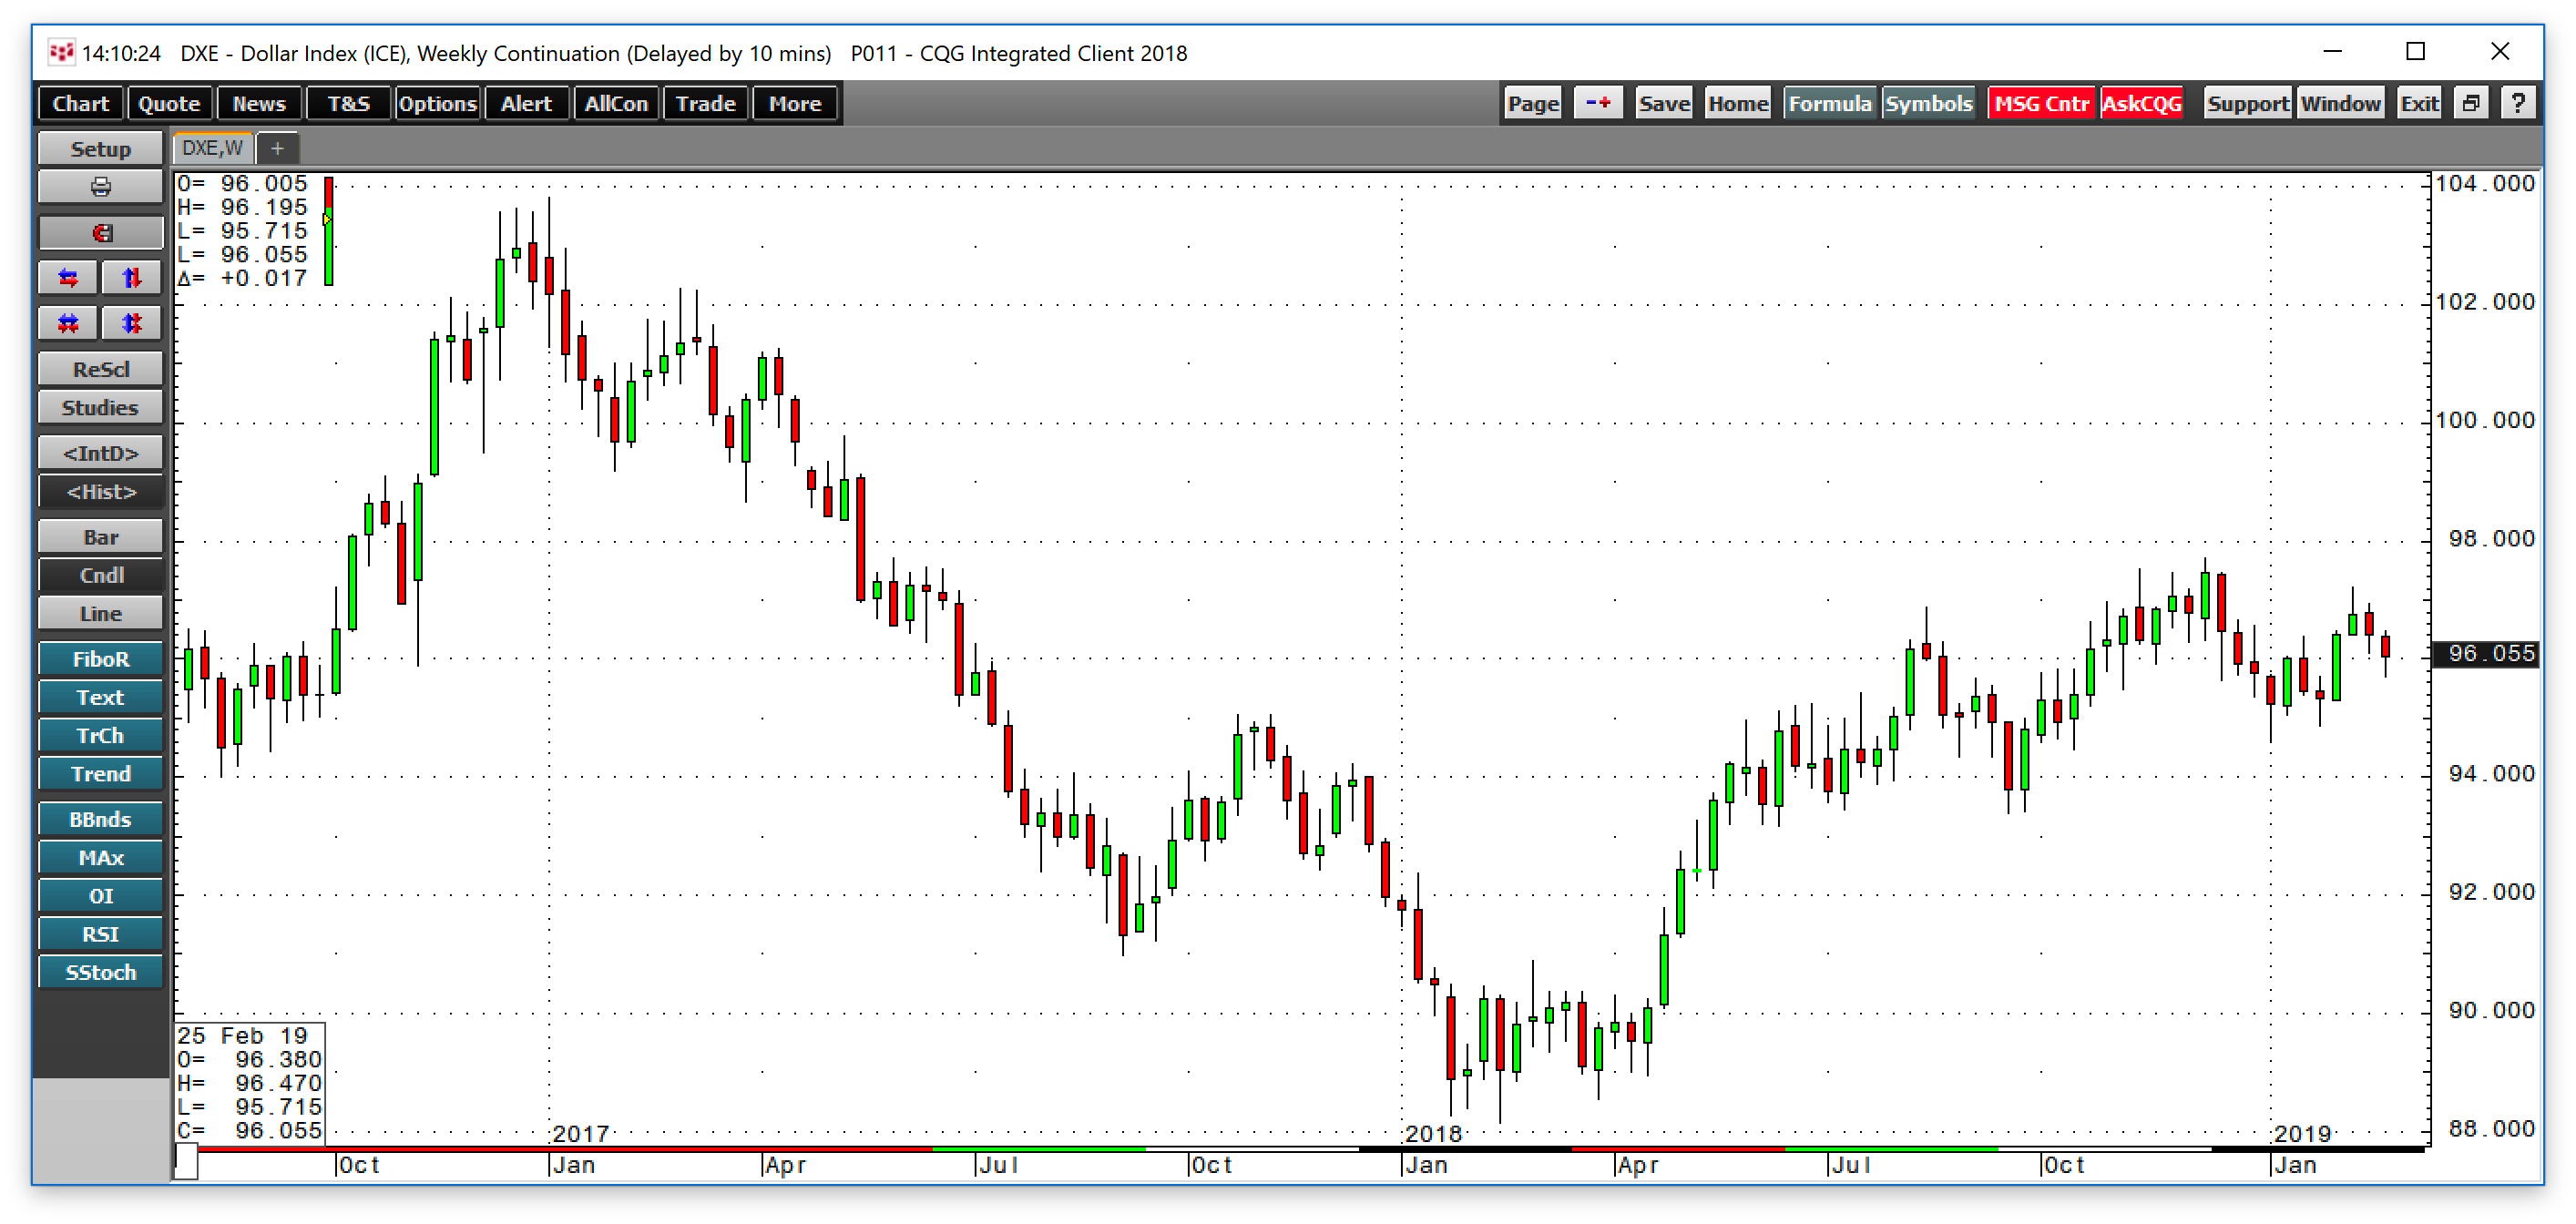
As the weekly chart of the dollar index shows, the mid-August high at 96.865 gave way to another higher high during the final month of the year at 97.705. Given the historical inverse relationship between commodities like gold and copper and the dollar, the price action in the yellow metal is a testament to its strength. The dollar index was at the 96 level on the March futures contract on February 28.
Trade and currency devaluation are pushing the metals higher
Gold has been trending higher in all currency terms which is a sign of strength for the gold market.
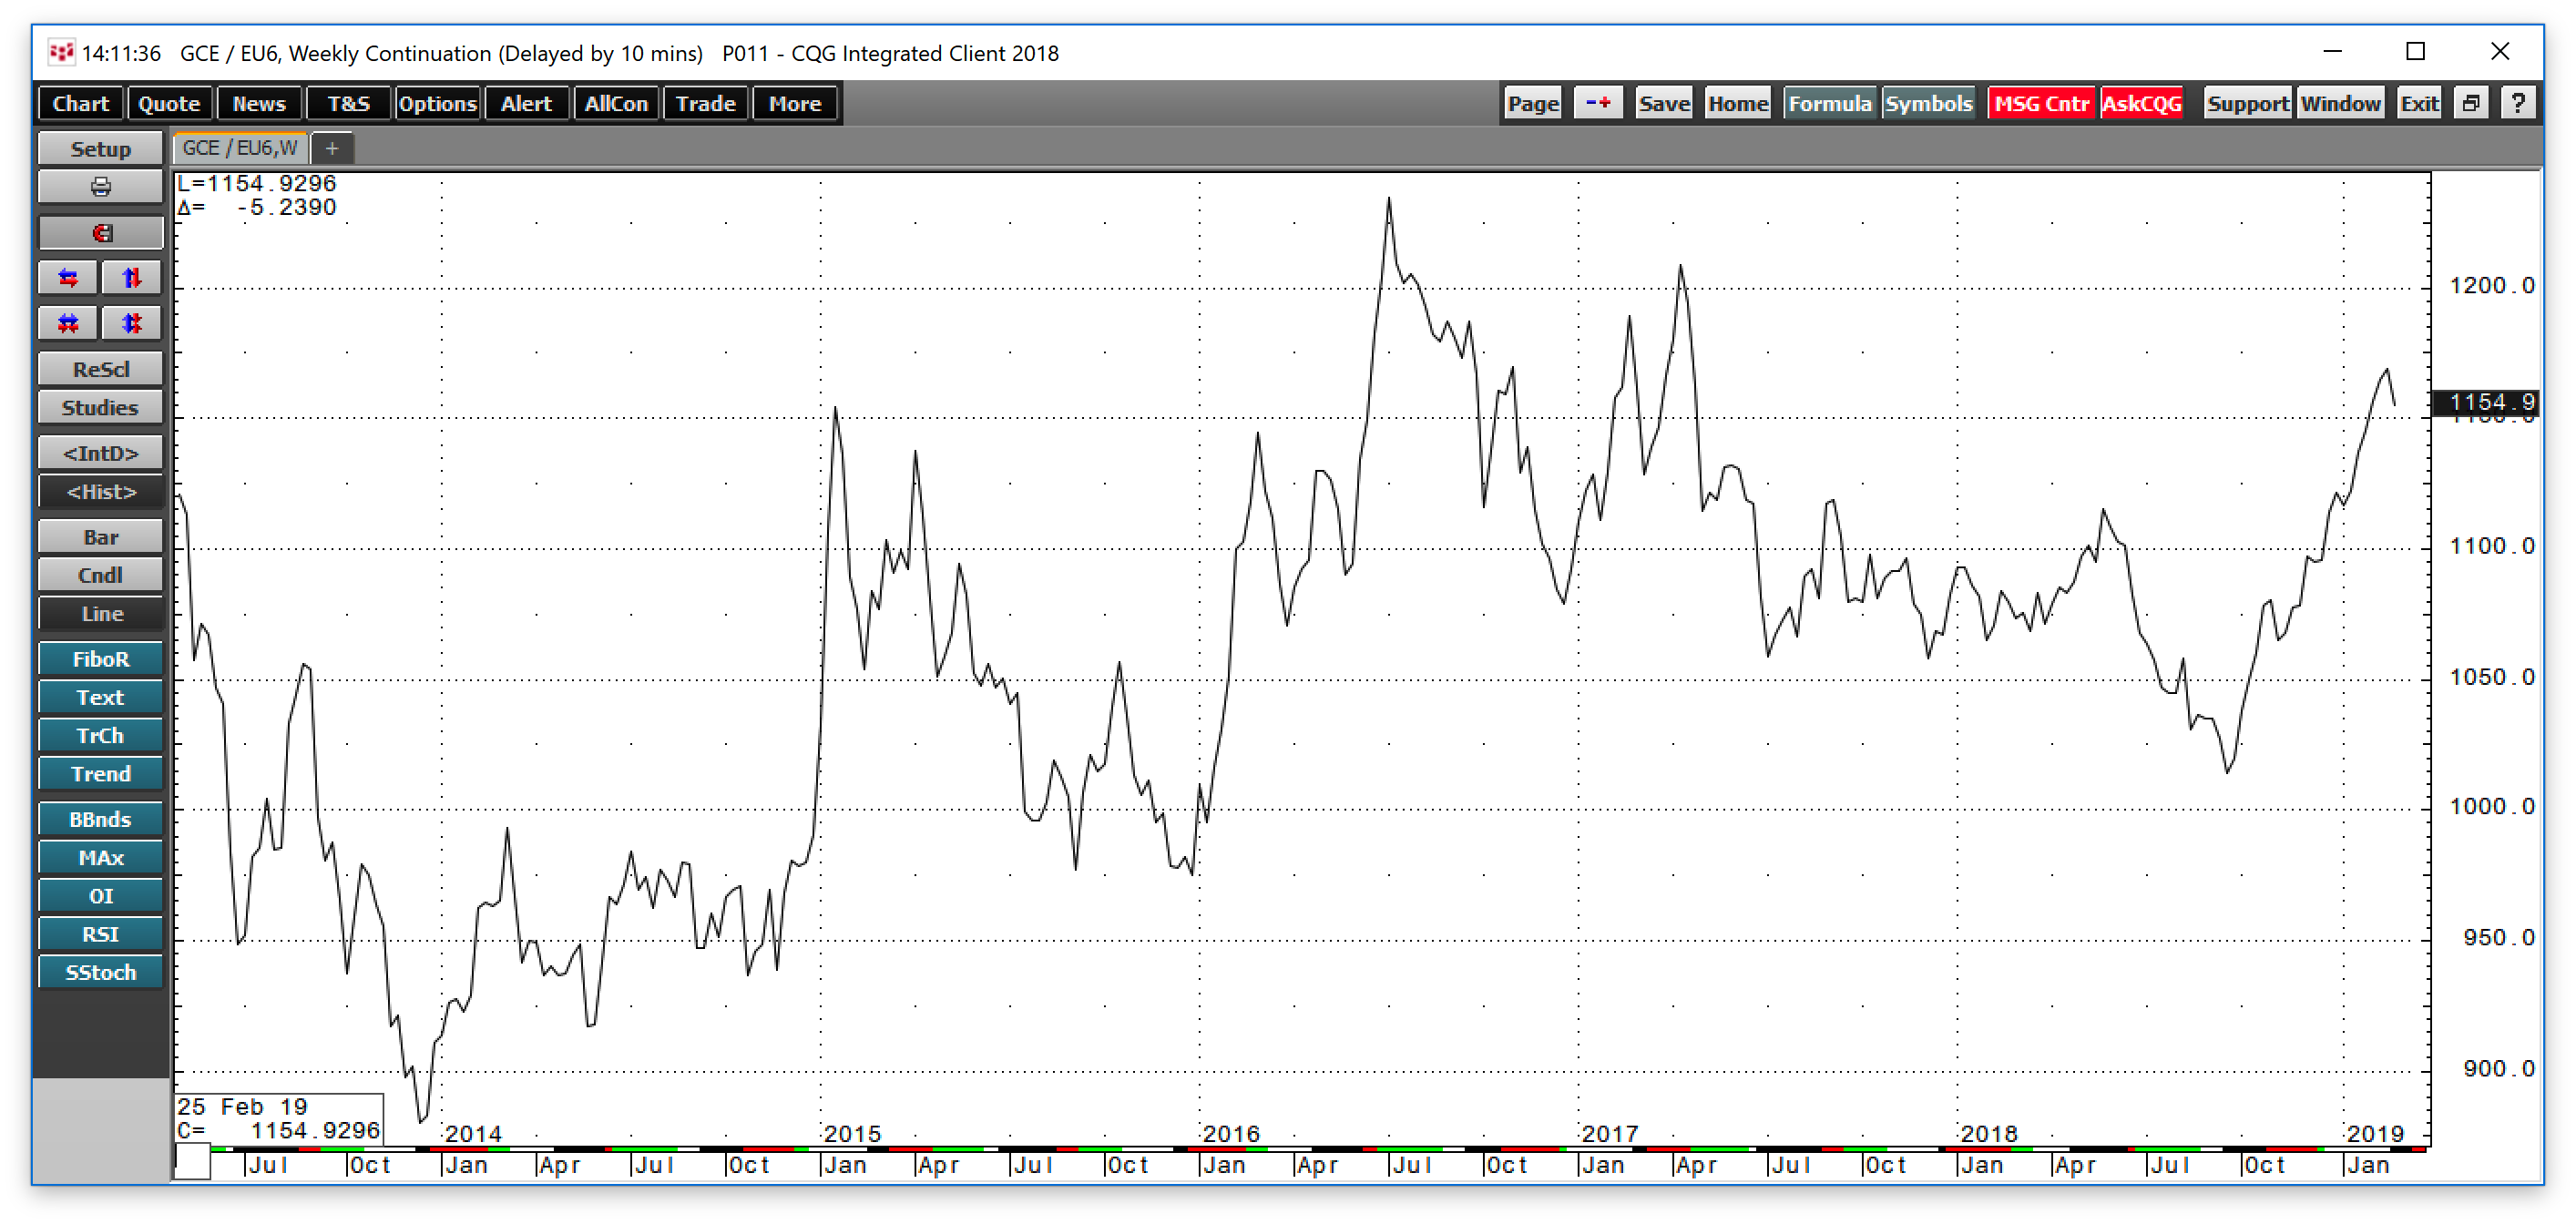
Gold is moving steadily higher in euro terms since September.
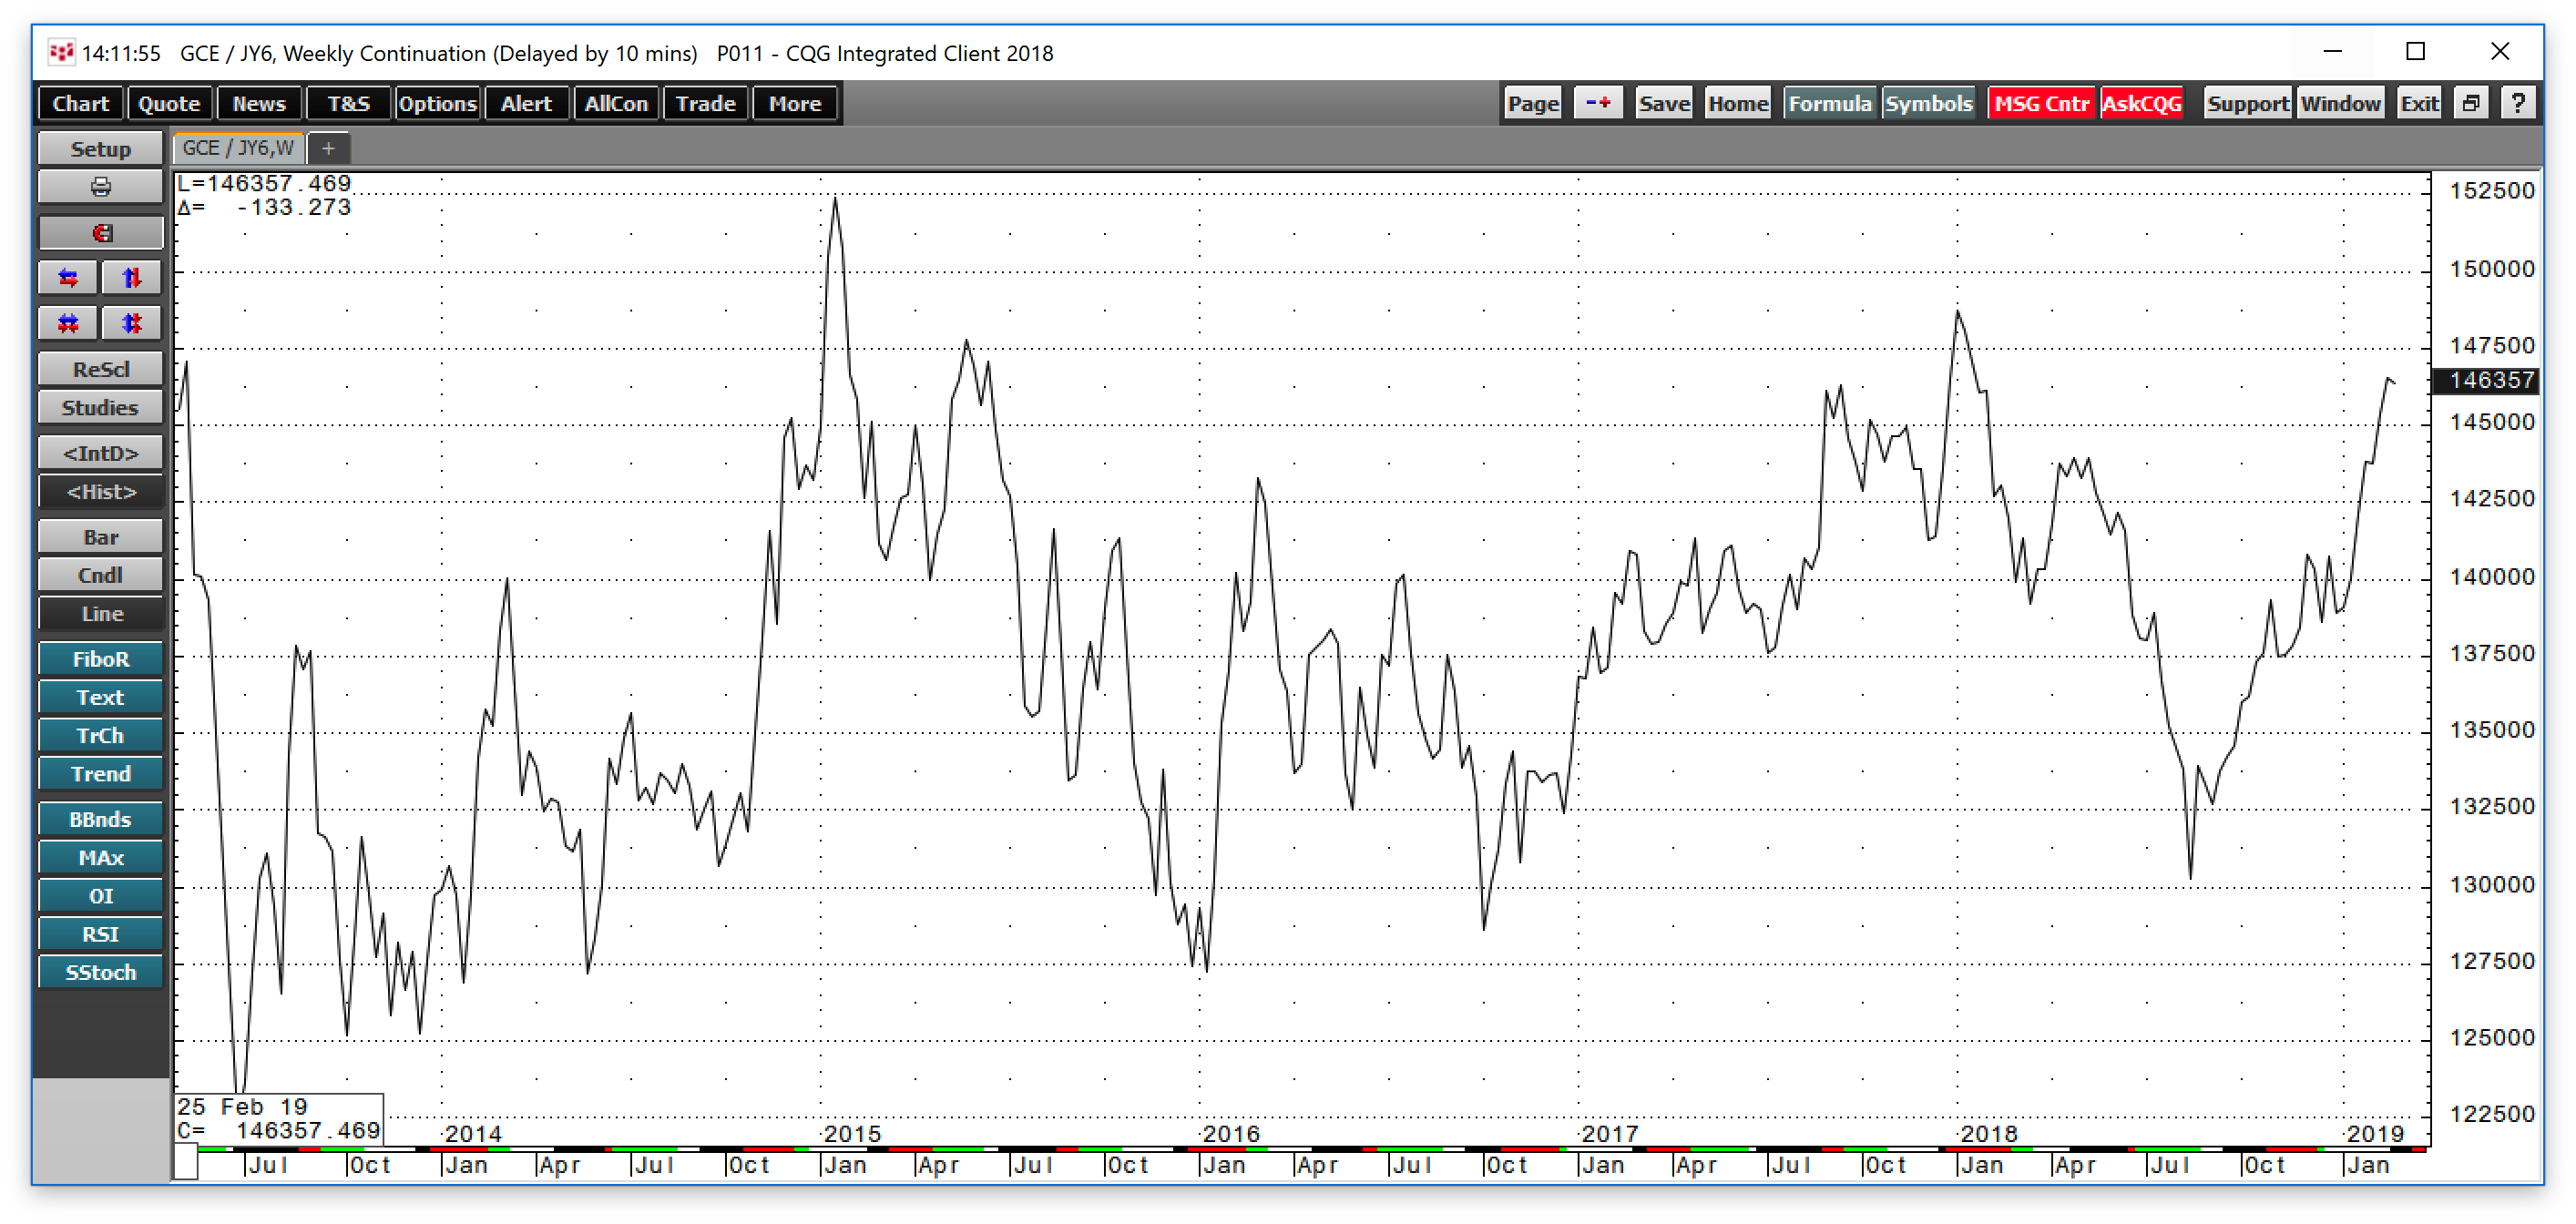
Additionally, gold is moving to the upside in yen terms since August. A rally in gold in all of the leading currencies of the world is a sign of an emerging bull market in gold.
A rally in gold in the dollar, euro, and the yen is a significant event. In the aftermath of the 2008 global financial crisis, unprecedented amounts of liquidity flooded world markets to stimulate the economies of nations and the world. While short-term interest rates have risen in the US, they remain in negative territory in Europe and Japan. The current trend in the price of gold could reflect the central bank monetary policy that appears to have debased the value of the world’s reserve currencies.
At the same time, in 2018, the threat of a trade way between the US and China was a dark cloud that hovered over markets and the potential for economic growth. As the two sides could be nearing an agreement, it could ignite a period of economic activity and inflationary pressures as the prices of commodities rise. Gold and copper are leaders in the world of commodities and barometers for global inflationary pressures when their prices move higher in all currency terms.
The levels to watch in gold and copper over the coming weeks
Both gold and copper are approaching significant technical levels that could launch prices substantially higher over the coming weeks and months.
In the gold market, the high in 2018 was at $1365.40 which was the peak in both January and April creating a double top formation on the weekly, monthly, and quarterly charts. If gold can rise above that level, it may provide the technical power for a challenge of the critical level of technical resistance at the 2016 post-Brexit peak and the highest level since 2014 at $1377.50 per ounce.
In copper, the price came close to the $3 per pound psychological level during the final week of February when the price rose to $2.9765 per pound. The critical level of resistance in the copper market stands at the December 2017 peak at $3.3220 per pound.
I will be watching gold and copper over the coming weeks. A move to the upside that takes out their technical resistance levels would be a sign that the commodities bull market is back, and inflationary pressures are rising which has significant ramifications for markets across all asset classes. On the downside, $1300 and $2.8750 stand as support for the yellow and red metals.