The dollar index moved higher by 1.16% in the first quarter of 2019, but the commodities asset class posted a gain over the first three months of the quarter that ended on March 29. Two of the six major sectors posted losses while four moved to the upside. The composite of 29 raw material markets that trade in the US and the UK fell down 6.82% in 2018, but in the first quarter, it moved 6.72% higher.
Gasoline led the way higher in Q1
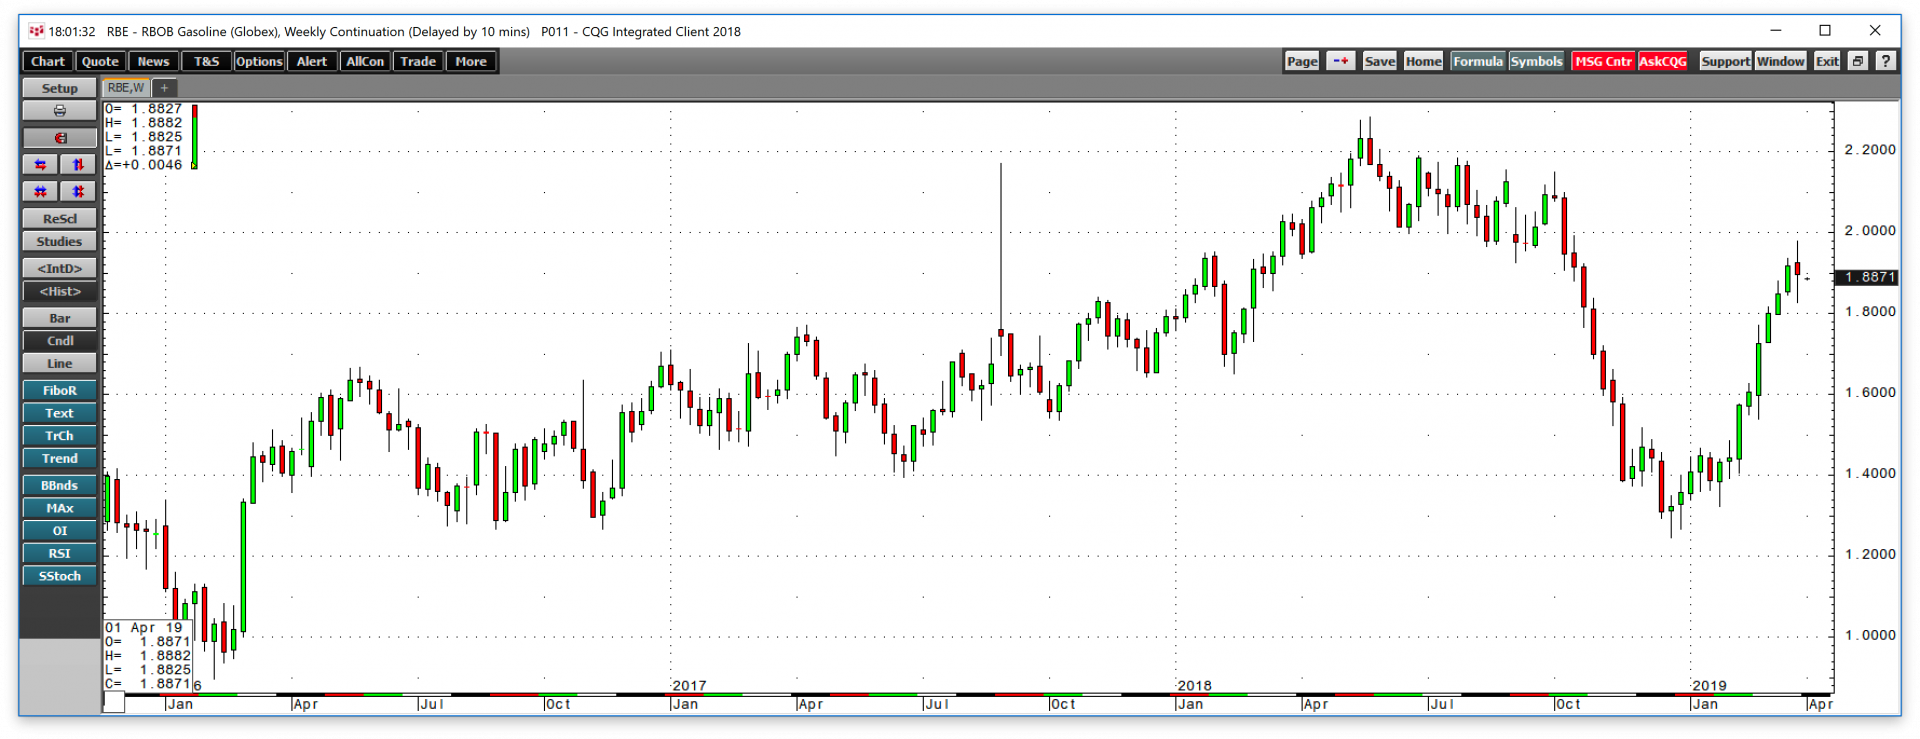
The energy sector was the best performing commodity in Q1 as the composite appreciated by 19.5%. Gasoline made the most significant gain in the sector and was the best-performing commodity of all for the three-month period that ended last Friday. The price of gasoline declined by 37.6 percent in Q4 2018 but turned higher in Q1 2019.
As the weekly chart highlights, the price of the fuel fell for eight consecutive weeks from early October through November and reached a low in December 2018. This year, the price moved higher over eight straight weeks. While the price of crude oil recovered, the move in gasoline was a function of seasonality. The winter months tend to be a period of low demand. During the first quarter of the year, the energy market turns its focus to the spring and summer season which is the time of the year when demand peaks as drivers consume more gasoline.
Gasoline and heating oil processing spreads reflected seasonal factors as we moved past the winter season in Q1. Gasoline cracks moved 103.44% higher while heating oil cracks which are a proxy for distillate products posted a 10.12% loss at the end of the first quarter compared to their closing prices at the end of Q4 2018.
Lots of double-digit percentage winners
There were many more winners than losers in the commodities asset class in the first quarter of 2019. The top three performing commodities for Q1 were gasoline which appreciated by 44.57%, NYMEX crude oil which was up 32.44%, and lean hogs which posted a 26.9% gain compared to its price at the end of 2018. There were more than a handful of double-digit percentage gainers in the commodities asset class in Q1.
In Q1, energy led the commodities asset class with a 19.49% gain followed by base metals that were 10.77% higher and animal proteins that moved 8.65% to the upside. Precious metals were 4.22% higher for the quarter.
The individual markets that were leaders aside from the three leaders were Brent crude oil that exploded by 25.6% in Q1, iron ore that was 24.8% higher, and nickel that gained 22.8%. Zinc posted a 19% gain; heating oil moved 17.4% to the upside, palladium was over 12% higher, copper on COMEX appreciated by 11.7% while tin on the LME rose by 10.2%
Commodities that moved between 5% and 10% to the upside include lumber which gained 8.33%, copper on the LME which was 8.3% higher, rice that moved 7.5% higher, cotton that was up 7.5%, and platinum added 6.7% over the first three months of the year. Ethanol gained 6.4% over the period.
The commodities that were 3% to 5% higher were sugar up 4.16%, and LME aluminum which rallied by 3.63% in Q1.
Marginal increases of 1-3% occurred in MGE wheat, live cattle, and soybean oil futures markets. Commodities that gained less than 1% in Q1 included gold, LME lead, soybeans, and soybean meal.
Honorable mention goes to the digital currency tokens in Q1 as Bitcoin gained 9.19% and the market cap of the asset class moved 14.5% higher compared to its level at the end of 2018. Meanwhile, at a total market cap of $143.330 billion, it remains well below the highs which were north of $800 billion in late 2017.
There were also some losers in Q2 in the raw material asset class
The biggest loser in Q1 was the grain sector that declined by only 1.71% over the past three months led by an over 12% loss in KCBT wheat. Soft commodities posted a 1.08% loss for the period with coffee falling by over 7%. All other sectors posted gains in Q1.
The three worst-performing commodities of Q1 aside from the Baltic Dry Index that fell by 45% were KICBT wheat which was down by 12.02%, natural gas that dropped 9.46%, and CBOT wheat that dropped 9.04%. Coffee shed 7.22% of its value in Q1 while cocoa was down 5.63%.
Those commodities that lost 3% to 5% were corn which declined 4.93% and FCOF futures which fell 4.2%. Silver, oats, and feeder cattle all moved between 1% and 3% to the downside in Q1.
A stronger dollar did not stand in the way as the Fed pivoted
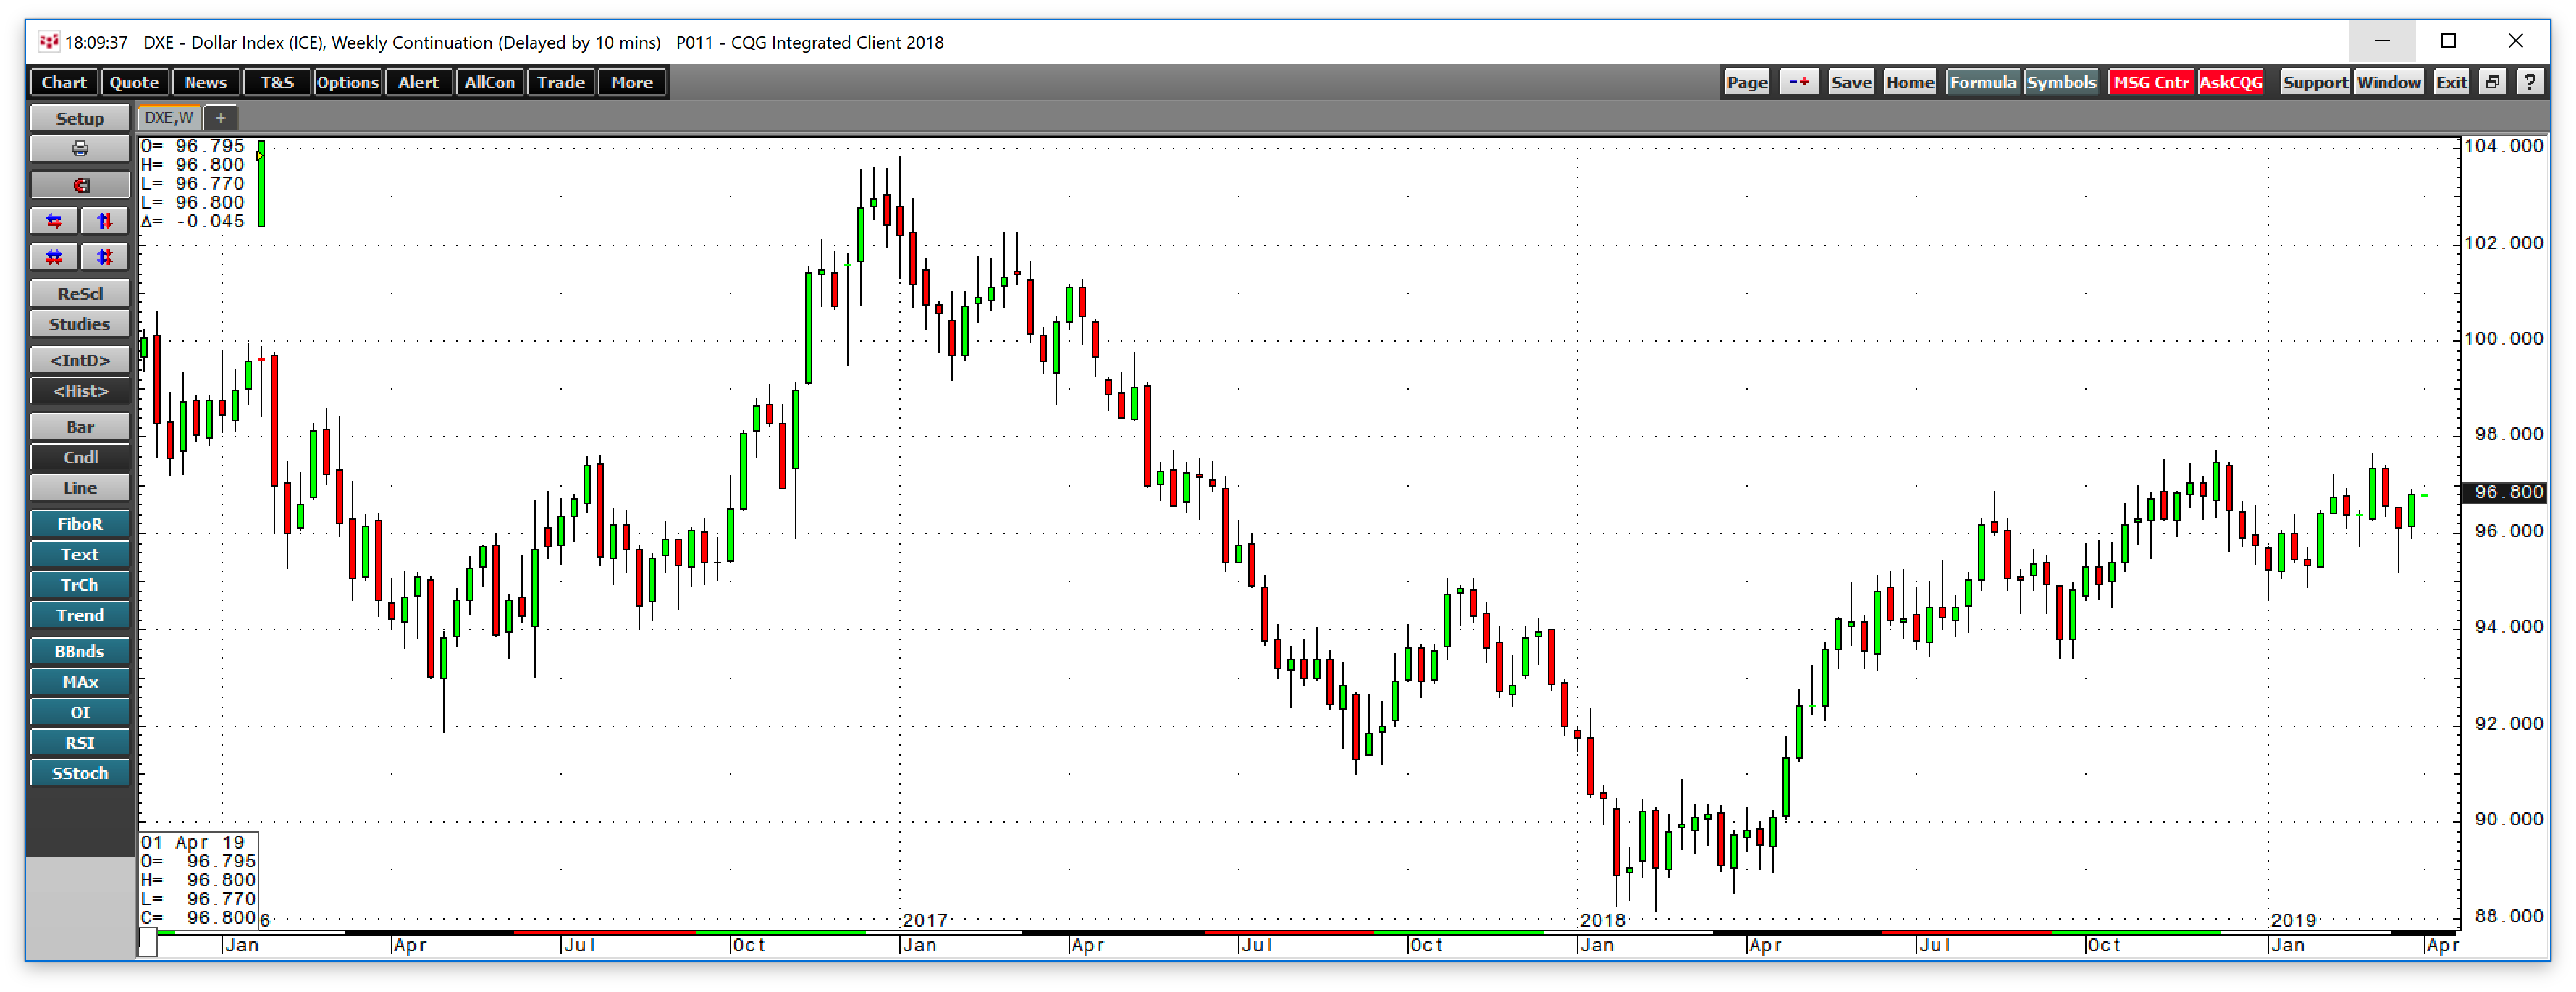
The inverse relationship between the US dollar and commodities prices did prevent price appreciation in many of the raw material markets in Q1.
As the chart illustrates, the dollar index rose by 1.16% and closed near the mid-December high at 97.705. The closing level for the June dollar index futures contract at the end of March was 96.845. However, the index has failed to make a higher high since late 2018 which could be providing stability for commodities prices.
At the latest meeting of the FOMC in March, the central bank told markets that they anticipate GDP growth to slow to 2.1 percent which caused them to cancel short-term rate hikes for 2019. The Fed also cut their guidance on increases to the Fed Funds rate for 2020 from two 25 basis point hikes to one. Moreover, the Fed told markets they would end their program of balance sheet normalization in September 2019, which will relieve upward pressure on interest rates further out along the yield curve. The pivot from a hawkish to a dovish approach to monetary policy should be a positive factor for commodities prices on two fronts. First, it could cap gains in the dollar as rate differentials between the US currency and euro should remain at the 2.25-2.50% level throughout the year. At the same time, a more stable environment for rates will keep the cost of carrying inventories and long positions in commodities stable.
Things to watch in Q2
Three events on the horizon during Q2 could impact commodities prices as well as markets across all asset classes. The UK and EU pushed the deadline on Brexit to April 12, and there are currently no signs that the two sides in the divorce are any closer to an agreement than they were in June 2016 when the citizens of the UK voted to exit the union. A hard Brexit could cause an increase in volatility in all markets at the beginning of the second quarter.
Trade negotiations between the US and China are ongoing as the sides attempt to reach a deal that would end protectionist policies. China is the world’s leading commodities consumer, and a slowdown in its economy has been a weight on many raw material prices. A new framework for trade could ignite the Chinese economy which would likely cause many commodities prices to move higher. Finally, in the oil market, the US administration faces a deadline when it comes to exemptions from sanctions on purchases of Iranian crude oil by eight nations. The deadline is in May. An extension of the exemptions would allow Iranian petroleum to continue to flow. However, if the US decides to play hardball and end exemptions, we could see a period of tightness in the oil market. At the same time, tightening the noose around Iran could cause increased tension in the Middle East and fuel higher prices for the energy commodity.
When it comes to seasonality, the spring season not only causes more driving, it is also the time of the year when farmers across the fertile plains of the US plant their crops at the start of the 2019 year. Farmers are not only facing trade issues with China, but also unprecedented floods that could delay planting activities. In the natural gas market, the withdrawal season is winding down and the injection season will begin with inventories at their lowest level since 2014. Finally, in late May, the 2019 grilling season will get underway which is the peak season for demand in the animal protein sector of the commodities market.
There is never a dull moment in commodities markets which offers those seeking price volatility lots of opportunities through the year.
