The dollar index moved lower by 1.22% in the second quarter of 2019, but the commodities asset class posted a loss in Q2. Two of the six major sectors posted gains while four moved to the downside. The composite of 29 raw material markets that trade in the US and the UK rose 6.72% in the first quarter; it moved 1.17% lower for the three months that ended on June 28.
Corn leads the way in Q3
The grains sector was the best performing commodity group in Q2 as the composite appreciated by 8.08%. Corn made the most significant contribution to the sector as it rallied by 17.88% compared to its closing price at the end of March.
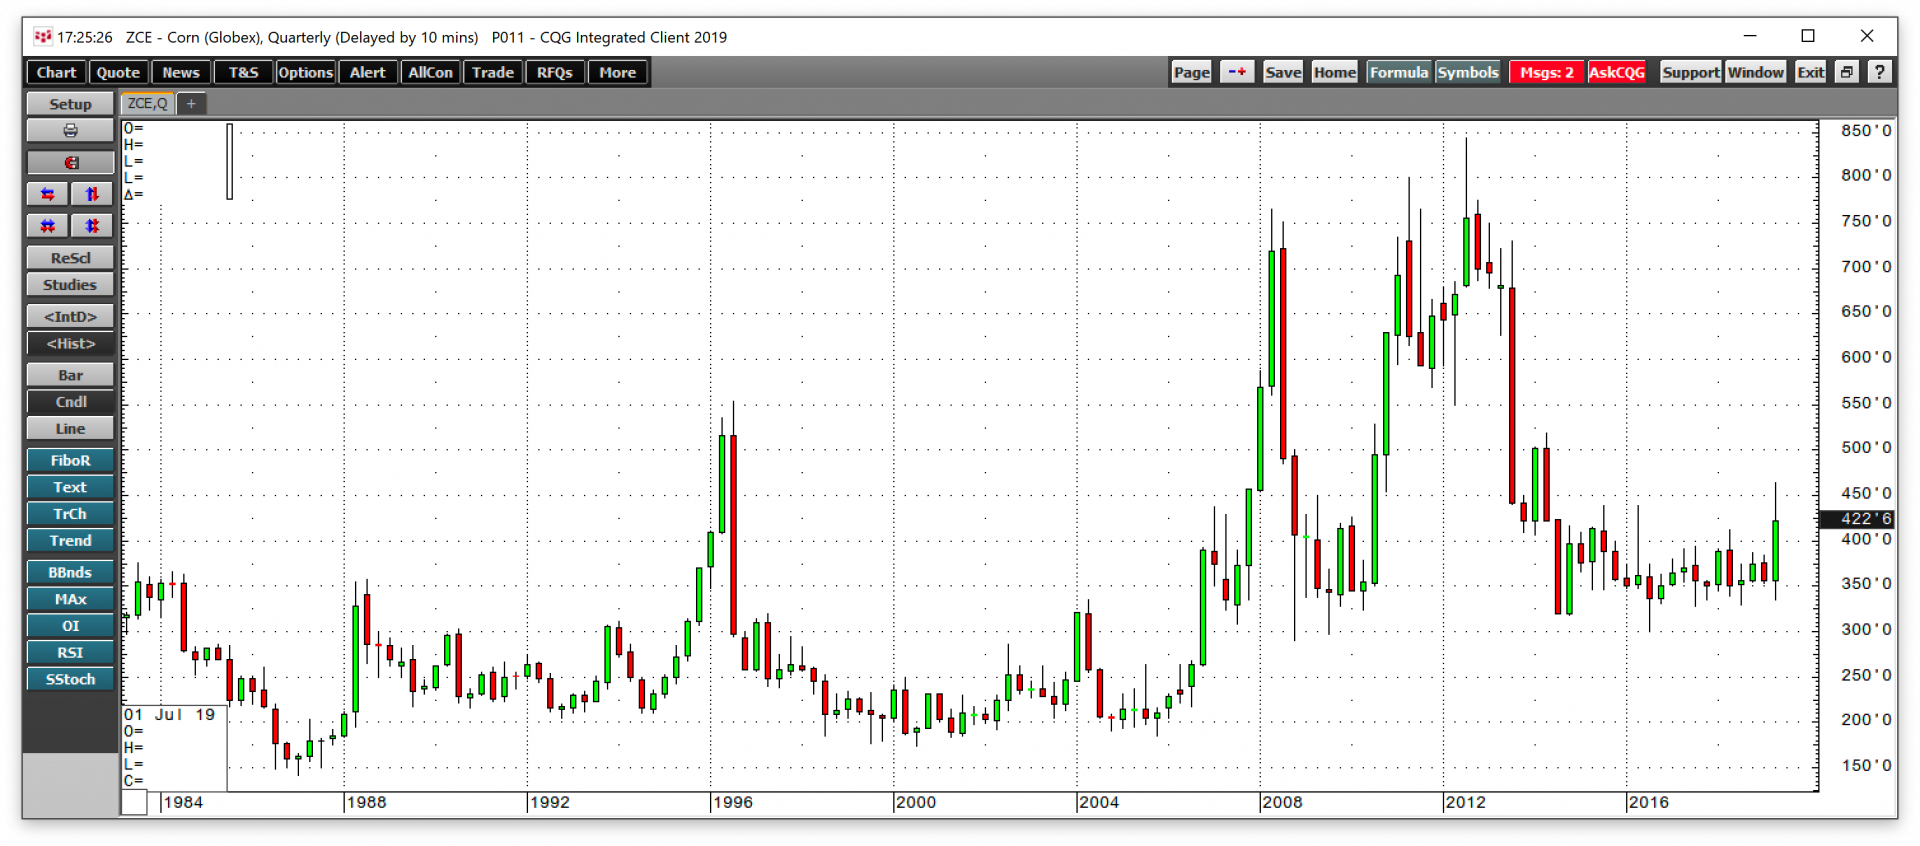
As the quarterly chart highlights, corn futures fell below the Q1 low and closed above the previous quarter’s high putting in a bullish reversal trading pattern on the long-term chart. Delays in planting and the administration’s move to lift the ban on E-15 lifted the price of corn, which is the primary ingredient in ethanol production in the United States.
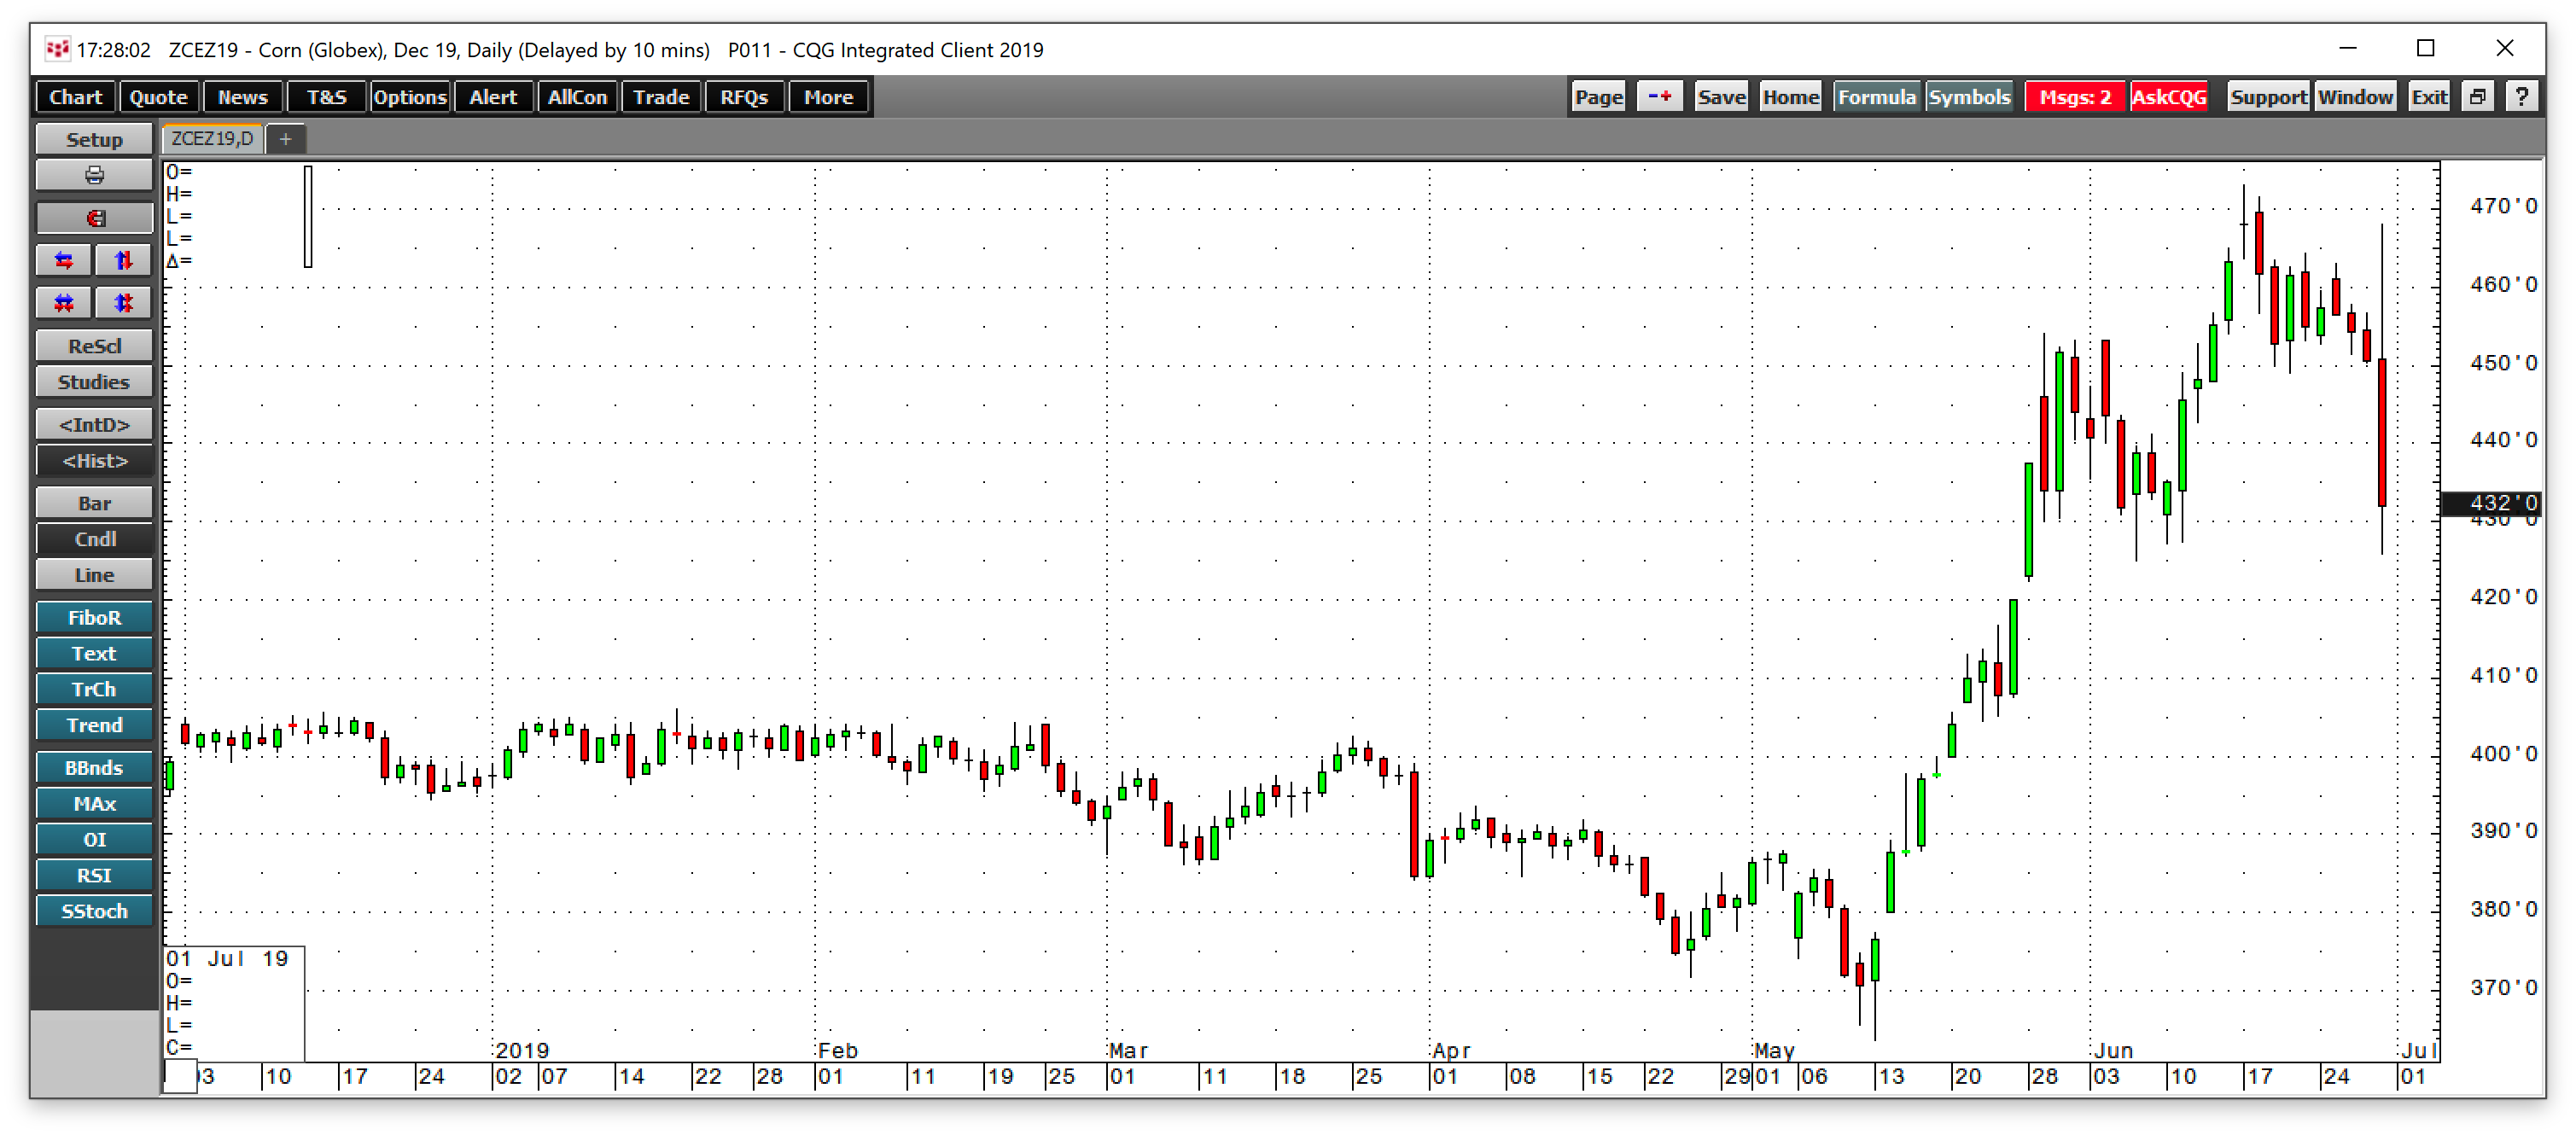
Meanwhile, the picture was not all rosy for the corn market as a crop progress report caused the price of the grain to put in a bearish reversal on the final day of trading in the quarter on Friday, June 28. Corn was 17.88% higher on the continuous futures contract in Q2.
Gains in Q2
During the period from April through June 2019, we saw gains and losses that resulted in a slightly more than one percent downside move in the asset class. Two of the six primary sectors of the commodities asset class posted a gain in Q2. The top three performing commodities for Q2 were iron ore, which appreciated by 30.72%, CBOT corn futures which were up 17.88%, and CBOT wheat futures which posted a 15.35% gain compared to its price at the end of 2018. The other double-digit percentage gainers in Q1 included coffee that recovered by 14.55%, palladium up 14.2% and ethanol that gained 11.9%.
In Q2, grains led the commodities asset class with an 8.08% gain, followed by precious metals that were 5.65% higher since the end of March 2019.
Commodities that moved between 5% and 10% to the upside include gold, which gained 9.03%, cocoa, which was 7.46% higher, lumber that moved 5.19% higher, and KCBT wheat added 5.00% over the second quarter.
The commodities that were 3% to 5% higher was only the rice futures market that moved 3.92% to the upside.
Marginal increases of 1-3% occurred in soybean meal, soybeans, and oats oil futures markets. Commodities that gained less than 1% in Q1 included silver and gasoline.
Over the first six months of 2019, the energy sector continues to lead the asset class with a 17.97% gain. Precious metals were 10.29% higher, with grains 5.96% higher, and base metals still 1.69% above where they closed at the end of 2018.
The CFTC has defined digital currencies as commodities. The cryptocurrency asset class that was all the rage in 2017 plunged in 2018. In Q1, the asset class moved to the upside but did little to erase losses from last year. In Q2, prices exploded higher. Bitcoin gained 202.92% in Q2 and closed at the $12,344.05 level. The market cap of the asset class as a whole moved from $144.330 billion at the end of Q1 to $347.407 billion on June 28, up 142.38% for the three-month period as Bitcoin outperformed the other tokens in the second three months of 2019.
The rise in digital currencies, together with the above 9% gain in the price of gold is a commentary on the value of fiat currencies. At the same time, the devaluation of the Chinese yuan likely drove buying into the gold and digital currency markets as they can serve as shelters for wealth. Facebook’s announcement that they are looking to roll out a digital currency, Libra, with a group of partners added support to the cryptocurrency asset class.
Losses in Q2
The biggest loser in Q2 was the animal protein sector that declined by 8.23% over the three-month period led by an over 12% loss in live cattle futures. Base metals posted an 8.14% loss for the period with the price of zinc falling by over 14%. Soft commodities lost 2.82%, and the energy sector edged 1.54% lower over the three months that ended last Friday.
The three worst-performing commodities of Q2 were cotton, which was down by 18.63%, FCOJ futures that dropped 15.8%, and LME zinc that declined 14.41%. Natural gas shed 13.3% of its value in Q2 while LME tin was down 12.15%. Live cattle futures dropped by 12.09% rounding out the commodities that suffered double-digit percentage losses for the quarter.
Those commodities that lost 5% to 10% were copper in COMEX and the LME, which declined 7.85% and 7.64% respectively. Lean hog futures fell 6.82% while LME aluminum posted a 6.27% loss. Feeder cattle were 5.78% lower, and LME lead declined by 5.27%.
Brent crude oil suffered a 4.2% loss, while LME nickel dropped by 3.13%. NYMEX crude oil, sugar, heating oil, platinum, soybean oil, and MGE wheat all moved between 0% and 3% to the downside in Q2.
The leading losers over the first six months of 2019 were natural gas which declined 21.5% since the end of 2018, FCOJ down 19.34% and cotton futures which lost 12.52% through the first half of the year.
Gasoline and heating oil processing spreads reflected seasonal factors as we moved into the peak season of demand for gasoline in Q2. Gasoline cracks moved 12.58% higher while heating oil cracks which are a proxy for distillate products posted a 2.35% gain at the end of the second quarter compared to their closing prices at the end of Q1 2019.
On a sector basis, soft commodities were 4.35% lower over the first six months of 2019. Animal proteins were only 0.20% lower than the closing level at the end of December 2018.
The Fed lights a bullish fuse under gold in Q2
In the aftermath of the June Fed meeting, the prospects for lower US interest rates before the end of 2019 caused the price of gold to take off on the upside.
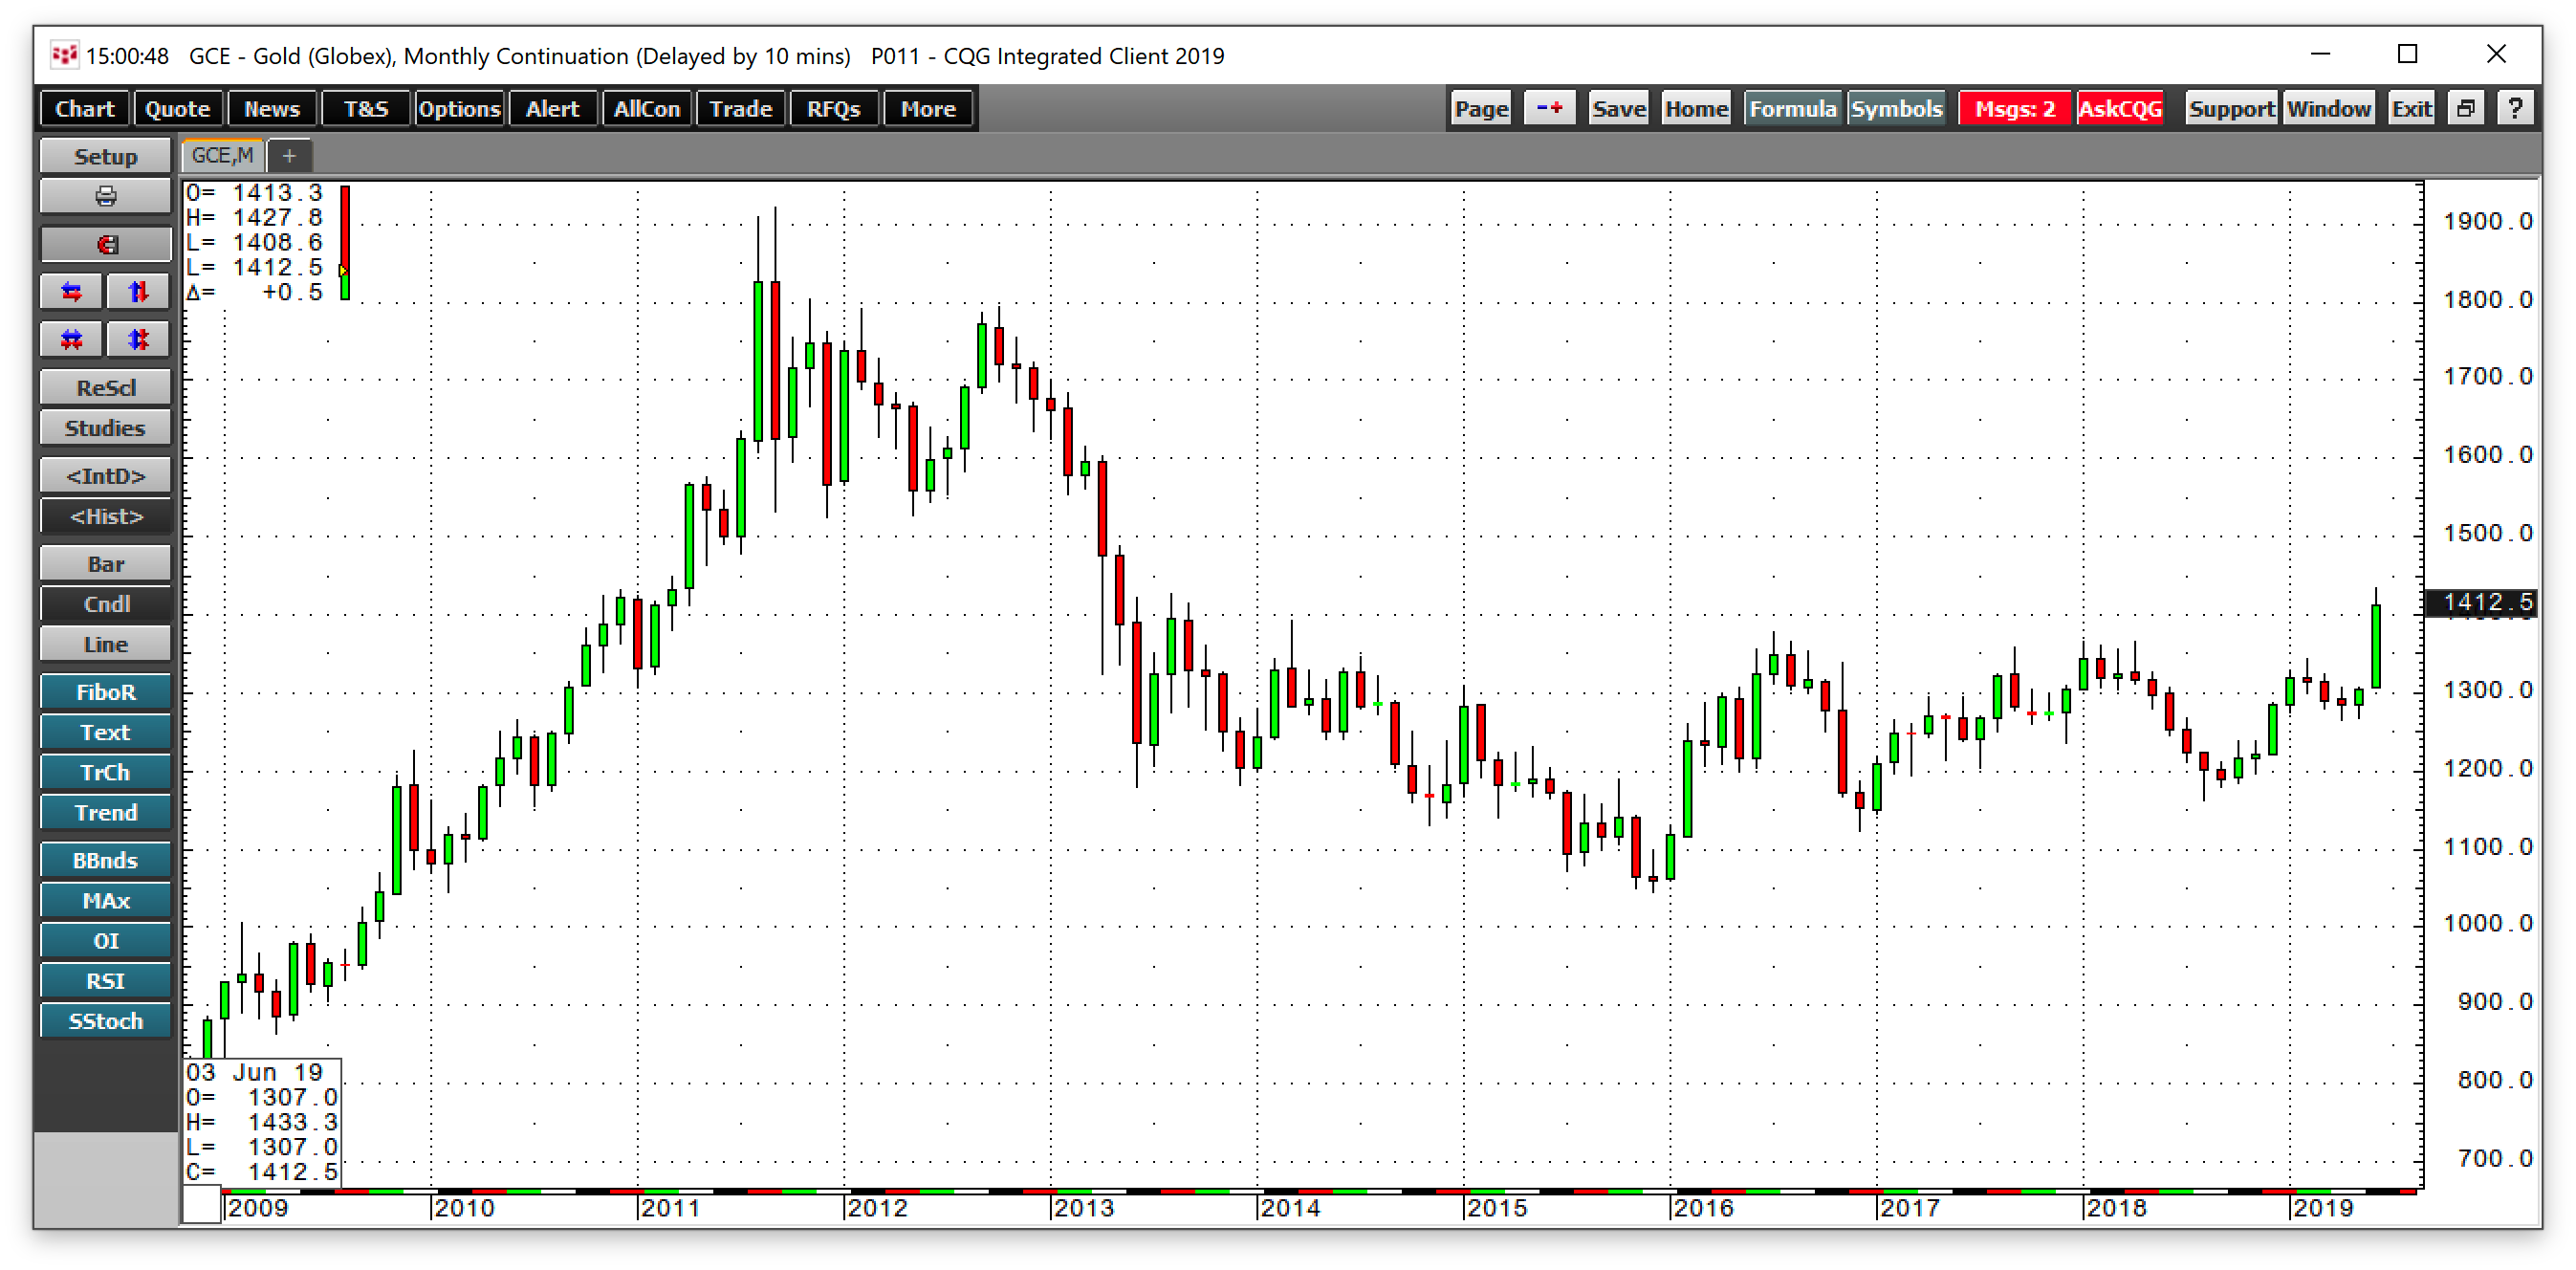
The monthly chart shows that gold broke above the 2016 post-Brexit peak and traded to a high at $1433.30 per ounce, the highest price since 2013. Time will tell if the positive tone coming out of the June 29 trade summit between Presidents Trump and Xi and the meeting between the leader of the US and North Korea’s Kim Jung Un on the final day of June will tarnish the yellow metal as we head into Q3.
Things to watch in Q3 - Trade and the Fed
The OPEC meeting on July 1-2 will be the first significant event of the third quarter. The tensions between the US and Iran could keep a bid under the price of crude oil over the coming weeks and months.
At the end of July, the Fed meeting will determine if the central bank follows through on its guidance and cuts the Fed Funds rate by 25 basis points. While the trade summit between the US and China at the G20 meeting did not yield an agreement, it did cause a moratorium on any new protectionist measures by either side in the dispute. However, trade will continue to be an issue that causes bouts of optimism and pessimism throughout the third quarter. Since China is the world’s most populous nation and the demand side of the equation for many commodities, the future of commerce between the US and the Chinese put raw material markets in the crosshairs of the trade dispute.
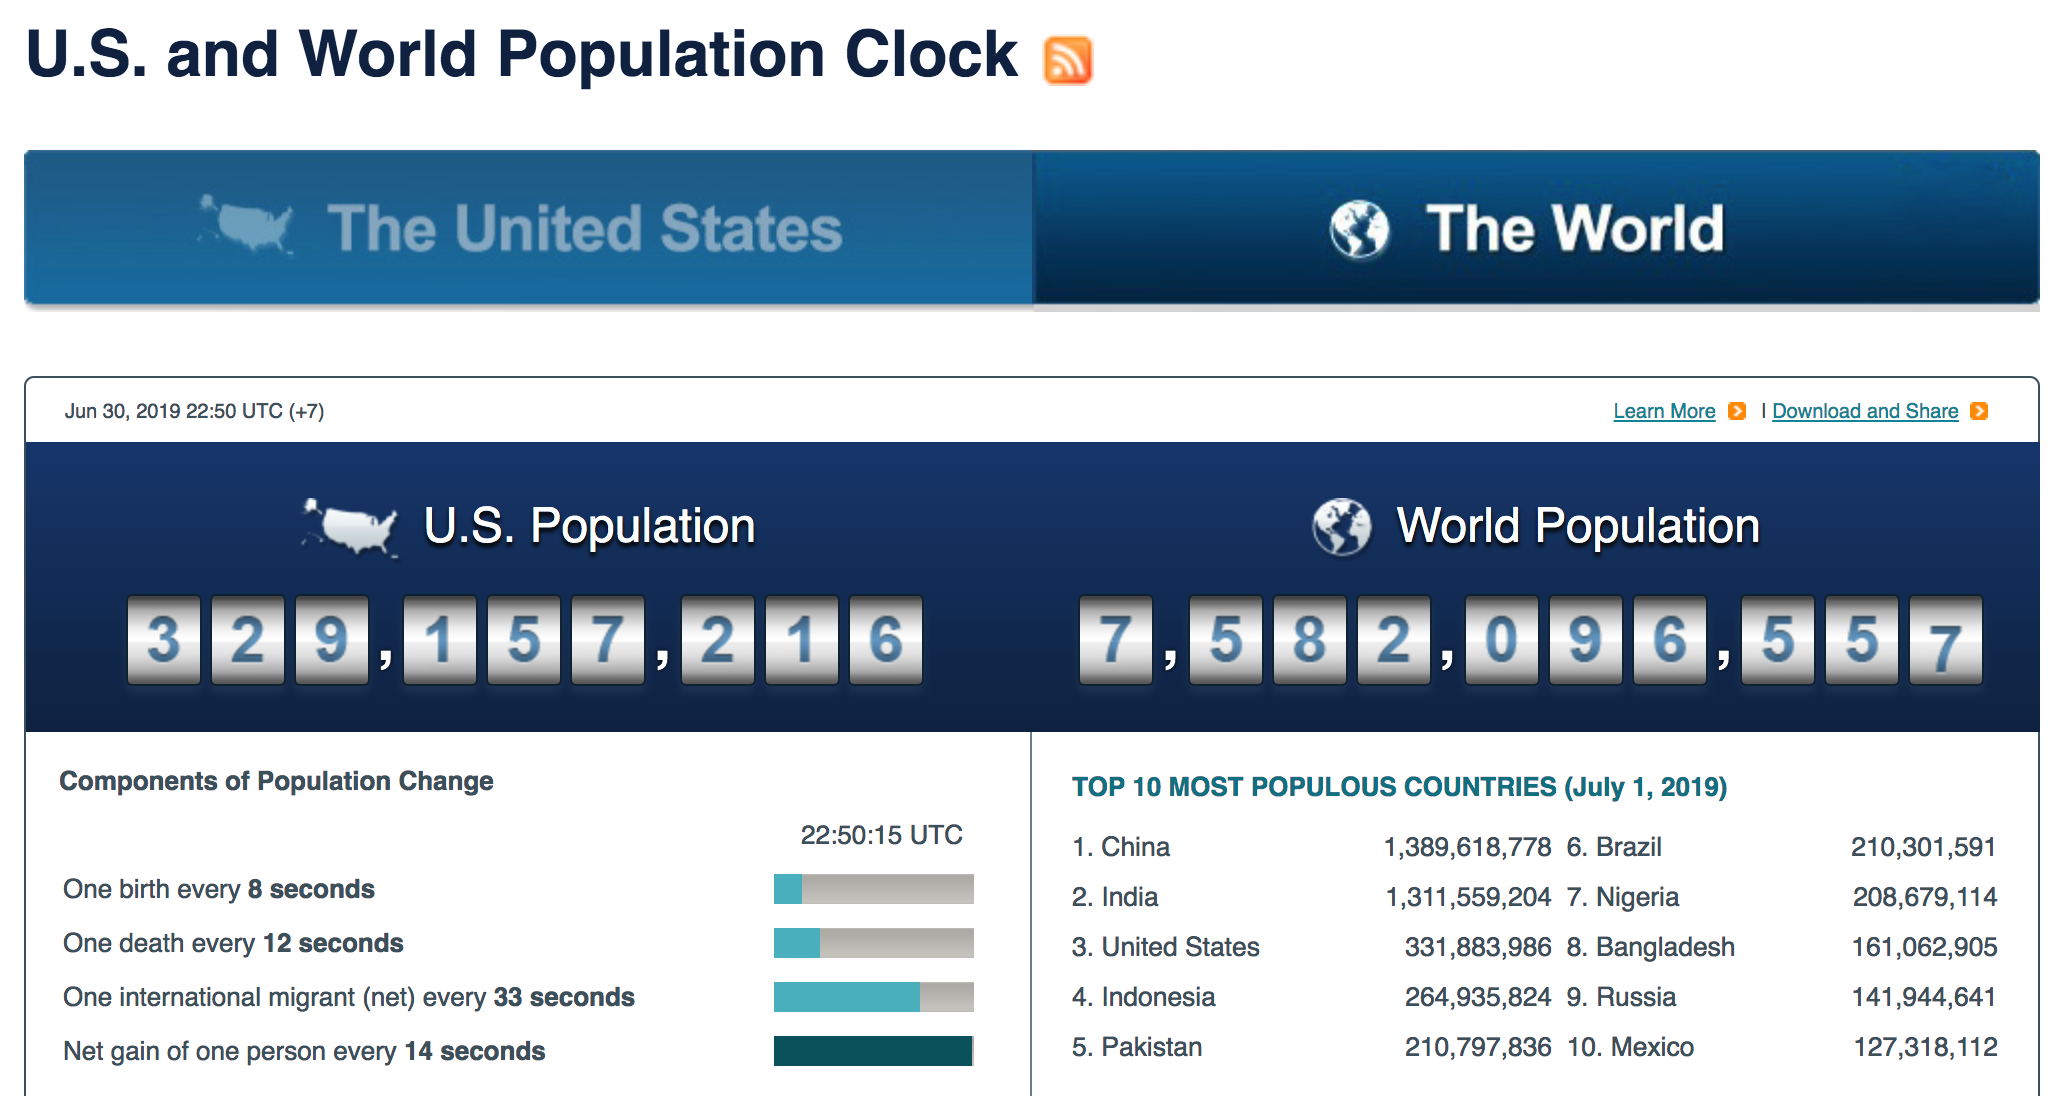
When it comes to grain markets, the coming weeks will tell us if 2019 will be another year of bumper crops or if the floods that delayed planting will cause the harvest to come in below expectations. At the turn of this century, approximately six billion people inhabited our planet.
Source: https://www.census.gov/popclock/
According to the US Census Bureau, the population of the world stands at the 7.582 billion level, an increase of over 26.3% in less than two decades. More people require more nutrition, which means that the world depends on bumper crops. The weather across the fertile plains of the US and around the world in the northern hemisphere will determine if there are surpluses or shortages of grains over the coming weeks as we are entering the peak growing season in July and August. A hint of drought conditions could add lots of volatility to the grain futures markets over the coming weeks.
As we head into the second half of 2019, we could see lots of volatility in markets across all asset classes, and commodities typically display high levels of price variance. Keep those stops tight and take profits when they are staring you in the face. Volatility creates lots of opportunities for those market participants who look for rewards by taking calculated risks with a plan and discipline.


