A strong dollar, escalating trade war between the US and China, and many other factors caused increased volatility in the commodities asset class over the third quarter of 2019. However, the overall performance of the sector was not all that exciting with the composite falling by 0.54%. Over the first nine months of this year, the asset class was 4.19 % higher as of the close of business on September 30.
A myriad of issues will continue to face the commodities markets and all asset classes as we head into the final three months of this year. The fourth quarter of 2018 was highly volatile. Stocks dropped like a stone, the price of crude oil fell from $76.90 to $42.36, and many other markets experienced high levels of price variance. Last year it was a hawkish US central bank that was behind the price action from October through December. This year, Brexit, trade, Iran, and impeachment proceedings in the US provide the ingredients for volatility.
Two sectors gain, and four post losses in Q3
During the third quarter, we saw gains and losses that resulted in a marginal move in the asset class to the downside. Two of the six primary sectors of the commodities asset class posted a gain in Q3. The top two performing commodities for Q3 were nickel which appreciated by 36.72%, and COMEX silver futures which were up 11.44%. The Baltic Dry Index deserves honorable mention as it was 38.58% higher for the quarter. There were no other double-digit percentage gainers in Q3.
In Q3, precious metals led the commodities asset class with a 7.05% gain, followed by base metals that were 2.71% higher since the end of June 2019.
Commodities that moved between 5% and 10% to the upside include lead which gained 8.73%, palladium which was 7.46% higher, rice that moved 6.56% higher, and NYMEX platinum added 5.33% over the third quarter.
The commodities that were 3% to 5% higher were the ethanol futures market that moved 4.45% higher, feeder cattle appreciated by 4.06%, and gold that gained 3.97%.
Marginal increases of 0-3% occurred in soybean oil that was 2.66% higher, oats moved 1.01% to the upside, natural gas posted a 0.95% gain, and soybeans edged 0.69% to the higher.
Over the last nine months, the precious metals sector leads the asset class with a 17.97% gain. Energy commodities were 11.02% higher, with base metals 5.58% higher, and grains 4.77% above where they closed at the end of 2018.
Nickel is the leader on the upside with silver second
The nickel and silver markets were star performers in Q3.

Source: LME
As the chart highlights, three-month nickel forwards moved from $12,705 to $17,370 per ton in Q3, a gain of 36.72%. News that the world’s leading nickel producer, Indonesia, accelerated its export ban to January 1, 2020, spurred buying in the nickel market. Indonesia produces around 180,000 tons of the metal more than the Philippines, which is the second-leading producing country.
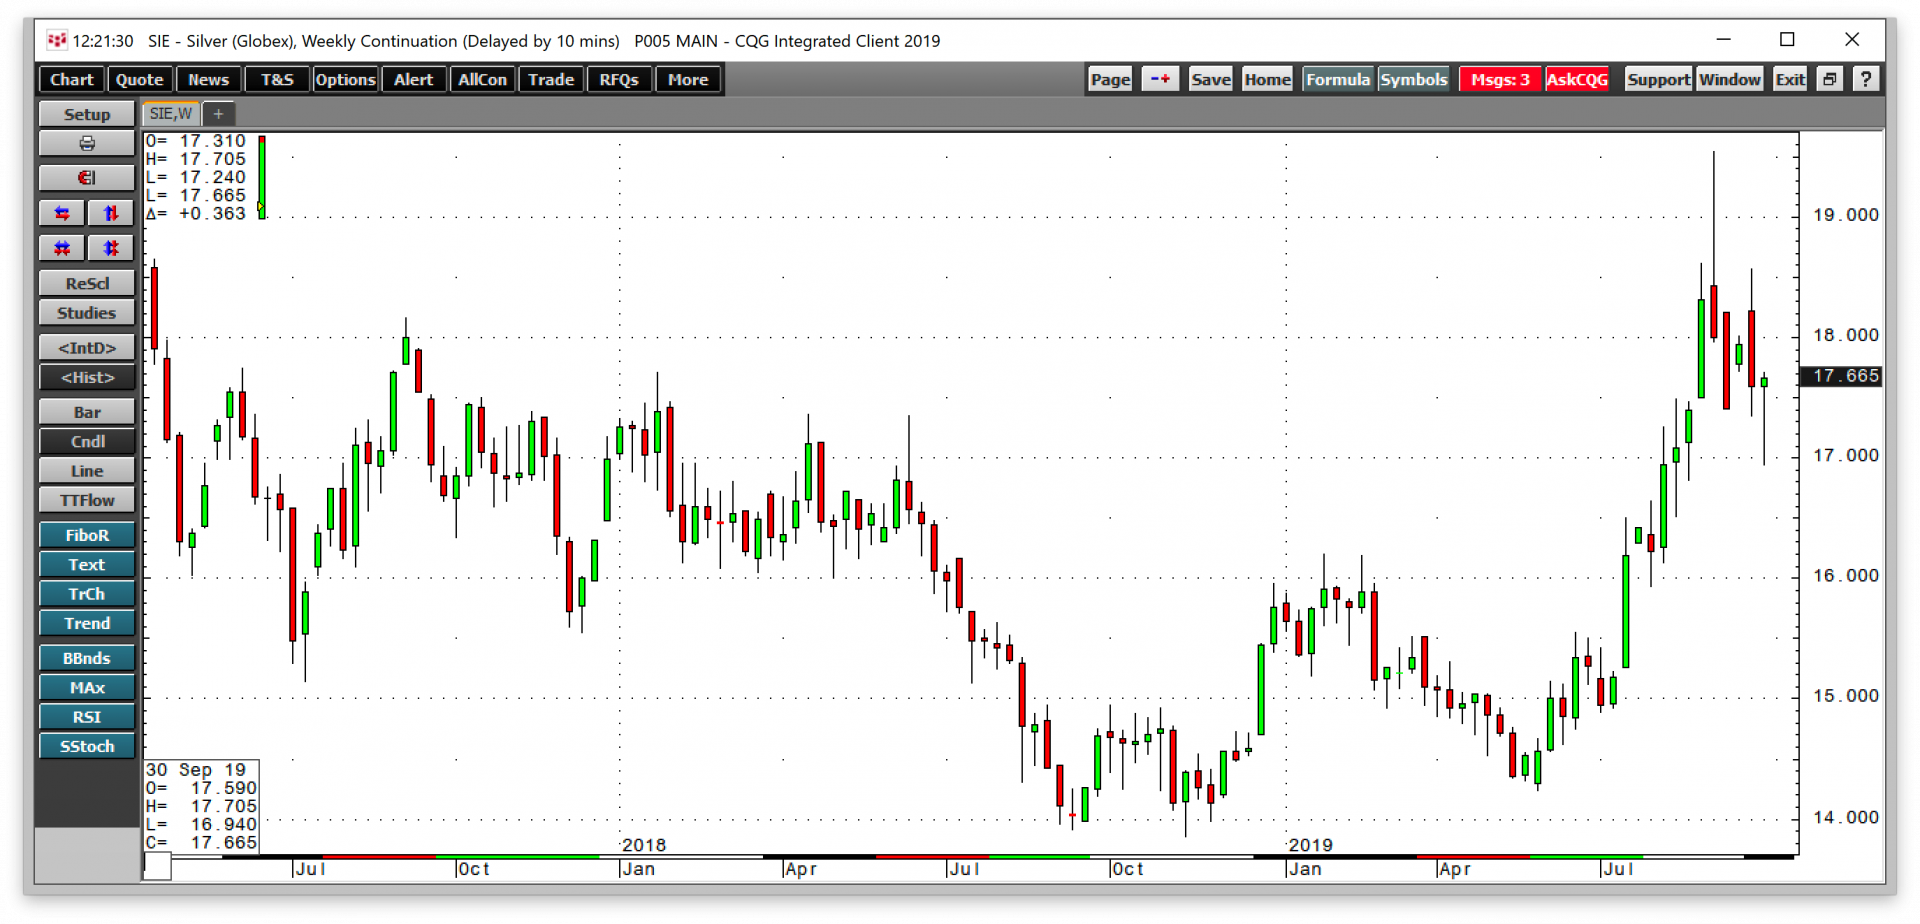
Silver took the silver medal in performance with a 11.44% gain over the three months. The chart shows that nearby silver futures on the COMEX division of the CME rose from $15.253 at the end of June to $16.998 per ounce at the end of Q3.
Precious metals are the best-performing sector with Base metals coming in second
The precious metals sector was the leader over the three-months with double-digit percentage gains in silver and platinum. Gold gained 3.97%, and palladium was 5.33% higher. Precious metals were in the spotlight in Q3 and over the first nine months of the year they posted an almost 18% gain.
Base metals were up 2.71% despite the ongoing trade dispute between the US and China. The Chinese are the dominant player when it comes to most commodities, but base metals prices are particularly sensitive to economic conditions in the world’s second-leading economy. The gain in the sector came mostly on the back of the performance of the nickel market, which had little to do with trade but with the situation in Indonesia.
The dollar index gained 3.51% in Q3, which weighed on many commodities prices. However, falling interest rates in the US and around the world lower the cost of carrying inventories, which is a supportive factor for prices. Gold deserves a special mention for its performance since June.
 As the weekly chart illustrates, the gold market rose above its level of technical resistance at the July 2016 high at $1377.50 in Q2. In Q3, gold kept on rising, reaching a high at $1559.80 in early September before correcting back to the $1465.70 level on September 30. Gold rose to new all-time highs in most currencies in Q3, including in euro currency terms. The only two foreign exchange instruments that have yet to see a new record high in gold in Q3 were in Swiss franc and US dollar terms.
Energy was the worst-performing sector
The biggest loser in Q3 was the energy sector as it declined by 5.03% over the three-month period led by an over 17% loss in gasoline futures. Animal protein futures fell by 3.51% following through on the downside as the peak season for demand ended in early September. Soft commodities posted a 3.34% loss for the period with the price of coffee falling by over 6.5%. The grain sector lost 1.10% over the three months that ended on Monday, September 30.
The three worst-performing commodities of Q3 were iron ore, which was down by 18.30%, gasoline futures that dropped 17.40%, and LME tin forwards that declined 14.52%. The three commodities suffered double-digit percentage losses for the quarter.
Those commodities that lost 5% to 10% were lean hogs, which lost 9.22%, Brent crude oil declined by 8.08%, KCBT wheat fell by 8.08%, and CBOT corn was 7.67% lower. NYMEX crude oil dropped 7.53%, LME zinc lost 6.95%, ICE coffee futures fell 6.56% while CBOT wheat posted a 6.11% loss. Soybean meal futures were 5.49% lower, and ICE cotton declined by 5.38%. Live cattle dropped 5.36% in Q3.
COMEX copper suffered a 4.69% loss, with LME copper falling 3.71%. LME aluminum was 3.99% lower. Sugar fell 3.25%. Lumber lost 3.11% of its value. NYMEX heating oil dropped 2.18% in Q3. MGE wheat was down by 1.76%, FCOJ fell 1.19%, and cocoa was 0.33% lower for the quarter.
The leading losers over the first nine months of 2019 were natural gas which declined 20.75% since the end of 2018, FCOJ down 20.30% and LME tin which lost 17.27% in 2019 as of September 30.
Gasoline and heating oil processing spreads reflected seasonal factors as we moved into the off-peak season of demand for gasoline in Q3. Gasoline cracks moved 45.16% lower while heating oil cracks which are a proxy for distillate products posted a 10.88% gain at the end of the third quarter compared to their closing prices at the end of Q2 2019.
On a sector basis, soft commodities were 7.61% lower over the first nine months of 2019. Animal proteins were 4.19% lower than the closing level at the end of December 2018.
The cryptocurrency asset class had a rough third quarter. Bitcoin lost 32.87% in Q3 and closed at the $8,286.18 level. The market cap of the asset class as a whole moved from $347.407 billion at the end of Q2 to $220.249 billion on September 30, down 36.6% for the three-months as Bitcoin outperformed the other tokens in the third quarter of 2019. Ethereum posted a 42.67% loss in Q3 while Litecoin was 53.26% lower for the period. Bitcoin Cash was 47.42% lower.
Looking forward to Q4 and beyond in commodities
The commodities markets will be facing a myriad of issues in Q4, which was a very volatile quarter in 2018. Trade between the US and China will continue to be a dominant force as protectionist measures distort supply and demand fundamentals. Tariffs create gluts in one region and shortages in others as we have witnessed in the US and China in the agricultural sector. Brexit will also be a leading issue as the deadline for the UK’s membership in the EU is on October 31. The Parliament passed legislation that Prime Minister Boris Johnson must request an extension if he cannot reach a deal by October 19. The Parliament has prevented the Prime Minister from exiting the EU without an agreement despite his pledge to the British people. Meanwhile, political wrangling will lead to a general election in Q4 that will serve as a second referendum for Brexit.
Iran’s fingerprints on the attack on Saudi oil fields on September 14 will continue to underpin the crude oil market. US sanctions on Iran could cause more provocative actions by the theocracy in Teheran in Q4. The impeachment inquiry by Congress against President Trump will dominate the political news in the US over the coming quarter and into 2020. The Presidential election in November 2020 promises to be the most contentious, perhaps in history. At the end of Q3, Senator Elizabeth Warren surpasses former Vice President Joe Biden in the polls. Senator Warren supports a progressive agenda, which would result in significant changes to the tax and regulatory landscapes in the US. The Senator pledged to end fracking on day-one of her administration, which would have ramifications for US energy independence. She plans to adopt the “Green New Deal” that would change the landscape for fossil fuels in the United States. The bottom line is that more than a few issues, and the unknown could trigger risk-off periods in markets across all asset classes, and commodities are no exception.