The raw material markets asset class moved higher in the second quarter of 2021 after posting gains in Q1. The commodity asset class consisting of 29 of the primary commodities that trade on US and UK exchanges moved 10.76% higher in Q2 than the level at the end of March and was 20.32% above the level for the year that ended on December 31, 2020. In 2020, the asset class moved 9.89% higher. In 2019 it gained 10.98%, but in 2018 the asset class lost 6.82% of its value.
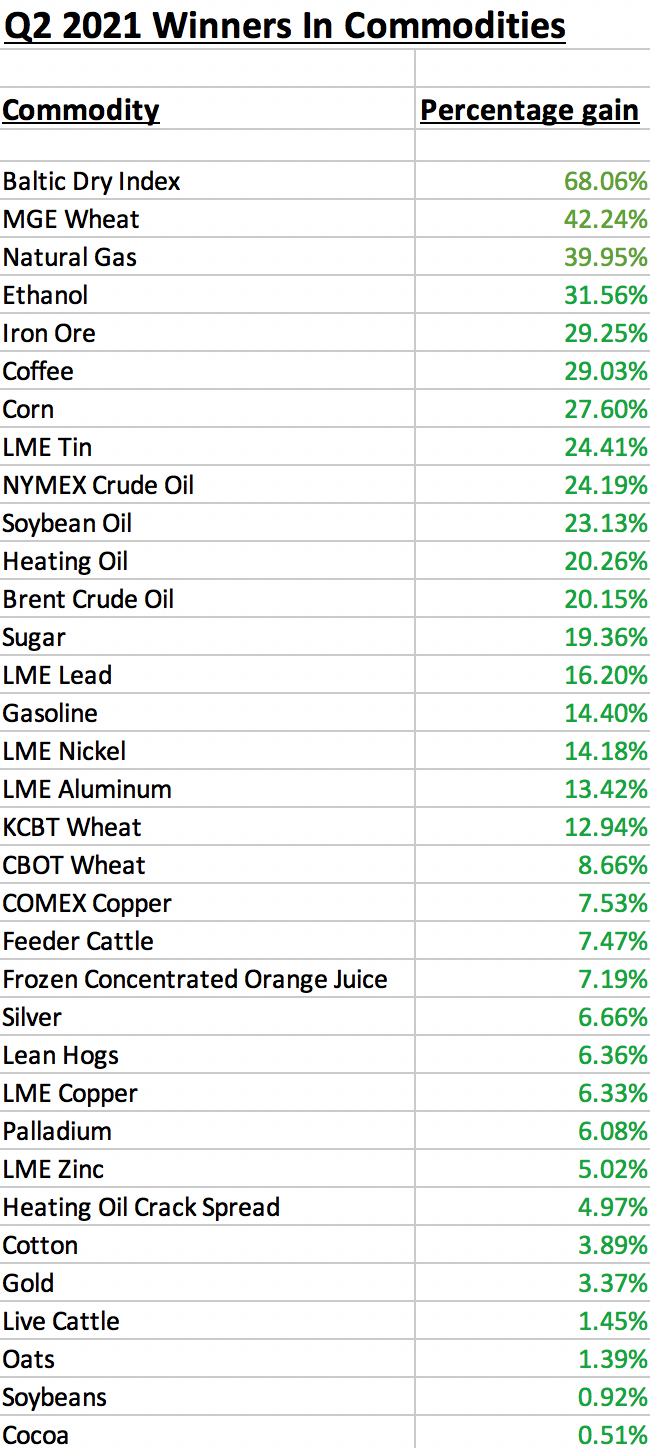
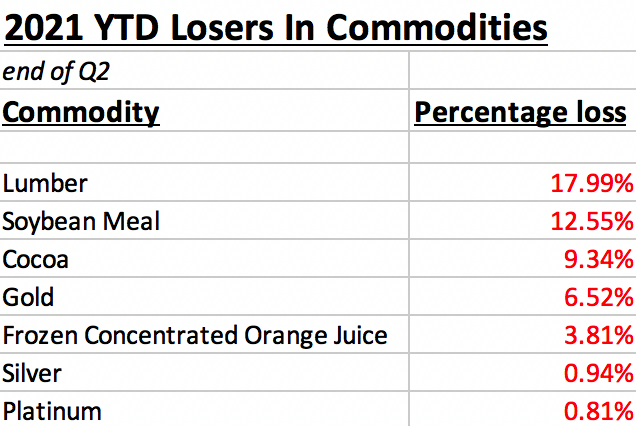
The overall winner of the 29 for the first quarter was the MGE wheat market that posted a gain of 42.24% in Q2 as dry conditions in the Pacific Northwest caused supply issues. NYMEX natural gas futures came in a close second place with a 39.95% gain. Ethanol, another energy commodity, was the third-leading market, posting a 31.56% price increase since March 31, 2021. The biggest loser for the quarter was the volatile and illiquid lumber market which fell 29.05%, but not before the price rose to a record high at over $1700 per 1,000 board feet in May. Soybean meal futures was the second worst-performing commodity with an 11.27% loss in Q2. Platinum fell 9.93% over the second quarter of 2021.
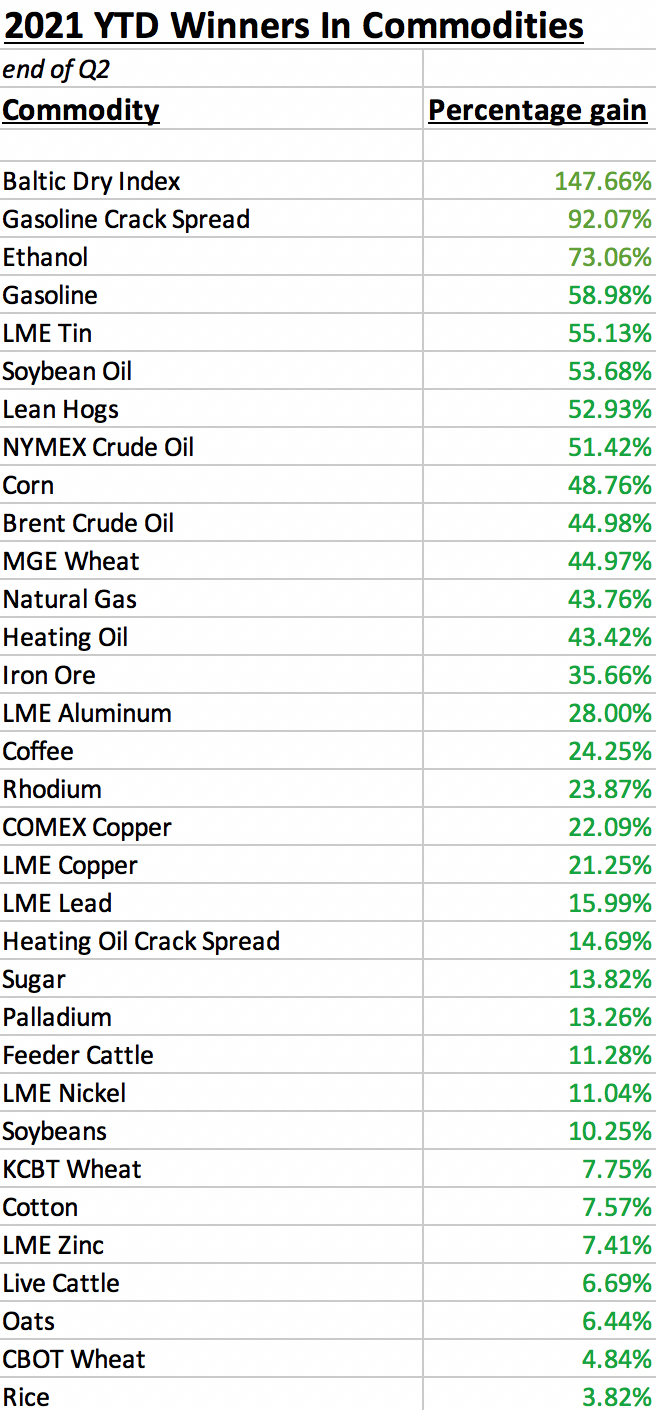
The Baltic Dry Index gained over 68%, while rhodium fell by over 23%.
There were lots of double-digit percentage gains in Q2. Twelve markets were over 20% higher during the three months; eighteen were up over 10%. Four markets posted double-digit percentage losses during the quarter. Winners outnumbered losers in the second quarter of 2021 by a margin of better than 5.6:1. In Q1, thirty-four commodities posted gains compared to six products with prices below the level at the end of March 31, 2021.
The US dollar is typically a significant factor for commodity prices, as it tends to have an inverse value relationship with raw material prices. The dollar index slipped 0.86% gain in Q2 after rising 3.72% in Q1 for a six-month increase of 2.92%. The dollar index was 0.34% higher in 2019 after moving 4.26% higher in 2018, which followed a 10.23% decline in 2017. The dollar edged lower in Q2 as the bond market recovered and the tidal wave of central bank liquidity and government stimulus lifted inflationary pressures. US 30-Year Treasury bond futures rose 3.84% in Q2 but was 7.10% lower over the first half of 2021.
All six sectors of the commodity asset class rally in Q2
Energy commodities led on the upside for the second consecutive quarter as the sector gained 25.08% in Q2. Over the first six months of 2021, energy commodities gained 52.60%. Base metals were the second-best performing sector, moving 13.26% higher, with a six-month gain of 23.14%. Soft commodities posted a 12% gain in Q2, turning a loss in Q1 into a 6.5% gain over the first half of 2021.
Grains moved 7.71% higher in the second quarter and were 14.82% higher from January through the end of June. Animal proteins moved 5.09% higher in Q2 and moved 23.64% since the end of 2020 as of June 30, 2021. Precious metals managed to eke out a 1.55% gain in the second quarter and posted a marginal 1.25% increase through the first six months of 2021.
All six sectors rallied in Q2 and posted gains over the first half of 2021 as of June 30.
Winners in Q2 and over the first half of 2021
Thirty-four commodity markets moved higher in Q2 2021.
The overall trend in the asset class remained bullish after moving higher each quarter starting in Q2 2020. Through the first six months of 2021, the following commodities posted gains:
Meanwhile, the bullish stampede in the stock market continued in Q1. The DJIA was 4.61% higher, the S&P 500 gained 8.17%, and the NASDAQ moved 9.49% to the upside. All three posted double-digit percentage gains in the first half of 2021.
The dollar index slipped 0.86% in Q2% but was 2.82% higher so far in 2021, which did not weigh on the overall commodity asset class this year. Meanwhile, Bitcoin, Ethereum, and digital currencies experienced parabolic rallies in Q1 and Q2, taking prices to all-time highs and the market cap to over the $2.4 trillion level before the parabolic move imploded and the two leading cryptocurrencies halved in value from the April and May 2021 highs.
Losers in Q2 and over the first half of 2021
Six markets moved lower in Q1.

Four commodities lost just over 10%. Winners outnumbered losers by over 5.6:1 in Q1.
Over the first half of the year, winners outnumbered losers by a 4.7:1 margin as the bull continues to charge higher in the commodities asset class.
Highlight on energy after it leads for two consecutive quarters
While energy commodities were up over 52.60% since the end of 2020, crude oil, natural gas, ethanol, and coal prices rose to multi-year highs.
Crude oil reached its highest price since October 2018 in late June.

As the monthly chart shows, crude oil was approaching the critical technical resistance level at $76.90 the October 2018, which is a technical gateway to the 2014 highs at over $100 per barrel.
Natural gas futures rose to the highest level since late 2018 at the end of June.

The monthly chart shows that after trading to a twenty-five-year low in June 2020, natural gas reached a peak at $3.814 at the end of June 2021. The energy commodity broke out to the upside with its next technical upside target at $4.929, the November 2018 high.
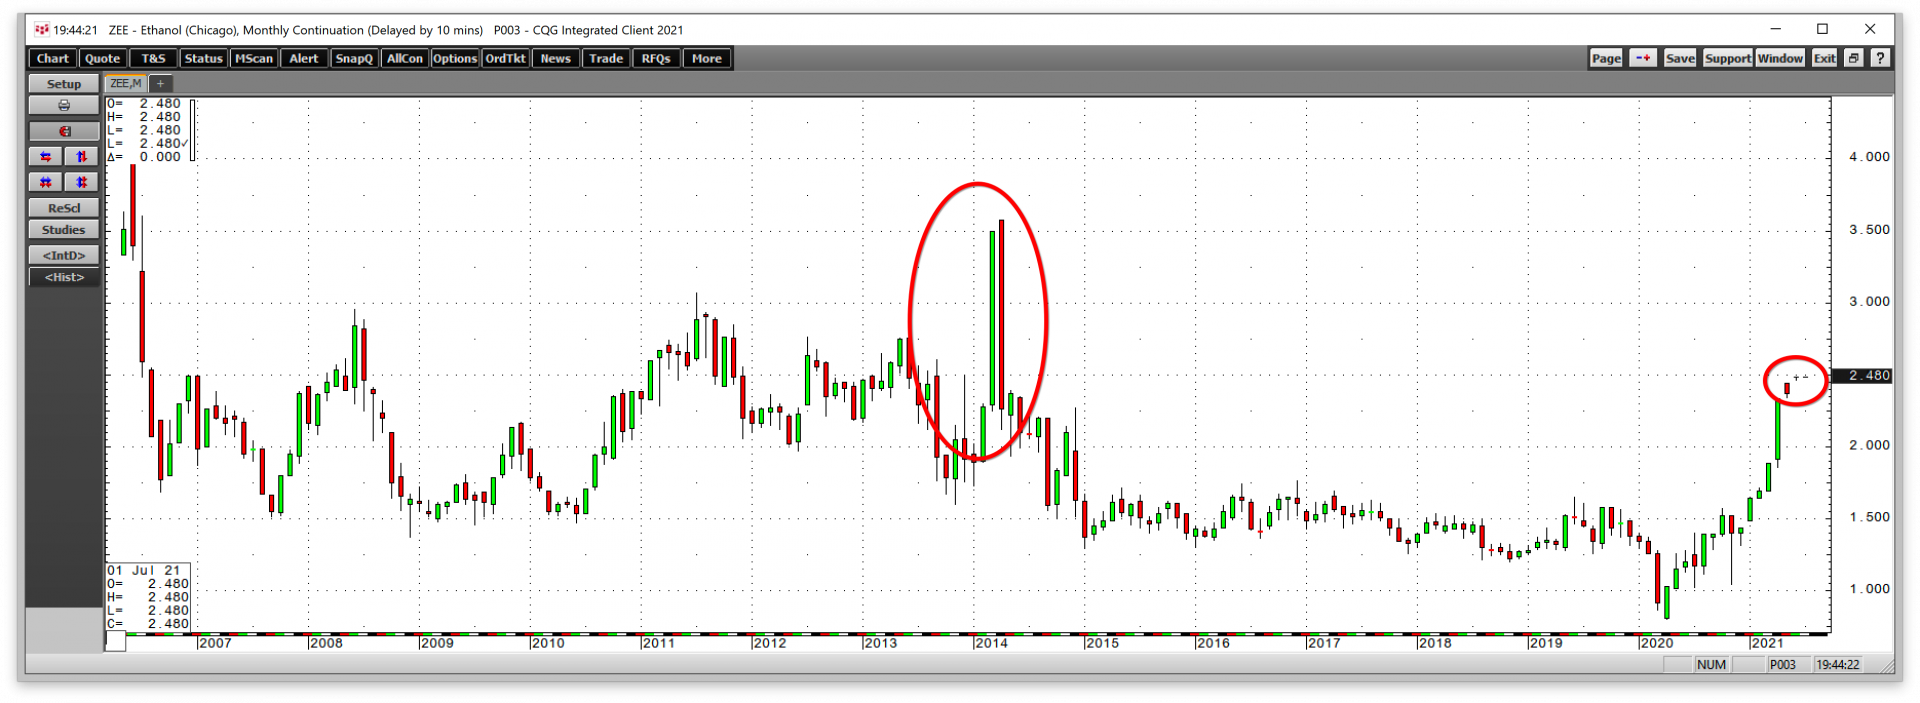
The chart shows that ethanol prices rose to $2.48 in Q2, the highest price level since April 2014. In 2014, crude oil was over $100 per barrel, gasoline was north of $3 per gallon, and natural gas hit a high of $6.493 per MMBtu.
To round out the bullish price action in the energy sector, thermal coal for delivery in Rotterdam rose to over $120 per ton, a level not seen in a decade since 2011.
The overall bullish price action in commodities in 2021 lifted energy prices as the world emerges from the global pandemic. Energy demand has been robust over the past months when monetary and fiscal policy stimulus is stoking inflationary pressures. Moreover, the shift in US energy policy towards a greener path means that production is not keeping pace with the demand, creating an almost perfect bullish storm for traditional energy and biofuel prices.
Expect volatility over the coming months for three reasons
As we head into Q3, three factors should create lots of price action in the commodities asset class:
- As the pandemic fades into our rearview mirrors because of vaccines creating herd immunity to COVID-19, the financial legacy of unprecedented monetary and fiscal stimulus is highly inflationary. Commodity prices thrive in an inflationary environment as the economic condition erodes money’s value.
- At the June FOMC meeting, the US central bank appeared to set the stage for tapering QE and increasing the short-term Fed Funds rate in 2022-2023, if not sooner. The central bank raised its forecast for GDP growth to 7% and its inflation expectations to 3.4% for 2021. A move towards tightening could cause increased volatility in markets across all asset classes. If inflation continues to rise, the Fed could find itself behind the curve, causing even more price variance.
- US tax increases and a long-overdue massive infrastructure rebuilding program are on the horizon before the 2022 mid-term elections. While the Biden administration has slim margins in Congress and the Senate, expect the President to push through initiatives over the coming months. More spending and higher taxes are likely to translate to lots of price volatility in markets.
The unforeseen events that occur always tend to move markets the most. No one saw the worst pandemic in a century coming at the end of 2019. The next issue that shocks the markets will likely appear out of the blue.
However, the many issues facing markets on the economic and political landscapes in the US and worldwide have the potential to cause wild price swings over the coming months. Fasten your seatbelts for a bumpy ride. Commodities rose by over 20% over the first half of 2021, and the bullish trend remains intact as we head into Q3.