At the most recent Fed meeting, the US central bank set the stage for ending quantitative easing in early March and liftoff from a zero percent short-term Fed Funds Rate at the March FOMC meeting. Bank of America expects the Fed to increase interest rates seven times in 2022, leading to a 1.75% rate. Meanwhile, the consumer price index rose by 7% in 2021. Excluding food and energy, the CPI was up 5.5%, and the producer price index increased by nearly 10%. Inflation is at its highest level in four decades. Crude oil’s ascent fuels the US and worldwide inflationary pressures as it is the energy commodity that continues to power the world.
At the start of February 2022, crude oil remains in a bull market, with technical and fundamental headwinds pointing to a challenge of the $100 per barrel level. Bull and bear markets tend to take prices to irrational, unreasonable, and illogical levels, as we witnessed in April 2020 when nearby NYMEX crude oil futures reached the lowest level since futures began trading in the 1980s. The NYMEX contract fell to a negative $40.32 per barrel as the global pandemic caused the demand to evaporate. Nearby Brent futures declined to $16 per barrel, the lowest price this century. Since then, crude oil has been on a staircase higher.
A bull market since April 2020
The move to a negative price came as there was no capacity to store crude oil in the US.
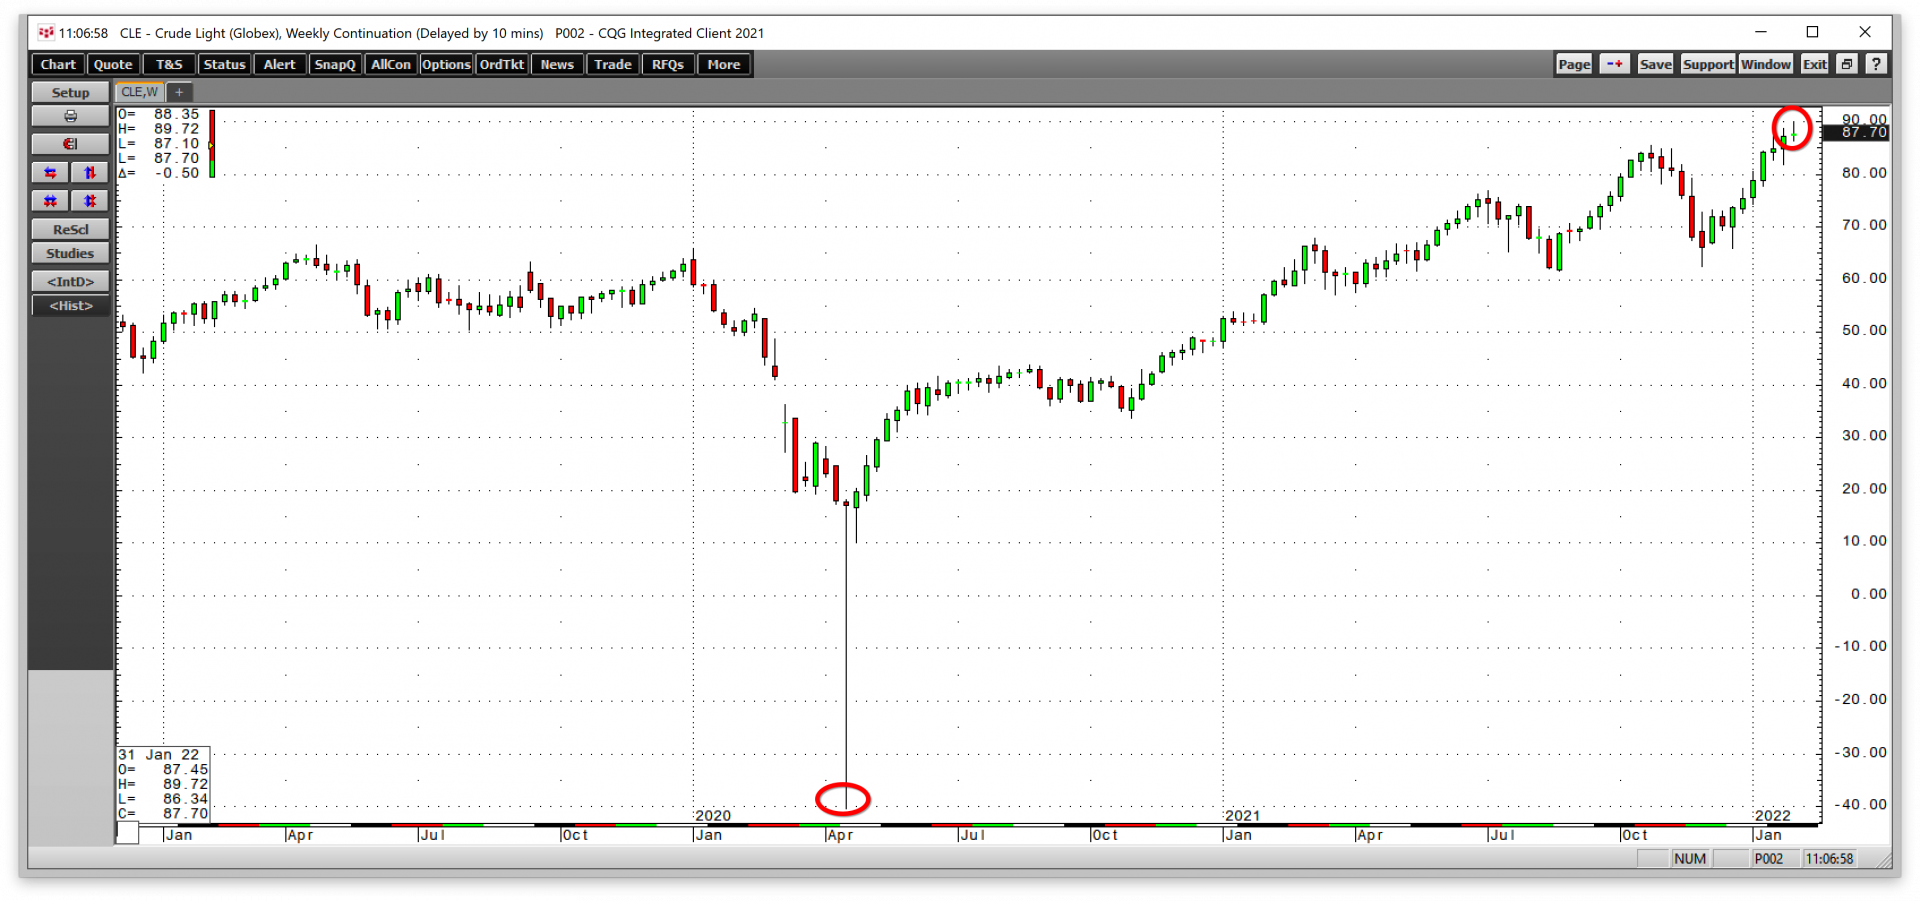
The weekly chart highlights the steady rally that has pushed the crude oil price from negative $40.32 in April 2020 to the most recent high of $89.72 per barrel on February 2 as nearby NYMEX WTI crude oil futures rose by an incredible $130.02 per barrel.
Taking the stairs higher and an elevator lower during corrections
The path to higher prices has not been without periodic speed bumps. While crude oil has climbed a bullish staircase, the corrections have been elevator rides on the downside.
After reaching a high of $80.72 per barrel on October 26, 2021, the March NYMEX futures price suffered a sharp correction that found a low in early December.

The daily chart of March futures illustrates the decline from $80.72 to a low of $62.05 on December 2, 2021, an over 23% correction. While the move lower was ugly, crude oil held its critical technical support level at the August 2021 $60.21 low on the March contract. The move to a higher low kept the bullish price trend intact.
A bullish technical break
Before the correction from late October through early December, crude oil had eclipsed its technical resistance level on the longer-term chart.
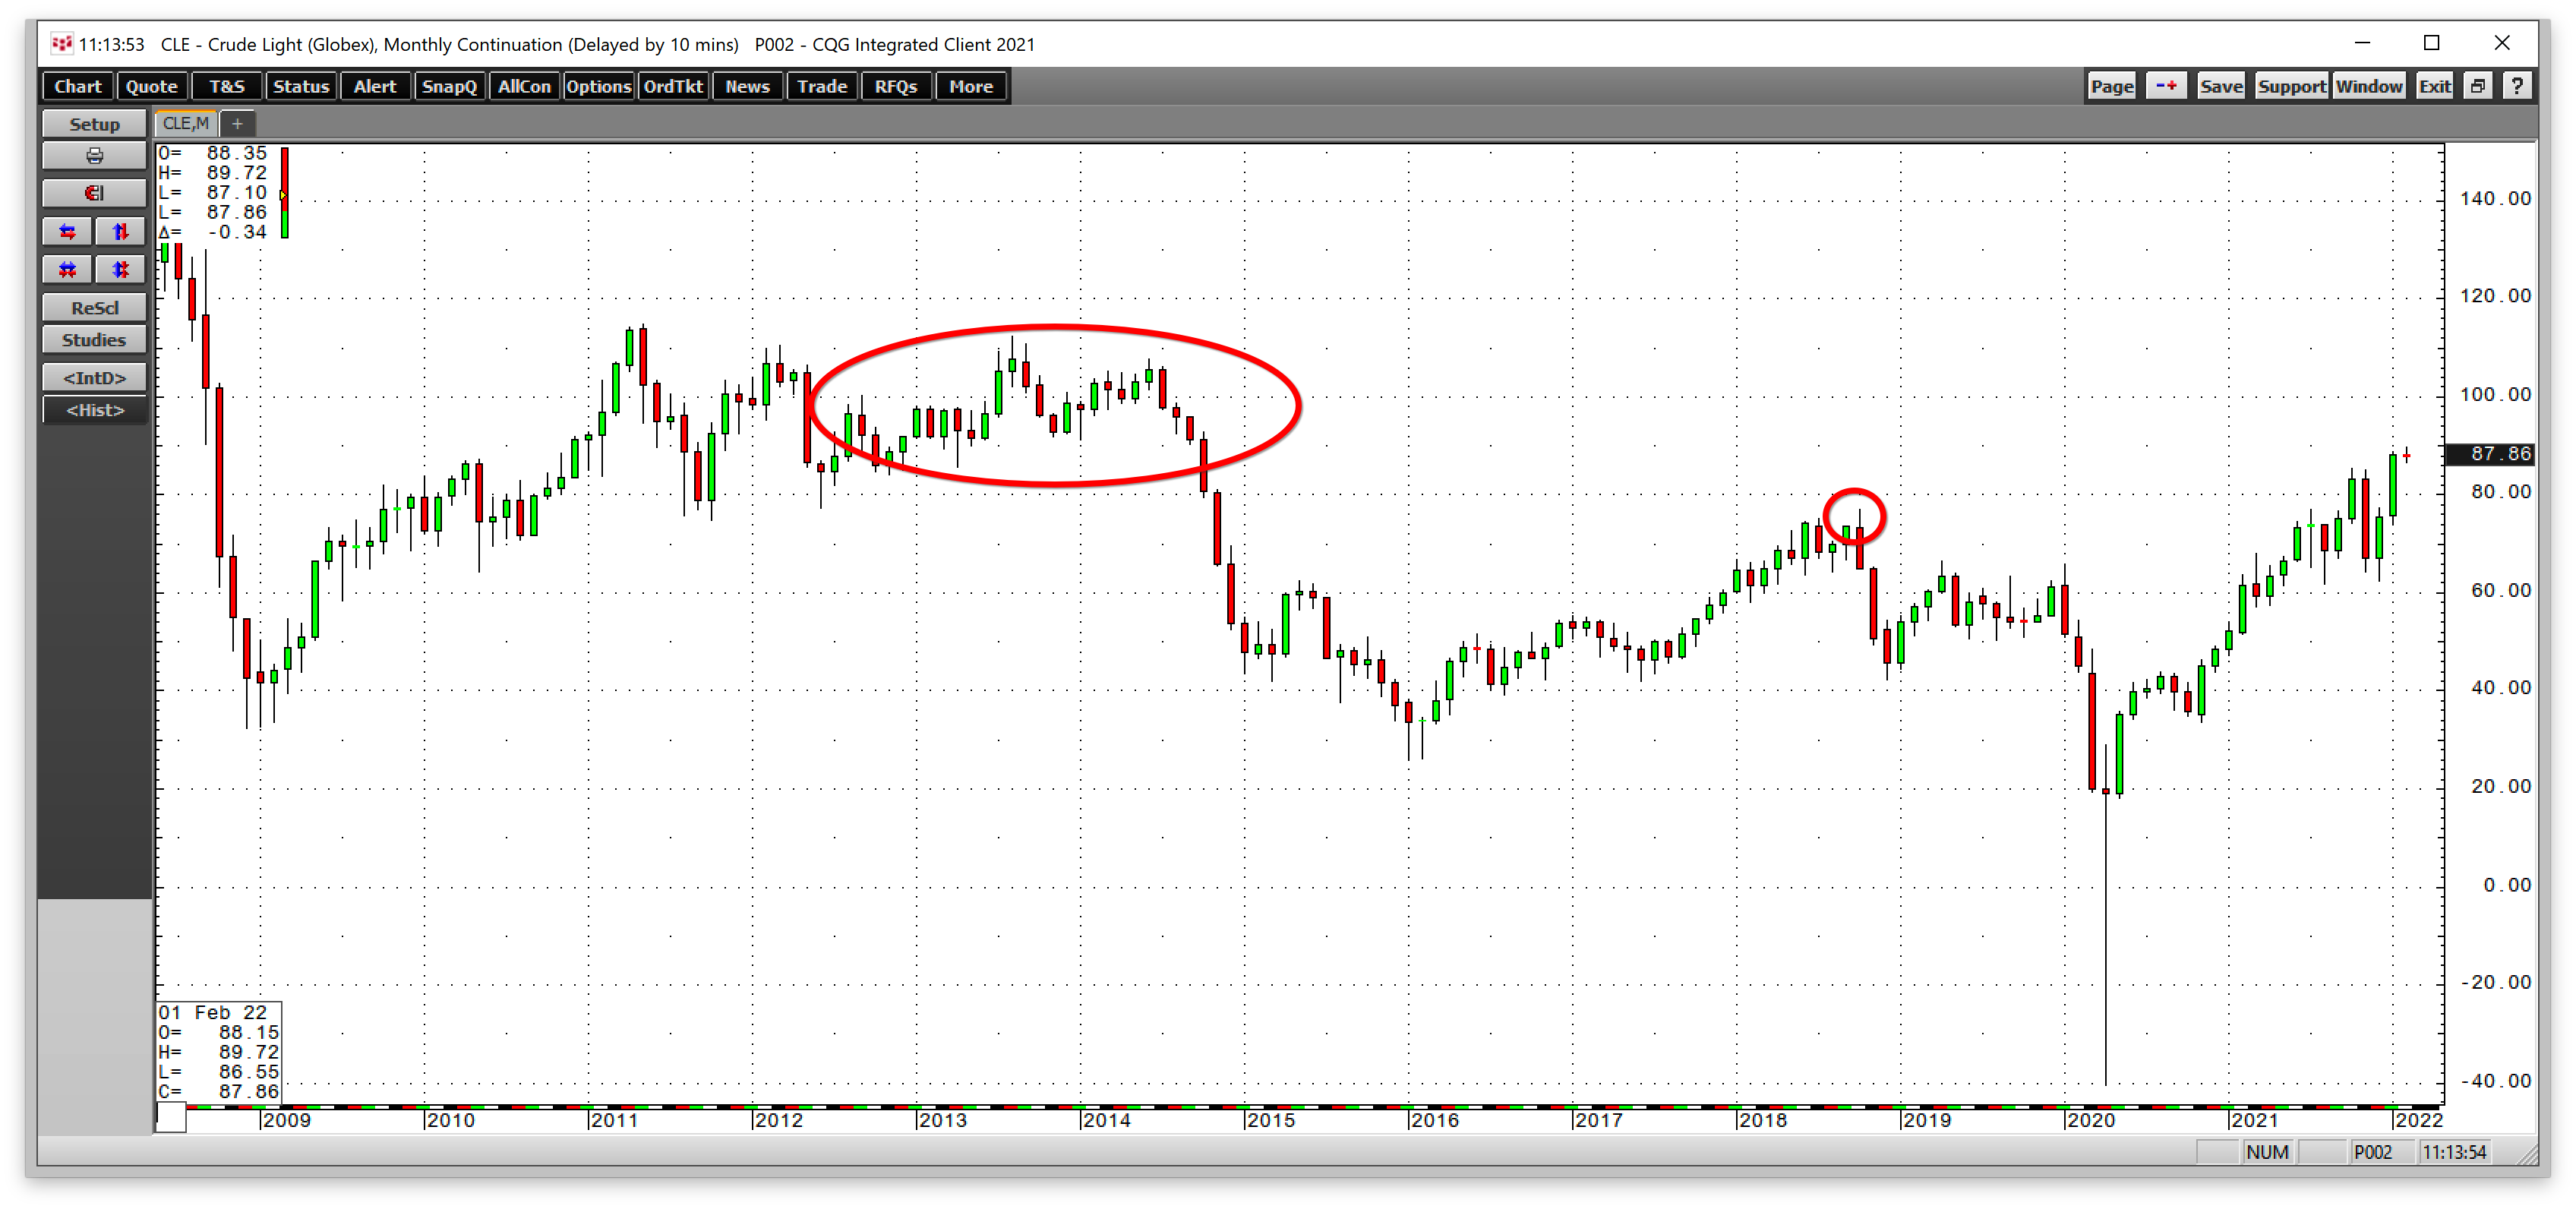
The monthly chart shows the move over the October 2018 high of $76.90, pushed the price to the highest level since 2014, the last time crude oil traded in the triple-digits. The $76.90 level stood as a gateway to $100 per barrel NYMEX crude oil.
Seven consecutive quarterly gains
Crude oil’s bullish trend since April 2020 has taken the price higher over the past seven consecutive quarters.
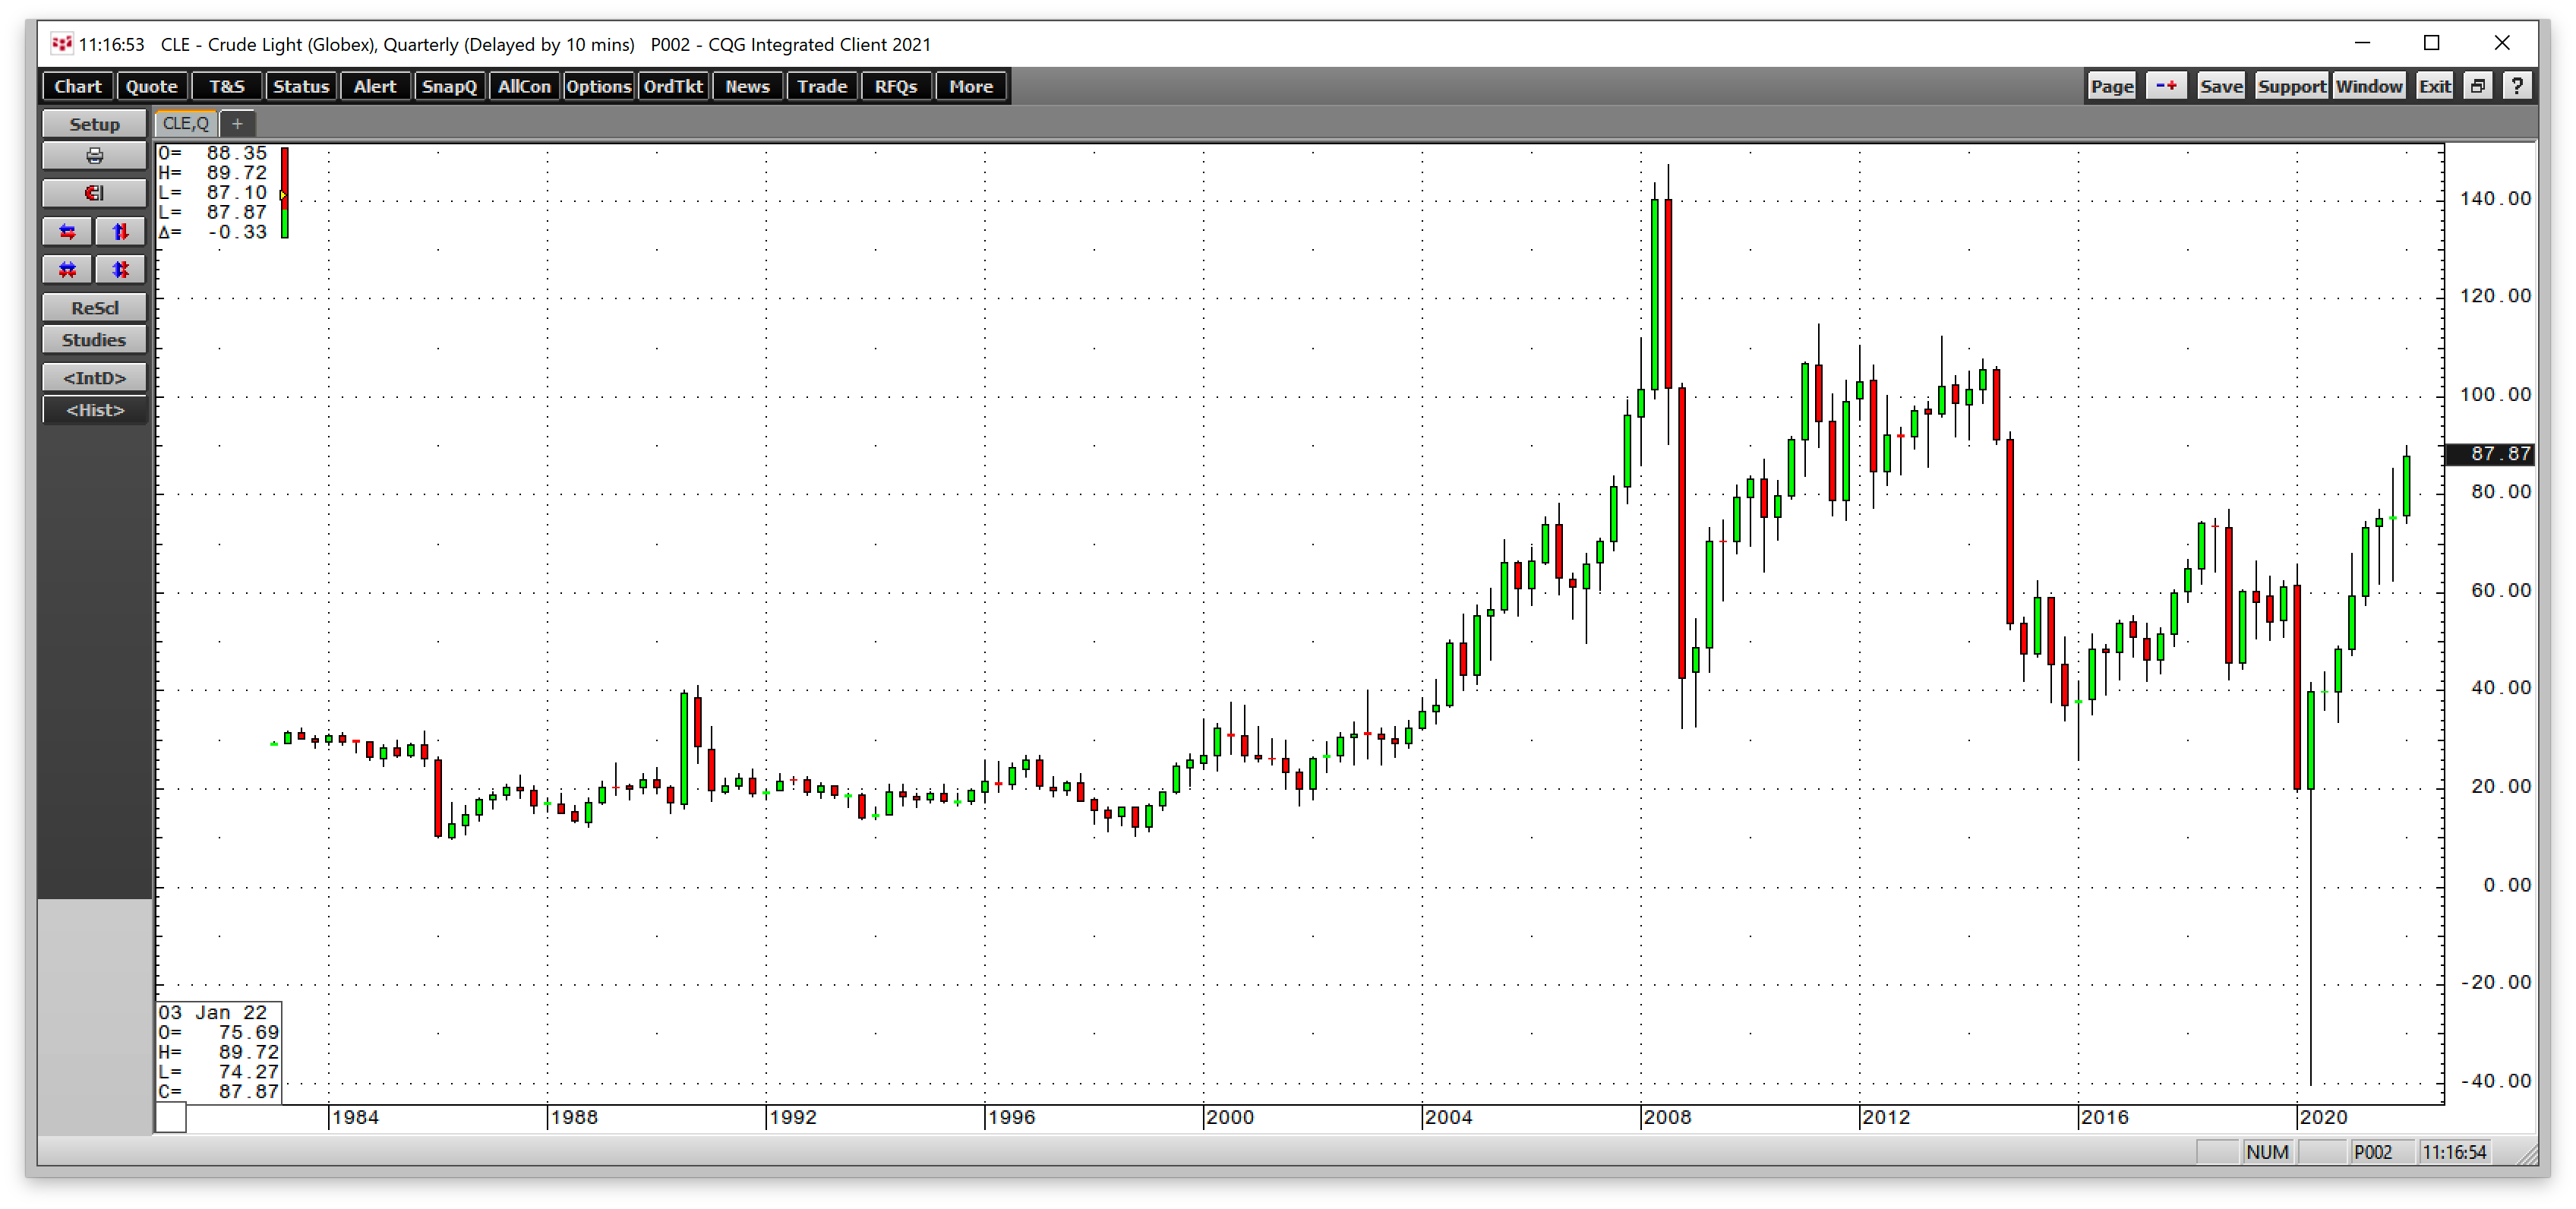
The quarterly chart shows that in Q4 2021, the energy commodity kept the bullish pattern going, as it settled at the $75.45 level, only 33.0 cents above the Q3 2021 closing price.
Meanwhile, $75.45 per barrel stands as the price NYMEX futures need to exceed on March 31, 2022. At nearly $88 per barrel on February 2, the price sits comfortably above that level.
Three reasons the energy commodity could challenge the 2008 high
While crude oil’s technical trend remains bullish, fundamental supply and demand factors support higher prices. At least three factors point to a continuation of rising prices, a challenge of the $100 per barrel level, and even a potential move to the 2008 all-time peak off $147.27 or higher:
- US energy policy addresses climate change by supporting alternative and renewable sources and inhibiting traditional fossil fuel production and consumption. Increased regulations and other factors have weighed on US output. As of the week ending on January 28, the Energy Information Administration reported that US output stood at 11.5 million barrels per day. US production has declined by 12.2% from a record 13.1 mbpd in March 2020. As the demand for energy rises, the US is producing fewer barrels.
- OPEC and Russia told markets they are only willing to taper production cuts by 400,000 barrels per day, despite US requests to increase the tapering and production as oil prices continue to rise. After a decades-long quest to achieve energy independence, US energy policy has handed the pricing power back to the cartel and Russians. OPEC+’s mission is the highest possible price for its members while balancing the supply and demand equation. Falling US output and increasing global demand means OPEC+ is in the driver’s seat for pricing. In 2021, the Biden administration twice requested the cartel to increase production, and twice OPEC+ refused. The cartel would rather sell one barrel at $100 than two at $50 per barrel.
- In any market, the trend is always your best friend. Fighting trends and picking tops or bottoms in markets is a dangerous game as they tend to overshoot on the upside, just as oil did on the downside in April 2020. The trend remains bullish, and we could be looking down at the $100 per barrel level over the coming months.
Crude oil is fueling inflation as the US favors an alternative path for energy production and consumption. Meanwhile, the world and US continue to depend on oil, and most US cars will remain gasoline-powered in 2022. On February 2, the nearby March NYMEX gasoline futures contract was trading at near the $2.60 per gallon wholesale level. It may not be long before gasoline prices are above $3 wholesale, a level not seen since 2014.
I remain bullish on crude oil and oil products in early February 2022. The driving season is right around the corner, with technical and fundamental factors pointing higher. The Fed may tighten credit to address inflation, but a rising oil market will continue to fuel the economic condition over the coming months.