The raw material markets moved lower in Q2 but were still higher than the level at the end of 2021. The commodity asset class consisting of 29 primary commodities that trade on US and UK exchanges moved 6.27% lower in Q2 2022 but was still 8.74% higher through the first six months of this year. The asset class moved 26.79% in 2021. The bull market in raw materials stalled in Q2 2022, but markets experienced a high price variance level.
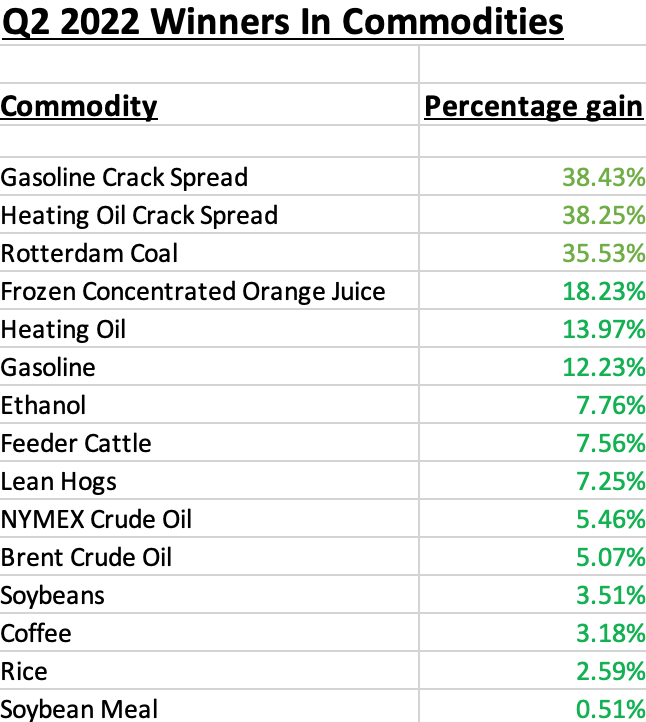
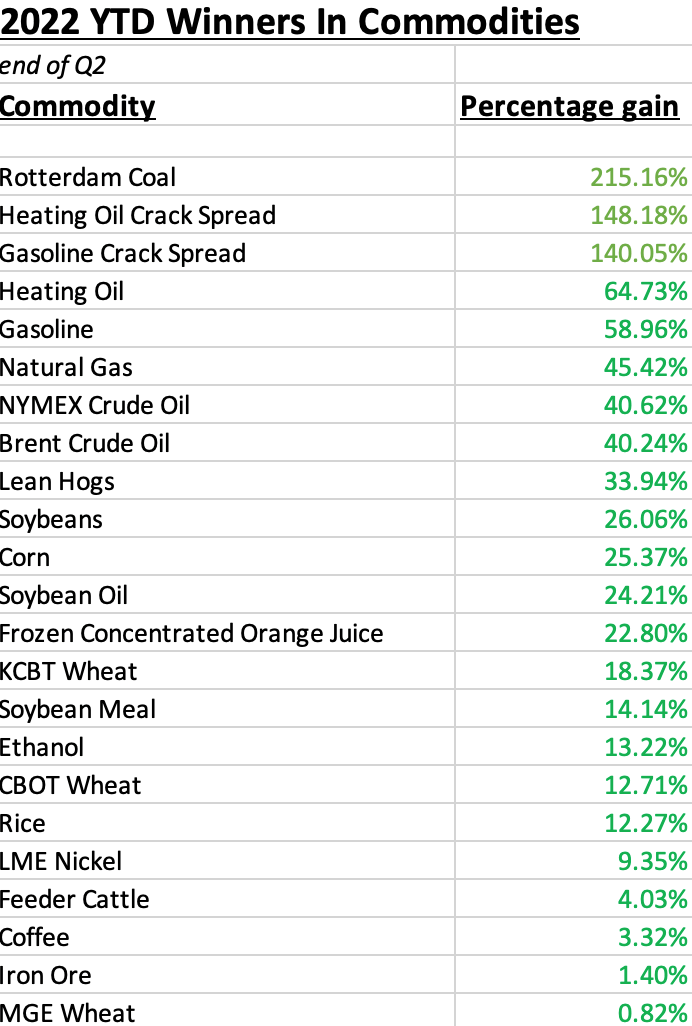
The overall winner of the 29 for the second quarter was the illiquid Rotterdam coal futures market for the second consecutive quarter that posted a gain of 35.53% and was 215.16% higher over the first half of 2022. Frozen concentrated orange juice futures were in second place with an 18.23% gain. NYMEX heating oil was 13.97% higher in the second quarter, and NYMEX gasoline gained 12.23% over the three months. Crude oil posted its ninth-consecutive quarterly gain.
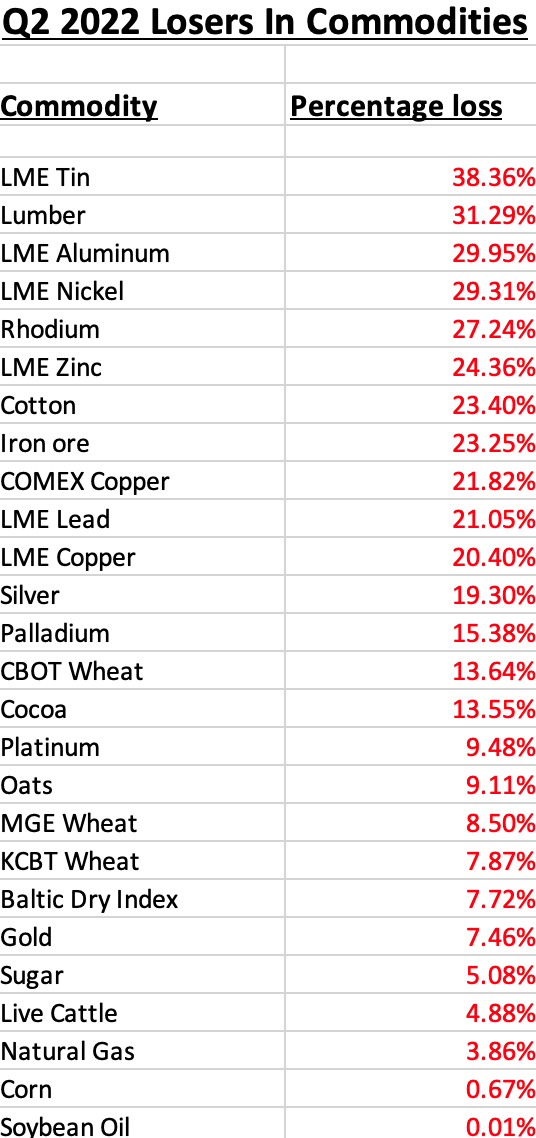
The biggest loser for the second quarter in the composite was the illiquid LME tin forward market which corrected 38.36% lower. Lumber fell 31.29%, and LME aluminum and nickel forwards dropped between 29% and 30%.
There were more losers than winners in Q2, but winners slightly outnumbered losers over the first six months of 2022.
The US dollar is typically a significant factor for commodity prices, as it tends to have an inverse value relationship with raw material prices. The dollar index rose 6.21% in Q2 and 9.28% so far in 2022 after rising 6.34% in 2021 and falling 6.42% in 2020. The Fed remains far behind the inflationary curve as CPI and PPI are at the highest levels in four decades.
US 30-Year Treasury bond futures fell 8.19% in Q2 and 13.75% over the first half of 2022 after moving 7.53% lower in 2021. Rising US interest rates pushed the dollar index higher, but inflation eroded the dollar’s purchasing power. The Fed is fighting inflation with demand-side monetary policy, but the supply-side issues caused by the war in Ukraine pushed food and energy prices higher, fueling inflation. The only two sectors that posted gains in Q2 were energy and animal proteins. A late quarter decline pushed the grains sector lower, but it only lost 3.46% in Q2.
The war in Ukraine, rising interest rates, and inflation caused stocks to decline in Q1 and Q2 2022. In Q2, the DJIA fell 11.25% and was 15.31% lower so far in 2022. The S&P 500 declined 16.45% in Q2 and 20.58% over the first half of the year. The tech-heavy NASDAQ dropped 22.44% in Q2 and 29.51% over the first six months of this year. In 2021, the DJIA was 18.73% higher. The DJIA rose 7.25% in 2020. The tech-heavy NASDAQ gained 43.64% in 2020 and 21.39% in 2021. The S&P 500 was 16.26% higher in 2020 and 26.89% in 2021.
As we head into Q3 2022, COVID-19's cost and the war in Ukraine will remain critical issues for markets. Liquidity and stimulus have increased the money supply and government deficits to staggering levels, which creates an inflationary and bullish landscape for raw material prices. The bond market and many commodities signaled rising inflationary pressures throughout 2021; the Fed only acknowledged the economic condition late last year. The effects of the pandemic could last for years or decades as the national debt ceiling is now well over the $30 trillion level. The supply-side economic issues created by the war and geopolitical tensions continue to impact the global economy.
Commodities are essential goods that feed, clothe, shelter and provide energy for people worldwide. Inflation and geopolitical concerns were a potent bullish cocktail for the commodities asset class in Q1 and Q2 2022. The asset class’s rally began in 2020 and continued with explosive moves over the first three months of 2022. In Q2, higher interest rates and a rising US dollar caused corrections. Bull markets rarely move in straight lines, and corrections can be brutal. At the end of Q2 2022, a commodity correction was in full bloom.
Expect lots of volatility to continue in the energy and food sectors as fighting inflation with monetary policy cannot address the shortages created by the war in Europe’s breadbasket. Moreover, Russia is Europe’s energy supplier, so shortages are likely over the coming months.
The bull market in commodities began in August 2020 when gold reached a record high at $2063 per ounce. As gold corrected, it passed the bullish torch to other raw material markets across all sectors. In Q1, 2022, gold rose to a marginal new record high at $2078.80, and many commodities moved to new all-time or multi-year peaks. Copper reached $5.01 per pound, but gold, copper, and all metals prices corrected by the end of Q2. Copper is a bellwether commodity, and its price broke through technical support at the end of Q2, closing at just above the $3.70 level and moving even lower on July 1. Copper is signaling that US GDP contracted in Q2, which will be the second consecutive quarterly decline, signaling a recession now grips the economy. Rising interest rates and high prices for goods and services create a stagflationary environment. The US central banks have few tools to deal with stagflation, a challenging economic beast. The decline in commodity prices at the end of Q2 should cool inflation, but with the Fed Funds Rate at 1.50%-1.75% and CPI above 8%, and PPI north of 10%, the Fed remains far behind the inflationary curve in Q3. Another 75-basis point hike, lifting the short-term rate to 2.25%-2.50%, is likely, but it is nowhere near the most recent inflation levels.
Moreover, each 75-basis point hike costs the Us government an additional $225 billion in funding the $30 trillion deficit. The bearish trend in stocks and bonds, the war in Europe, geopolitical tensions, and a divided US put the central bank in a no-win situation. Rising rates will choke economic growth, while a return to dovish policies would fuel even more inflation.
Q2 ended on a mostly bearish note for stocks, bonds, and commodities. Liquidity will likely decline over the summer months, leading to even more price variance as bids or offers evaporate when markets move lower or higher. Expect lots of price swings in markets across all asset classes and protect portfolios. The aftermath of the pandemic and war in Ukraine continues to be a toxic cocktail for wild price volatility.
Four of six sectors move to the downside in Q2
In Q2, energy led the way on the upside with a 6.77% gain. Animal proteins gained 3.31% thanks to gains in the feeder cattle and lean hog futures markets. The base metals composite dropped 27.24% and the four leading precious metals declined by an average of 12.91%. Rising interest rates and a strong dollar led to the correction. The soft commodities sector fell 4.12% led by losses in cotton and cocoa, and grains moved 3.46% lower.
While four of the six sector posted losses in Q2, four of six were still higher than the closing level on December 31, 2021.
Four of six sectors are higher over the first six months of 2022
The energy sector was the leader in in Q2 and over the first half of 2022 with a 43.86% gain for the six months ending on June 30. Grains moved 14.65% higher over the period. Energy and food prices have risen because of the war in Ukraine, which is a supply-side economic issue.
Animal proteins were 10.96% higher through the first half of this year, while soft commodities eked out a 1.46% gain. Losses in the metals markets in Q2, pushed base and precious metals into negative territory since the end of 2021 with 13.07 and 5.43% respective declines.
Winners for Q2 and the first half of 2022
From April through June 2022, fifteen products moved higher, with six posting double-digit percentage gains:
Since December 31, 2022, twenty-three commodities moved higher over the six months, with eighteen moving over 10% to the upside:
Losers for Q2 and the first half of 2022
Twenty-six commodities moved lower in Q2 2022 as losers outnumbered the winners by nearly 2:1. Sixteen commodities posted double-digit percentage declines:
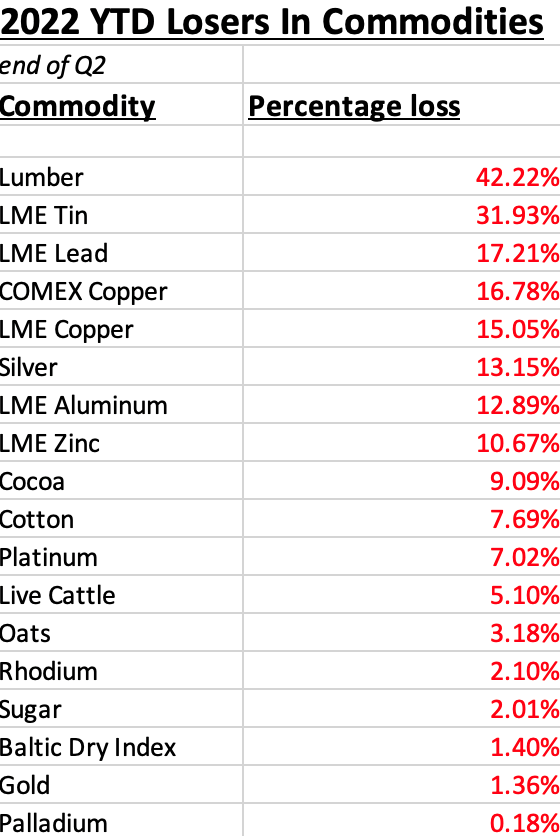
Eighteen commodities moved lower over the first six months of 2022, with eight posting double-digit percentage losses:
The CFTC defines cryptocurrencies as commodities. Bitcoin fell 58.78% in Q2 and moved 59.08% lower from the end of 2021 through June 30, 2022, after rising 57.81% in 2021.
Ethereum was 391.75% higher in 2021. In Q2 2022, Ethereum fell 69.05% and was 72.13% lower over the first six months of 2022. The asset class’s market cap moved 182.18% higher in 2021. In Q2 2022, it declined 59.28% and was 60.81% lower over the first half of 2022.
The only bull market in cryptos in Q2 was the number of tokens coming to market, which rose 7.69% to 20,070 tokens.
Looking forward to Q3 and beyond in commodities
The economic costs of the global pandemic will be its legacy, and they are staggering. The liquidity and stimulus will influence markets over the coming months and years. The US bond reminded us of that in 2021 and the first half of 2022, as interest rates rose. The Fed has started to aggressively increase rates, which chokes economic growth when GDP is contracting.
While monetary policy will impact markets, the war in Europe will turbocharge volatility, making the central bank’s actions far less influential in markets. The war and geopolitical bifurcation affect production, trade deals, and logistics, causing shortages in some regions and oversupply in others. Prices are likely to be highly volatile, reflecting significant changes in the supply and demand equations for many raw material markets.
As we head into Q3, the stock market is on a bearish “whack-a-mole” path, and bonds are trending lower. The bullish commodities relay race mostly paused at the end of Q2 after many asset class members rose to a new record or multi-year high prices and retreated. I expect raw material prices to continue to make higher lows and higher highs over the coming months and years. Inflation is a vicious beast, and it continued to rise in Q2. Stagflation is an even more insidious economic animal, and the Fed has few if any tools to combat the condition.
Copper is a bellwether metal that signaled economic contraction in late Q2.
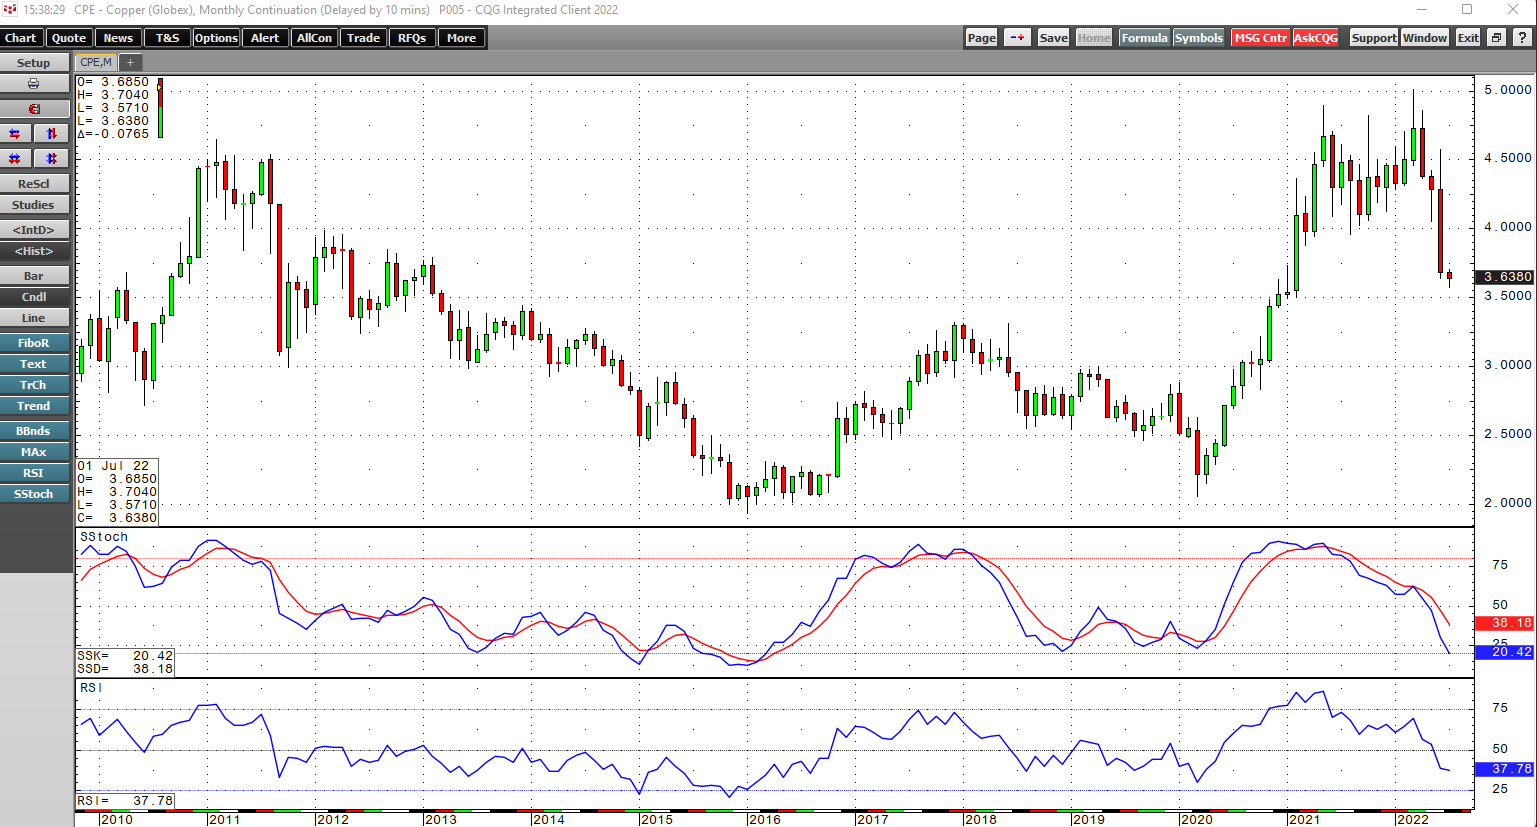
The chart highlights the decline in COMEX copper futures below the critical support level at the August 2021, $3.9615 low. Copper is telling markets to expect Q2 GDP to decline for the second consecutive quarter, signaling a recession. The highest inflation in decades and a recession is the textbook definition of stagflation.
Money’s purchasing power continues to decline, and the dollar is losing its status as the world’s reserve currency despite its rise against the euro and other reserve currencies. The bifurcation between nuclear powers creates a dangerous geopolitical landscape, and Russia’s invasion of Ukraine could set the stage for Chinese reunification with Taiwan later this year or in 2023. Now that the primary season is ending, the US mid-term election season will move into full swing in Q3 with the voting in November. Expect the unexpected in markets across all asset classes, and you will not be disappointed.
I remain a cautious bull for commodity prices, but as they reminded us in Q2, bull markets rarely move in straight lines and corrections can be brutal. Be careful out there in markets as volatility is likely to continue in Q3 as liquidity during the summer months declines.