First things first, I freely admit that there are potentially hundreds of views of technical analysis. Nevertheless, in this article I hope to clearly outline what I feel are two of the most important and dominant views within the field of chart analysis, namely one of the most popular CTA/Hedge Fund views and that of the Commercial Hedger.
I. The CTA/Hedge Fund View
One of the most popular views of technical analysis within the Commodity Trading Advisor/Hedge Fund community is that of long-term trend followers. Examples of these players include John W. Henry, Dunn Capital and so on. These proponents of technical analysis believe that prices trend and use charts to determine:
- What is the "trend": bullish, bearish or neutral?
- Where do we place our protective stops once we are long or short?
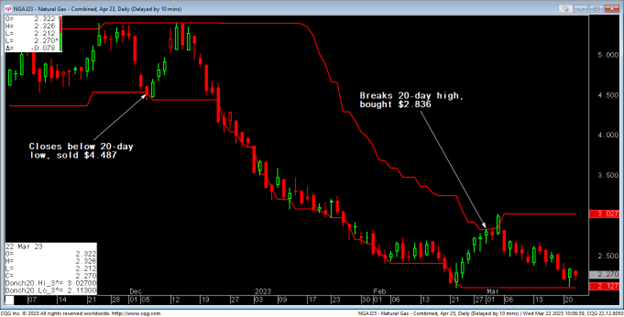
Using technical analysis in this manner, they tend to focus on simple but robust tools such as moving averages, Donchian channels (see Figure 1 below), Bollinger Bands and Average True Range to determine the answers to the two questions posed above. Perhaps as importantly, they tend to dismiss "predictive" technical analysis such as seasonals, cycles and Elliot Wave theory.
Learn more about CQG's solutions for commercial grains
Other tools that they tend to dismiss are traditional support and resistance level theories of technical analysis as well as fundamental analysis (supply, demand, geopolitics, weather and so on).
II. The Commercial Hedger View
Let's contrast the long-term trend following view of technical analysis with that of most commercial hedgers. First, it is important to admit that some commercial hedgers don't use technical analysis at all and instead rely solely on their intimate knowledge of fundamentals (including supply, demand, geopolitics, weather and so on).
Disclaimer aside, among hedgers that do look at the charts I'd argue that they tend to focus on intermediate to long-term support and resistance levels. The reason behind their reliance on historical levels is based on two of the most famous cliches in the commodity business,
"The cure for low prices is low prices" and,
"The cure for high prices is high prices."
Generally speaking, when prices fall below the cost of production, it creates a disincentive for producers to bring commodities to market, thereby eventually resulting in higher prices. By the same token, historically high prices tend to lead to demand destruction which in turn results in lower prices. Given these tendencies, commercial hedgers tend to rely upon long-term support and resistance levels to clue them in to where producers and consumers historically have reduced their selling and buying in the market (see Figure 2 below)
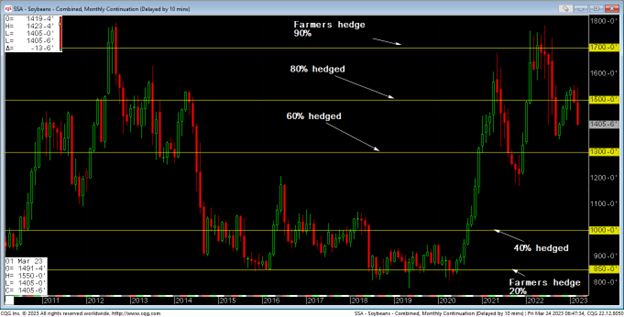
Figure 2: Monthly Soybean Chart shows farmers hedging more aggressively at historically high levels and less aggressively at historically low levels.
However, one big caveat to historical support and resistance levels is the possibility of an intermediate to long-term paradigm shift in the perception of value of the commodity. This possibility of a paradigm shift is in fact why commercial hedgers tend to augment technical analysis with fundamental analysis and the reason why long-term trend follower Richard Dennis famously stated, "Support and resistance mean nothing." (Compare Figures 3 and 4 below).
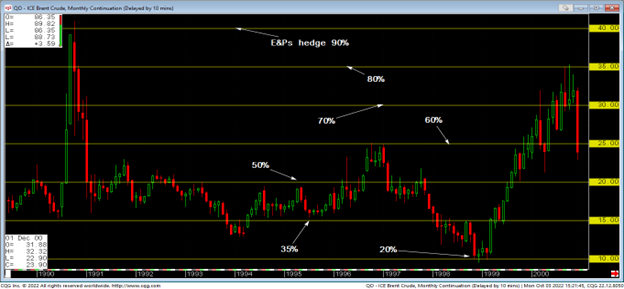
Figure 3 – Long-term support and resistance level in Brent Crude Oil (1989-2000)
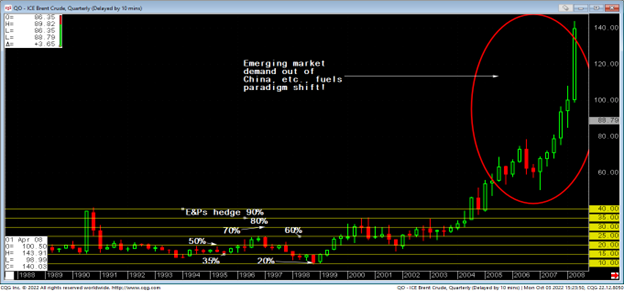
Figure 4 – Paradigm shift in Brent Crude Oil changes long-term support and resistance levels
Nevertheless, as you can see in Figure 5 (see below), post-paradigm shift support and resistance levels have served commercial hedgers well since 2008 in Brent Crude Oil. In conclusion, I hope that this article illuminates how seemingly contradictory views on technical analysis can both add value depending on whether you are a speculator or a commercial hedger.
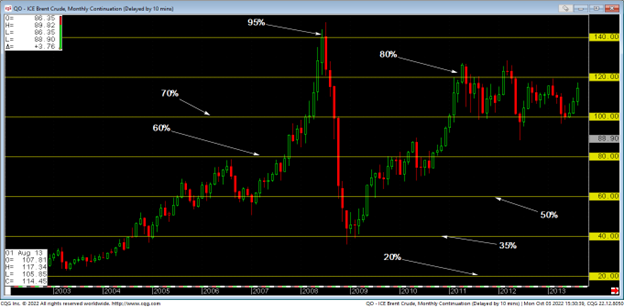
Figure 5 – Long-term support and resistance levels prove valuable to commercial crude oil hedgers since 2008.
About the Author: Mr. Richard Weissman is one of the world's foremost authorities and thought leaders in the fields of derivatives, risk management and technical analysis. He is the author of Trade Like a Casino: Find Your Edge, Manage Risk and Win Like the House (Wiley, 2011) which was a finalist for the 2012 Technical Analyst Book of the Year Award.
As President of Weissman Consulting LLC Richard provides state-of-the-art training and consulting solutions for traders, risk managers and professionals supporting traders and risk managers. He can be reached at: richard@weissmanconsulting.com