Candlestick charts reveal some very powerful truisms. The candlestick chart graphics are based upon the most consistent investment indicator in the world, - human nature. Candlestick analysis has been in existence for hundreds of years. Japanese rice traders have identified signals and patterns that produce expected results based upon investor sentiment. If candlestick signals and patterns did not produce high probability expected results, they would not be around today.
The Japanese rice traders did not become wealthy using Candlesticks, they became 'legendarily' wealthy. They were the financial powerhouse in Japan for many decades.
Whether a trader or a money/hedge fund manager, applying the common-sense aspects of candlestick signals and patterns improve the ability to evaluate trend movement much more accurately. Candlestick signals and patterns are not conjecture. They indicate the actual decisions occurring between the bulls and the bears.
The logic is simple! Candlestick analysis is the graphic depiction of everybody buying and selling during a specific time frame. It is not delegated to any specific trading market or entity. It is the graphic depiction of human nature. Anything that involves investor fear and greed, which is all trading entities, market indexes, ETF's, stocks, commodities, currencies, tulip bulbs, can be evaluated with much greater accuracy using candlestick analysis.
The Japanese rice traders have very simple philosophies. Where do most people sell? They panic sell at the bottom! Where do most people buy? They buy exuberantly at the top! Candlestick charts provide formations that reveal when panic selling and exuberant buying is occurring. Have you ever wondered why when the news was terrible and you sold your position during strong selling, it immediately turned around and started heading up? Or when the news was positive and everything looks bullish, you were buying and then the stock price turned around and headed back down? That is the normal reaction of human nature. The question becomes 'who is buying at the bottom?' And 'who was selling into the exuberant buying at the top?' It was the smart money.
Candlestick analysis identifies when you should be buying and when you should be selling, the opposite of what most investor do. Investors gain a huge advantage utilizing candlestick information to being able to put 'all the stars in alignment!' First, the candlestick visuals will indicate reversals and/or direction of the overall market trends. If the market is revealing an uptrend, simple candlestick scanning techniques will reveal which sectors are showing the strongest signals. The same scanning techniques can then reveal which individual stocks are demonstrating the strongest upside potential in that sector. The same process can be used for identifying the strongest bearish sectors and bearish stock positions, in those sectors, in a market downtrend.
There are approximately 50 or 60 candlestick signals. But there are only 12 major signals of relevance, six longs and six shorts. The '12 major signals' produce the strongest reversal indications. They are also the signals that occur the most often. This is a very important factor to remember. Once you learn the 12 major signals, you will start gaining control of your investment perspectives. The remaining 50 - 60 candlestick signals do not occur often enough to spend a lot of mental time and energy trying to learn what their results produce. The Japanese rice traders not only identified high probability price reversal signals, they also explained what investor sentiment was doing to create the reversal signals and patterns. This combination allows investors to analyze price movements with the same insights as an investor with 50 years of investment experience.
The chart signals and patterns work on all time frames. They are effective for the short-term trader/daytrader utilizing a one-minute, five-minute, ten-minute chart analysis combinations. Long-term hold periods would utilize the daily, weekly, and monthly chart evaluations.
Assume the majority of all investment decisions are based upon fundamental reasoning/research. Candlestick signals and patterns are developed based upon fundamental influenced decision-making, the accumulative result of buying and selling during specific time frames.
But Candlestick analysis also utilizes technical analytical tools to confirm 'why' buying and selling is occurring at specific levels. Witnessing a candlestick 'buy' signal at a major support level, such as a moving average or trend line, reveals where investment decisions are being activated. Witnessing a candlestick sell signal at a resistance level dramatically improves the probability the sellers are taking control.
Putting all the stars in alignment
Obviously, bullish stock prices are likely to perform better when the market indexes are in an uptrend. Bearish stock prices are going to perform better when the market indexes are showing a downtrend. Simple candlestick scanning techniques can also identify which sectors are showing the greatest strength in relation to the general market move. The same simple scanning techniques can then identify which individual stock charts are showing the strongest signals and patterns.
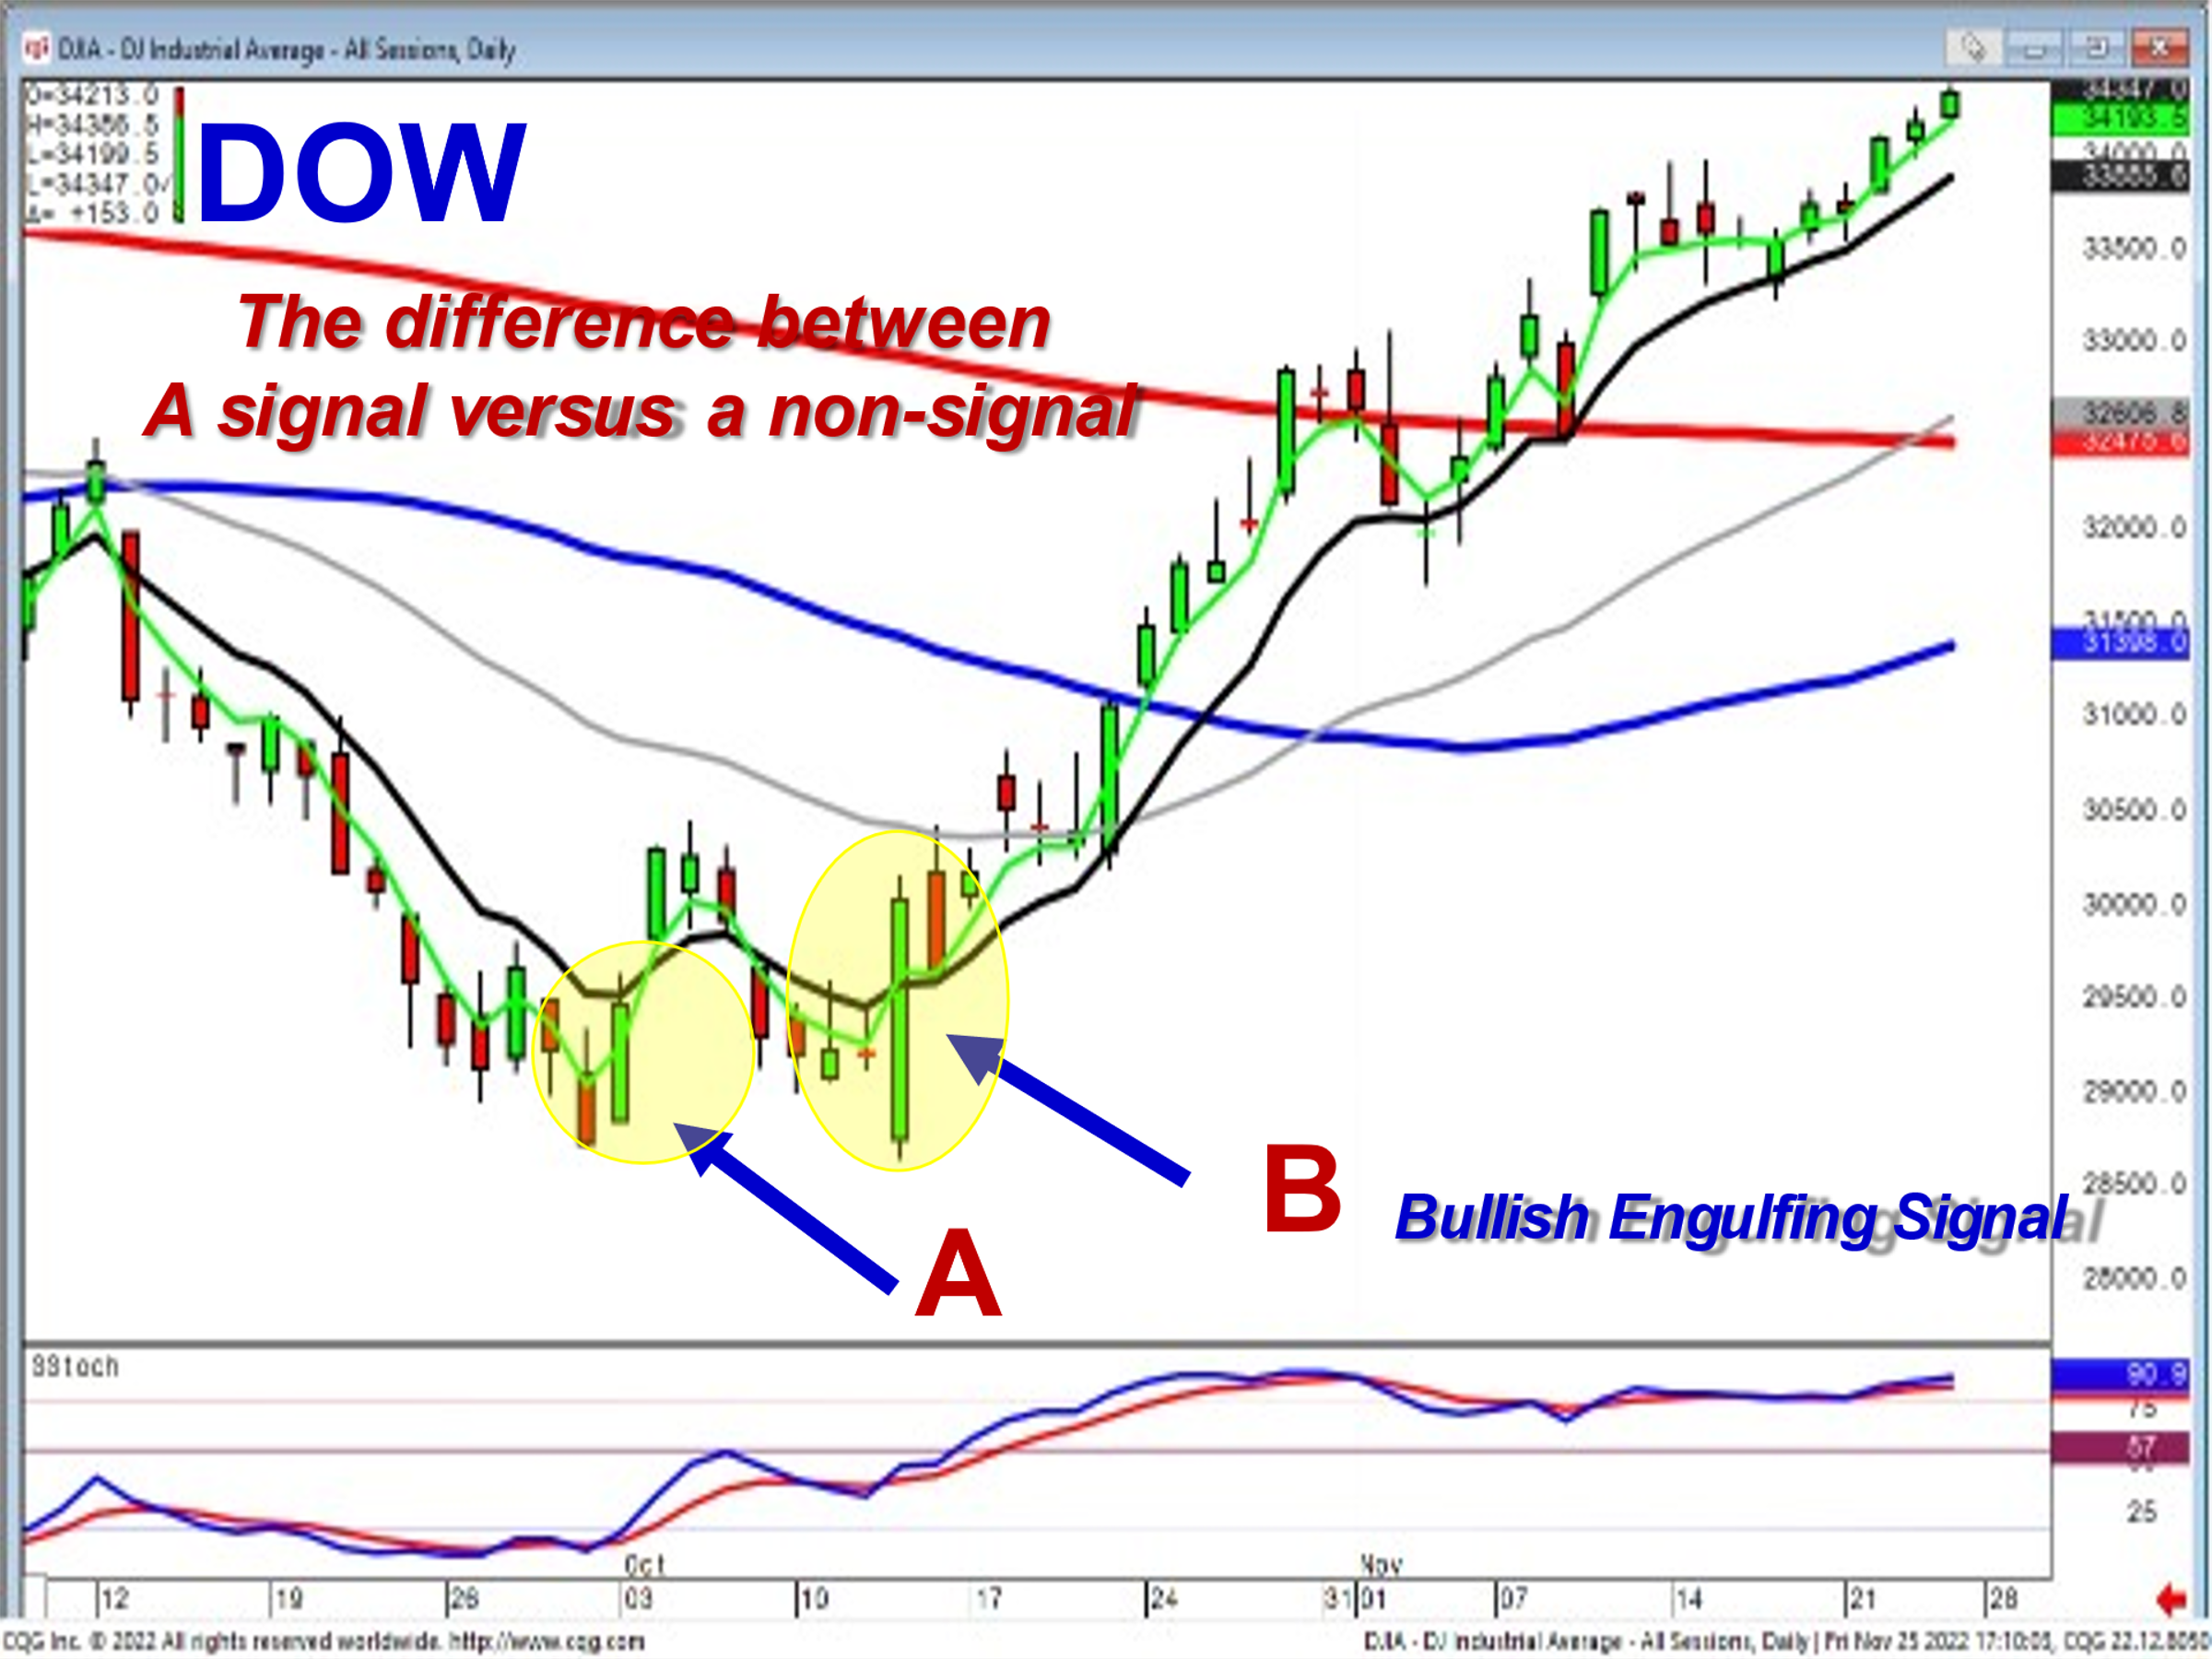
The Dow chart illustrates the relevance of candlestick signals versus non-signals. Point A shows bullish trading but it is not a reversal signal. Why is this relevant? The Japanese rice traders have had 400 years of observing and analyzing price move formations. It can be assumed if the formation at point A had strong prospects of a reversal in investor sentiment, the Japanese rice traders would have identified it as a reversal signal and described what investor sentiment was doing to make it a reversal.
Point B is one of the 12 major signals, a Bullish Engulfing signal. This produces much greater probabilities that a reversal is now in progress. It also produced additional bullish confirmation of closing above the T line. The strong market reversal signal in the Dow would then instigate scanning for the strongest bullish stock charts.
The same logic would be applied when witnessing sell signals in the overbought condition in the market indexes. As demonstrated in the next Dow chart, witnessing candlestick sell signals at a potential resistance level, the 200-day moving average, allows the candlestick investor to see what changes are occurring in investor sentiment.
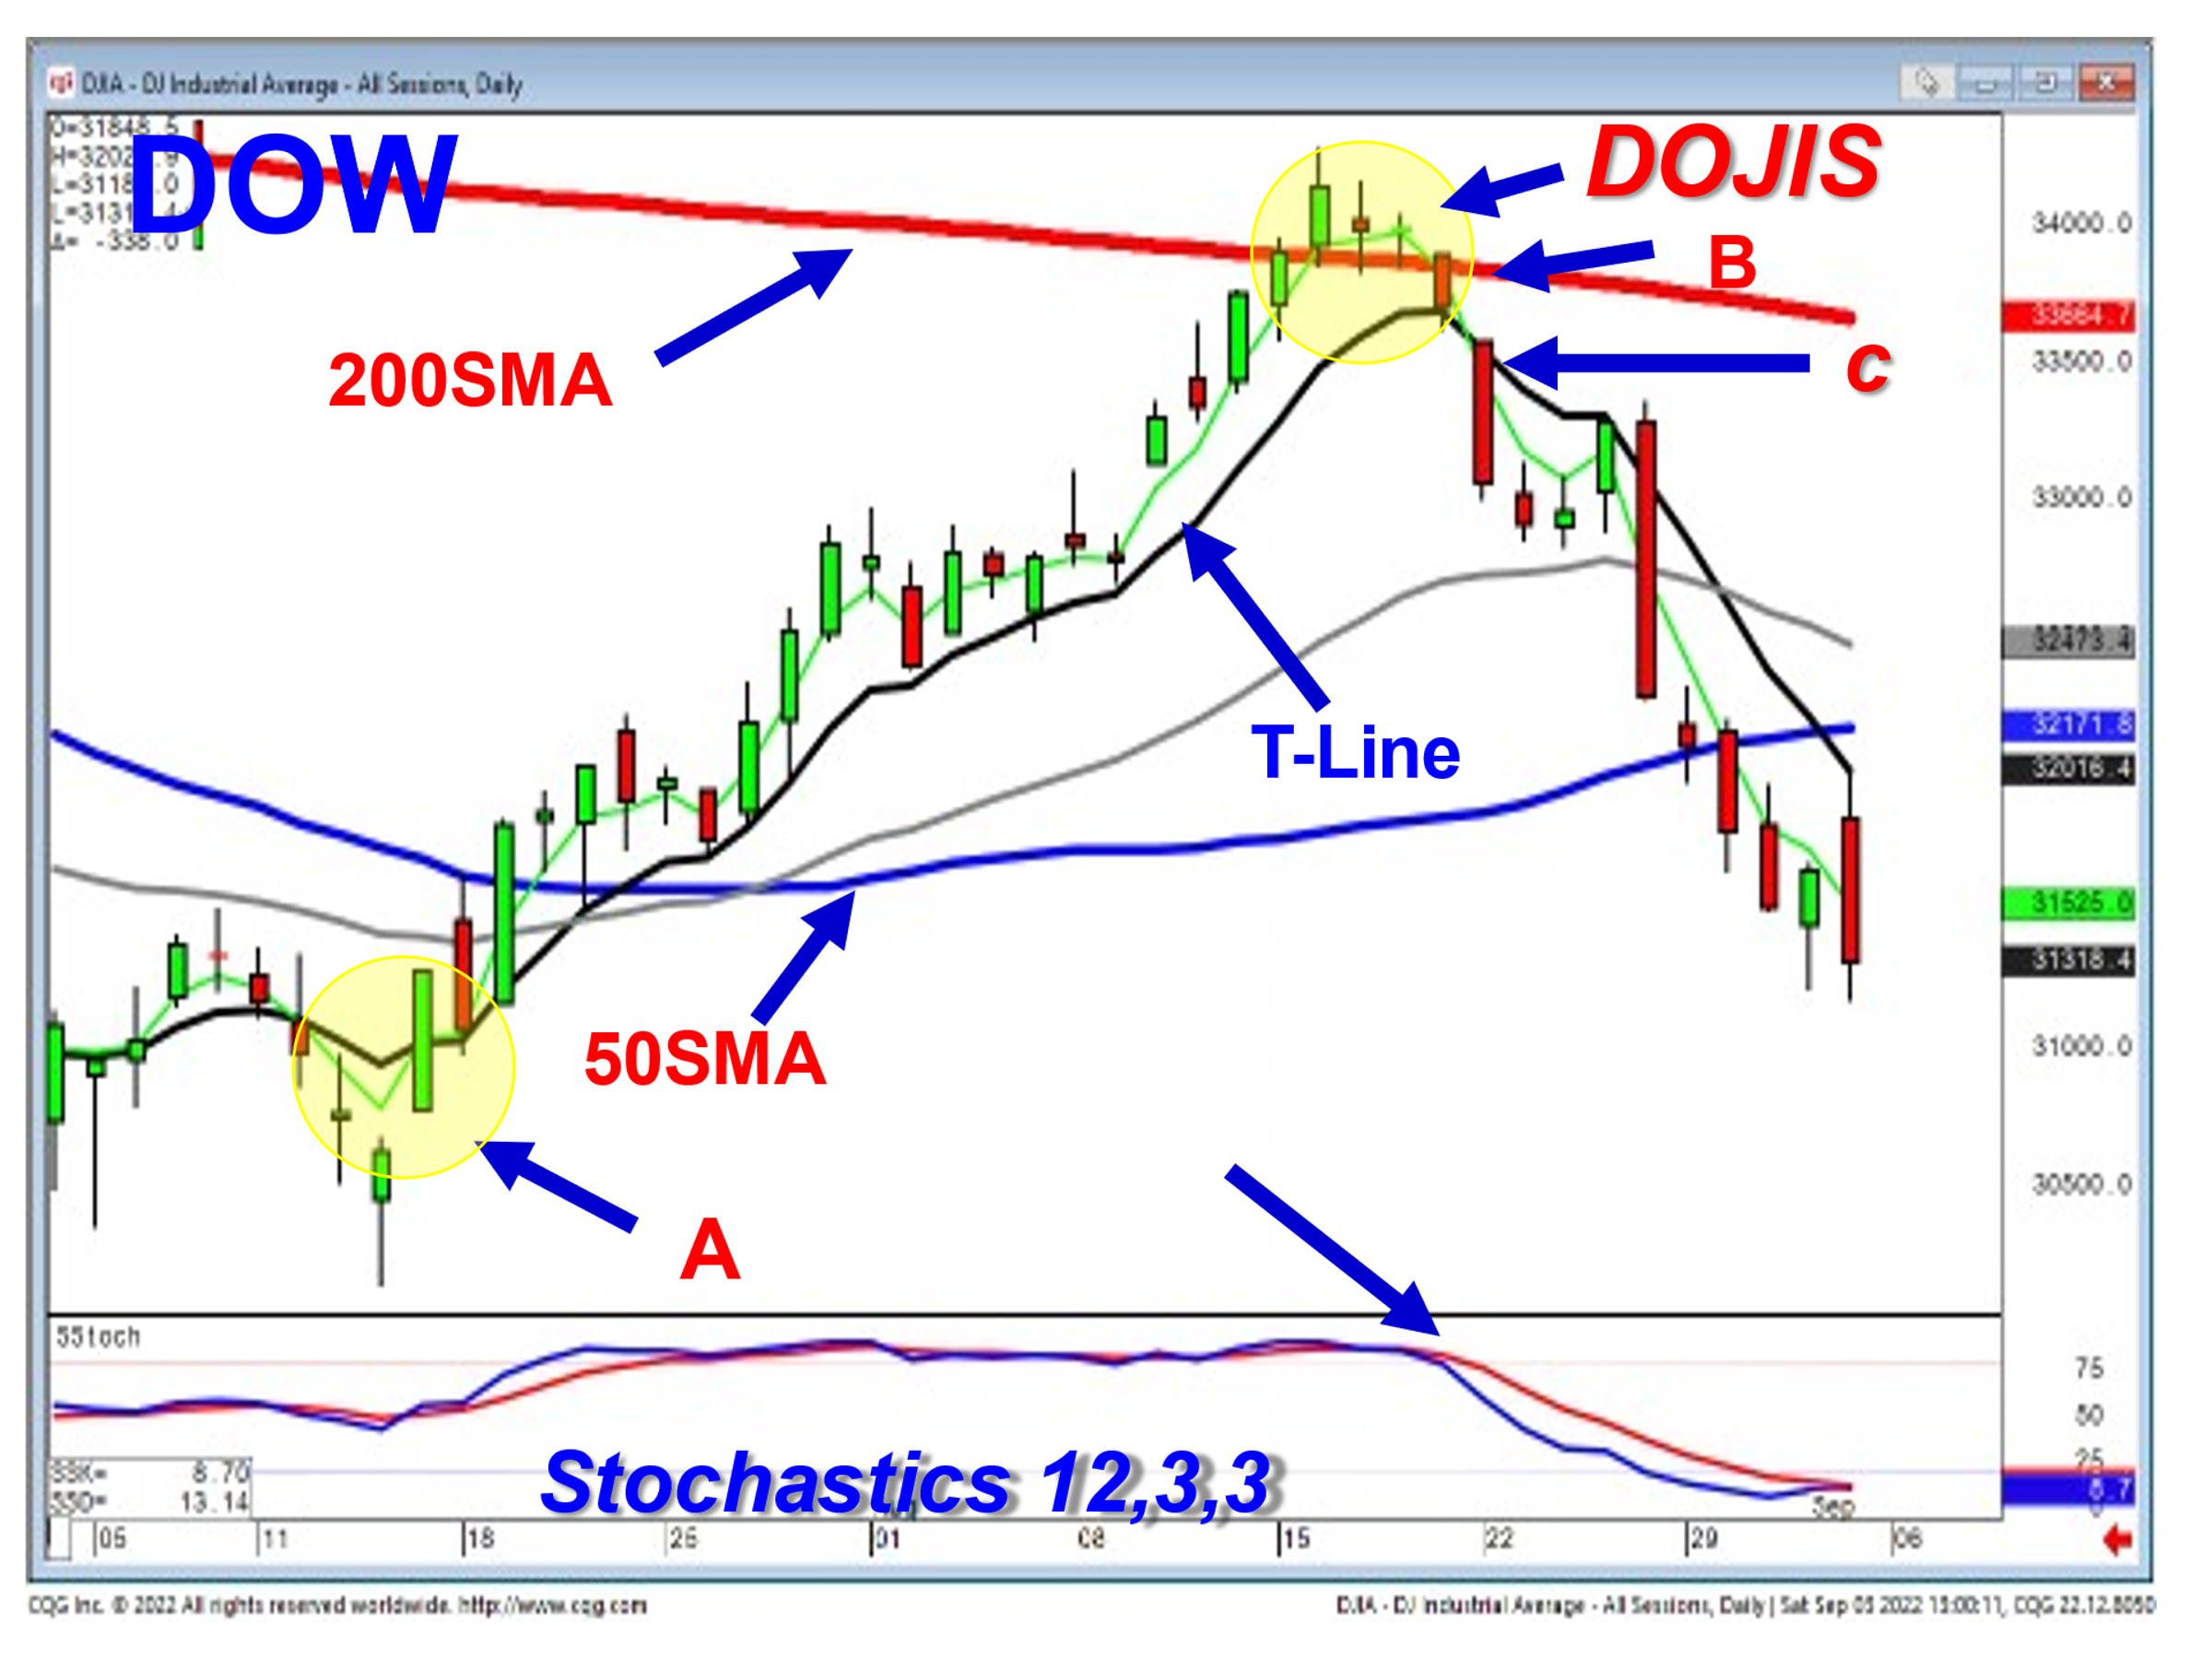
At point "A", identifying candlestick 'buy' signals, with stochastics showing upward trending conditions, would warrant establishing long positions, improving timing.
At point "B", witnessing candlestick sell signals, at the 200-day moving average, produces a strong indication this is where the sellers are taking control, at an obvious observable resistance level. Sell signals (the dojis) at the resistance level, would prepare for getting ready to close long positions. AND a close back below the T line, point C, is a very strong probability factor a downtrend is starting, start establishing short positins.
When the market indexes can be evaluated as being in a bearish mode, the next logical step is to scan for sectors showing the strongest bearish signals. Next, scanning for the strongest bearish signals, in individual stocks of that sector, dramatically puts the probabilities greatly in an investors favor.
A Powerful Confirming Trend Indicator - The T-line
A major advantage, provided by candlestick signals, is the high probability of identifying a change of investor sentiment/price trend. AND the probabilities can be improved by adding indicators that enhance those probabilities. A very powerful trend indicator is the T line. The T line acts as a natural support and resistance level of human nature. Applied in conjunction with candlestick signals and patterns, which are the graphic depiction of investor sentiment, you have one of the most powerful and accurate trend analysis combinations.
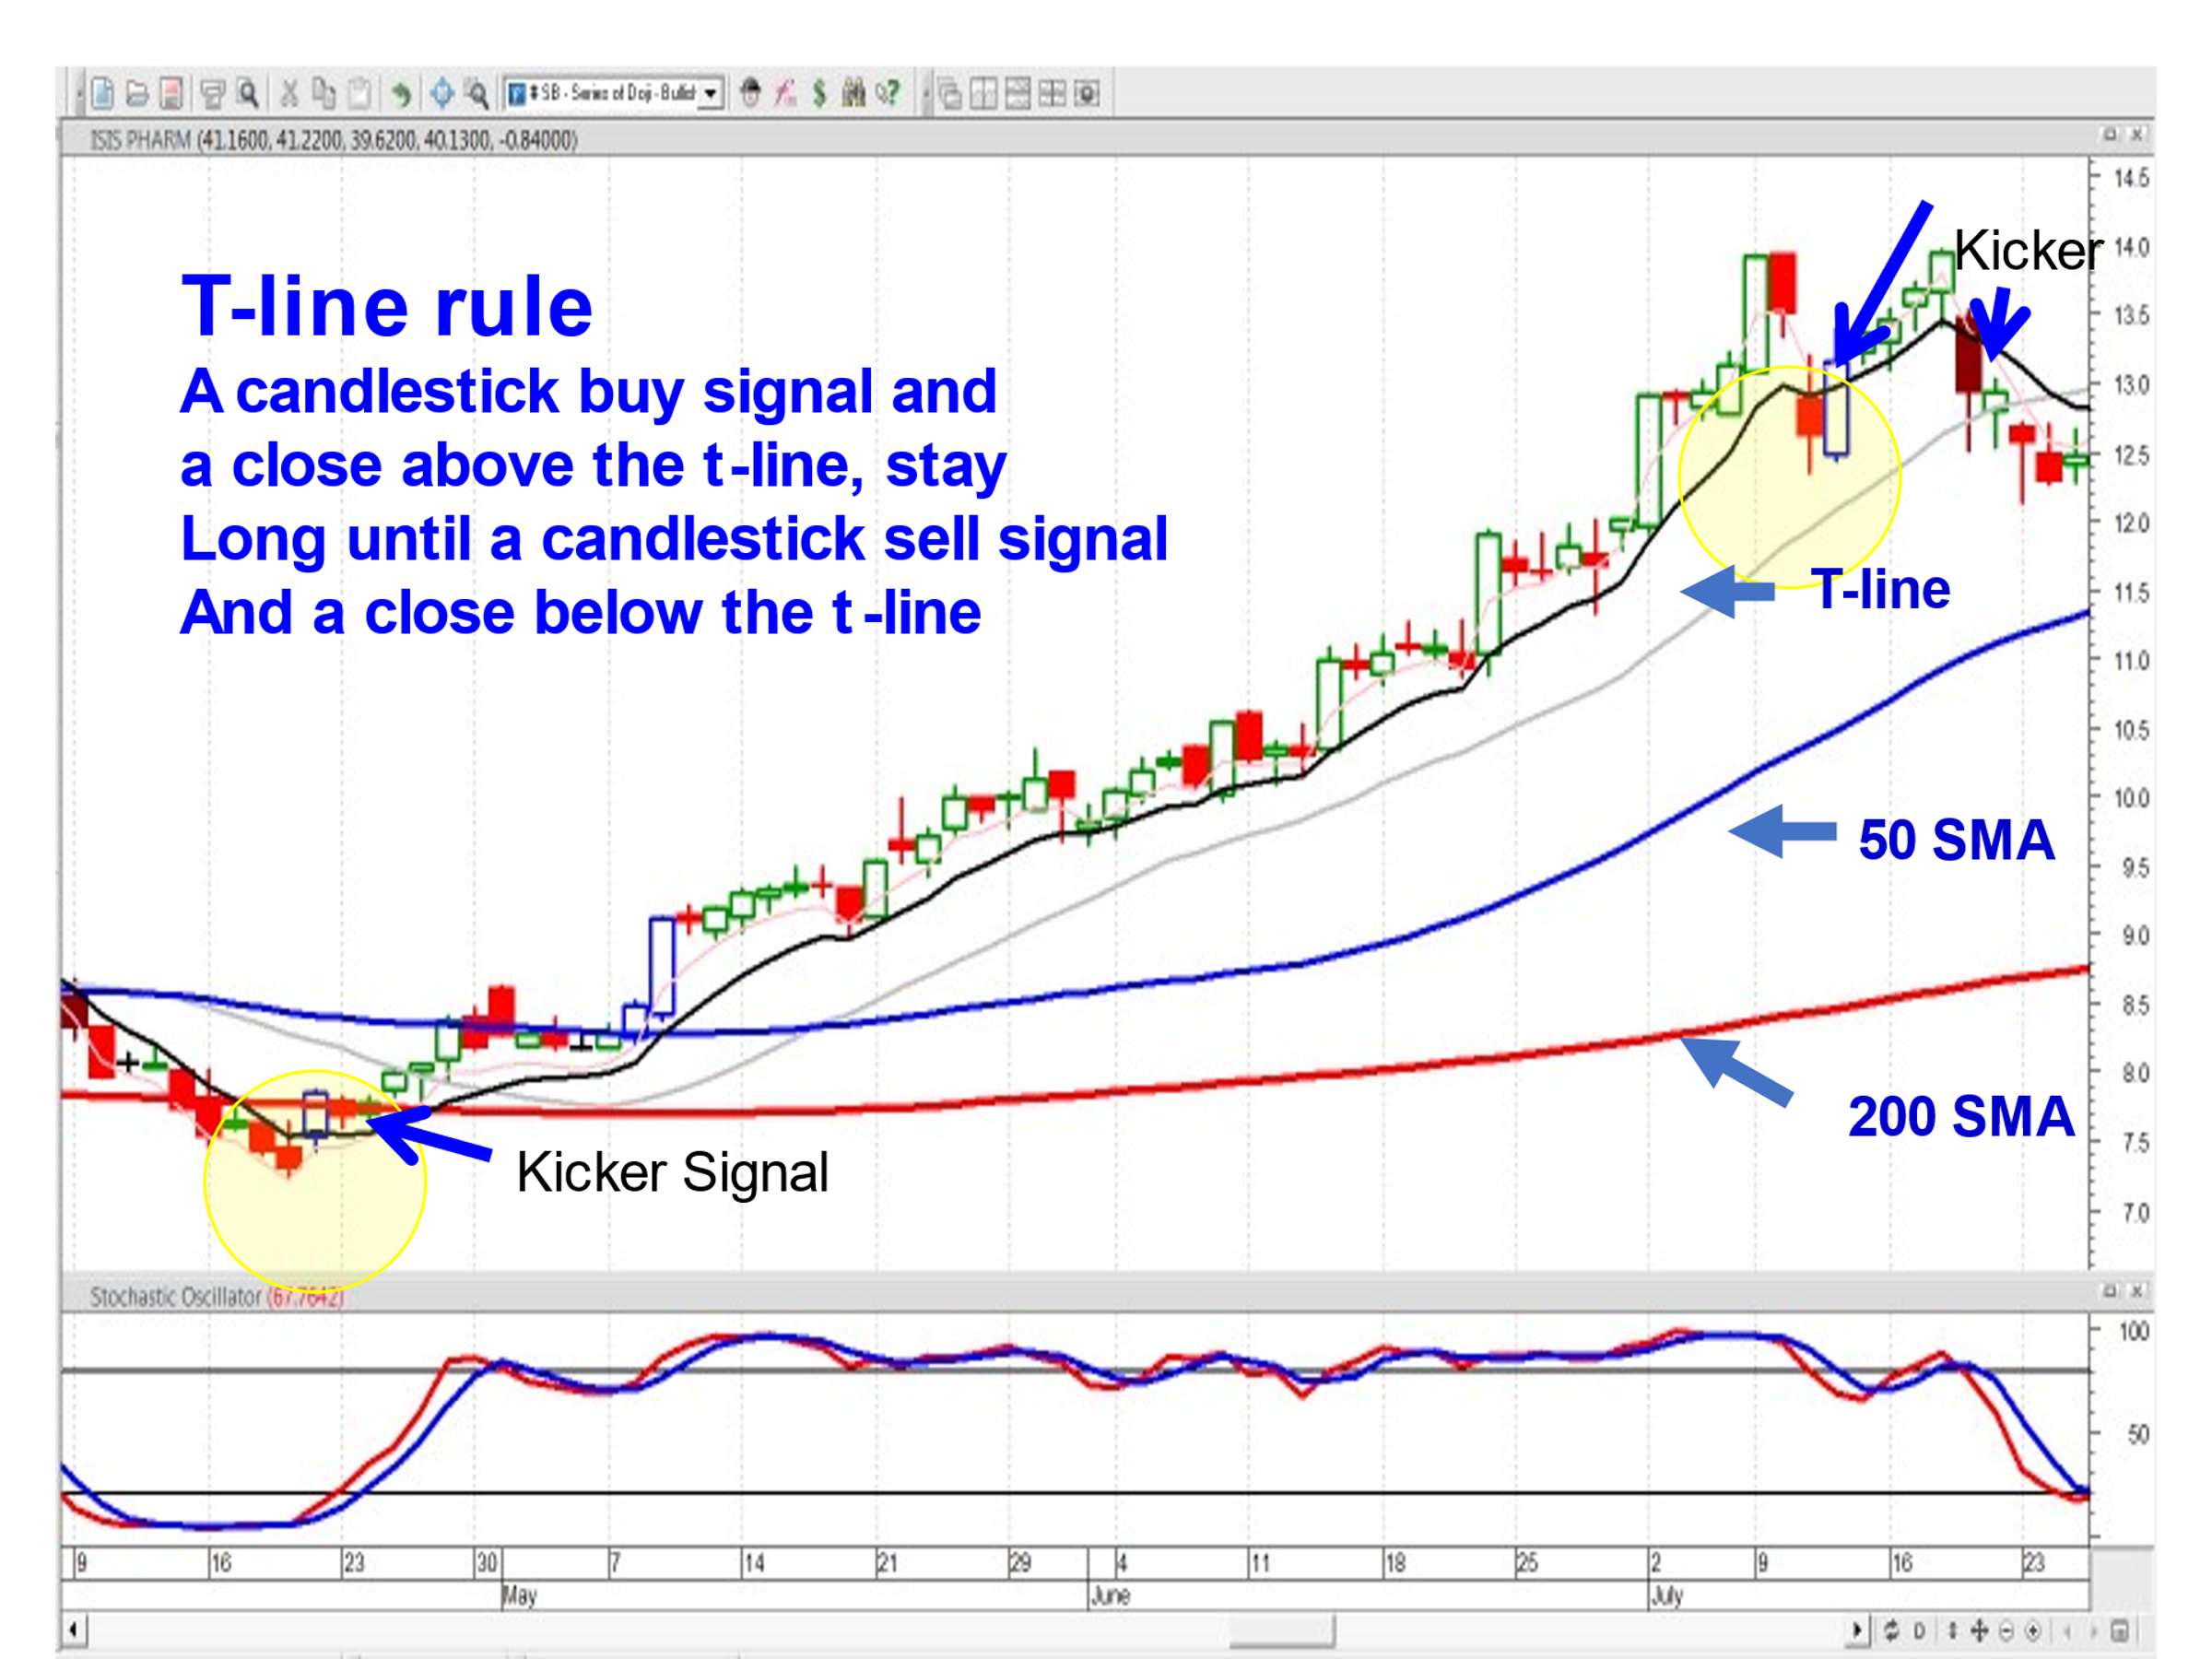
The T line (8EMA) has extremely high probability results. Candlestick logic is applied. If the candlestick signals are the graphic depiction of what is occurring in human nature and the T line acts like a natural support and resistance level of human nature, this combination produces an extremely high probability trend analysis result. Simply stated, if you see a candlestick buy signal and a close above the T line, you can stay long until you see a candlestick sell signal and a close back below the T line. Same analysis on the short side. If you see a candlestick sell signal and a close below the T line, you can stay short until you see a candlestick buy signal and close above the T line.
You can turn your investment perspectives around 180°. Witnessing a candlestick buy signal in the oversold condition is revealing where the smart money is buying. Witnessing a candlestick sell signal in the overbought condition reveals where the smart money is selling. Candlestick charts allow you to participate with the smart money. Doing what the charts reveal takes the emotions out of your trading.
Stephen W. Bigalow owner and operator of www.candlestickforum.com. His 45 years of investment trading, with heavy emphasis on candlestick analysis, provides a learning forum of candlestick analysis. He consults for money managers and hedge fund managers for improving market and positioning timing. Stockbroker: Kidder Peabody, Cowen, Oppenheimer. & Company. He holds a business and economics degree from Cornell University. Published: "Profitable Candlestick Trading", "High Profit Candlestick Patterns", and "Candlestick Profits, Eliminating Emotions".