Candlestick analysis utilizes an indicator that has produced successful results throughout investment history – human nature! Centuries of analysis has revealed extremely high probability results with candlestick signals and patterns.
Candlestick analysis is a price/trend evaluation hybrid, a positive blend recognizing fundamental analysis in conjunction with technical analysis. It has been overlooked as a very informative price trend analysis tool. The presumption is candlestick analysis is purely in the technical analysis category. This misconception is based upon the lack of understanding of how candlestick signals and patterns are created.
Fundamental research is the main influence on investor sentiment. Candlestick chart evaluation is merely the graphic depiction of human nature/investor sentiment.
You do not have to be a sophisticated technical analyst to utilize candlestick signals. It is all visual evaluation. Out of the 50 or 60 candlestick signals, you only need to learn the 12 major signals, six longs and six shorts. The signals are merely commonsense investment perspectives put into a graphic depiction.
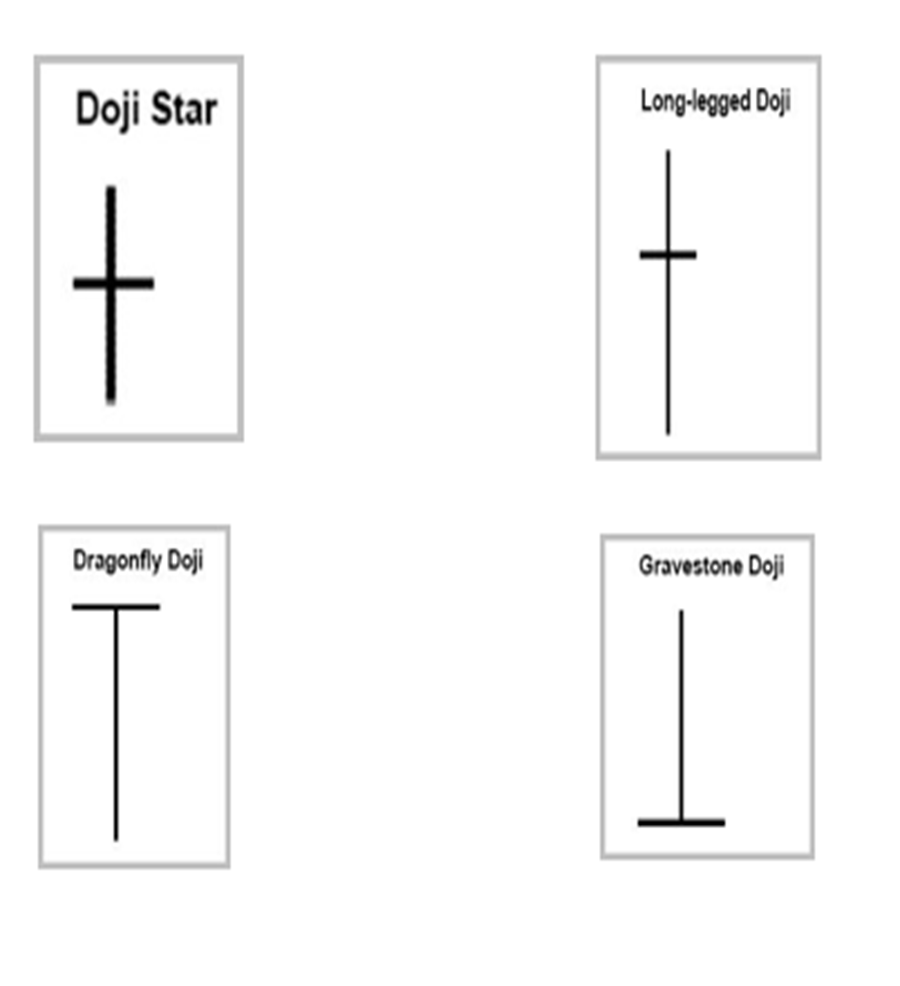
The Doji
The Doji is the most recognized candlestick signal. It also is an extremely high probability trade indicator. The Doji is formed when the open and the close, during any trading time frame, is approximately the same, forming a cross. This illustrates indecision between the bulls and the bears.
The Japanese rice traders provide a simple observation. If you see indecision in a price trend, expect a change of investor sentiment. You can take advantage of the simple rules that apply to a Doji signal. The formation of a Doji signal indicates indecision.
Understanding the investment logic built into candlestick signals/human nature, especially the Doji, provides an investor with a strong competitive edge.
The Doji Rule provides a high expectation result. The Doji rule is very simple. The price/trend will usually move in the direction of how the price opens after a Doji. This rule creates high probability candlestick trade entry set-ups.
Witnessing a Doji at the extreme areas of a trend dramatically improves the probabilities there is a change of investor sentiment coming. Utilizing stochastics or RSI, indicating overbought or oversold conditions, makes a Doji signal more relevant.
Applying the Doji rule not only produces the probabilities that a trend is reversing, but the magnitude of the next price move can be evaluated, allowing an investor to identify the reversal moves that will have the greatest price moves.
Doji at the top
Witnessing a Doji in the overbought condition is a good indication the bulls and the bears have finally reached equilibrium. This provides an alert to be ready to take profits if the price opens lower after the Doji.
The T- line, (the 8 exponential moving average) also enhances the probability of a trend change. Witnessing a Doji, when the price has moved excessively away from the T line, the probability of a reversal occurring is even greater.
Doji at the top

Doji at Bottom
A Doji, appearing in the oversold condition, provides an alert to start watching for a change of investor sentiment. Bullish confirmation is required, otherwise, the Japanese rice traders say the weight of the market could continue to push prices lower.
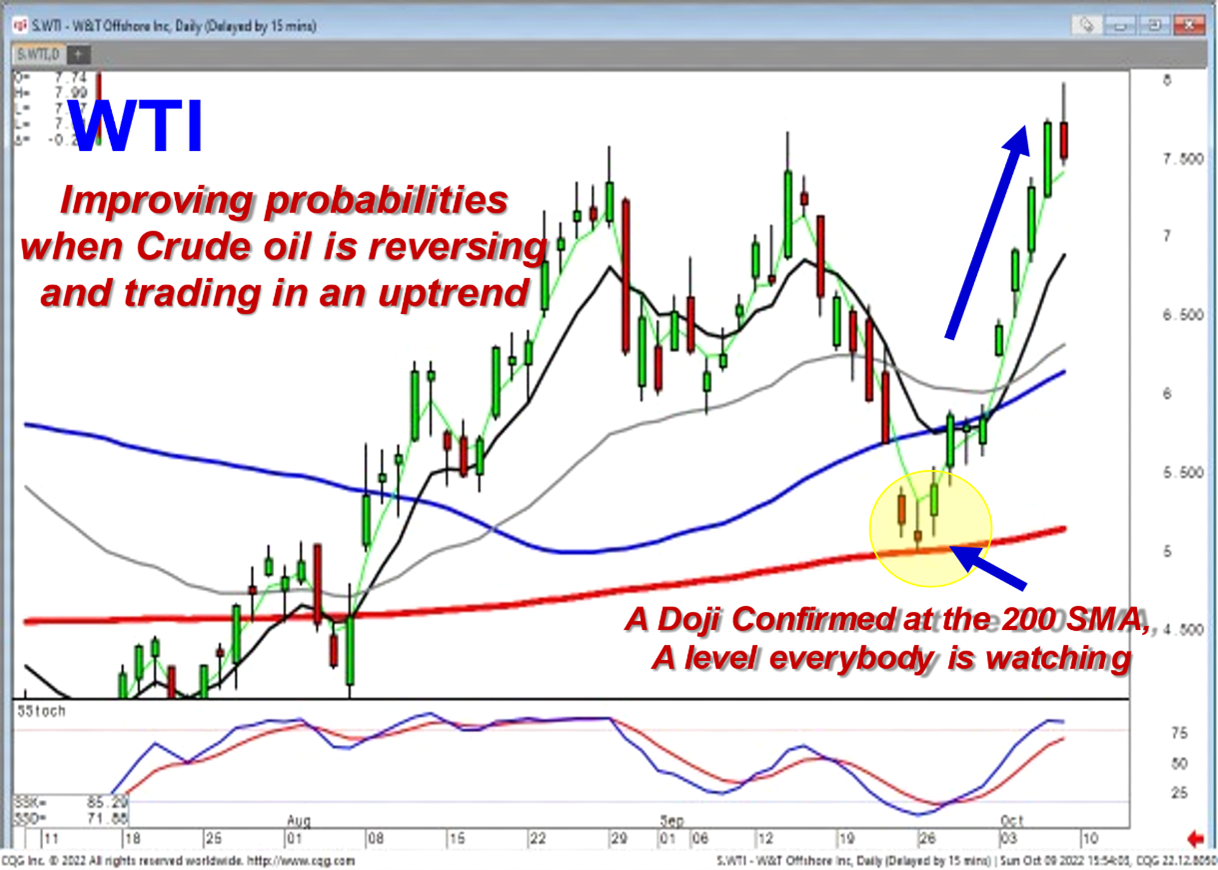
The utilization of the Doji rule not only produces a high probability that a reversal is about to occur but the magnitude strength of the new trend can be easily evaluated. As illustrated in the WTI chart, the probabilities of a price trend reversal are greatly enhanced when witnessing a candlestick signal forming right on a technical level that everybody else is watching. The Doji forming at the 200-day moving average is confirmed based upon the positive open after the Doji. Additionally, knowing this reversal occurred at the same time crude oil prices started trading back in an uptrend greatly also improves the probabilities of being in a correct direction of a price move.
Knowing strong reversals can be identified, based upon how prices move after a Doji, there are a number high powered signals identified by the Doji; The Best Friend signal, the Left/Right combo, the Flutter Kicker, the Doji Sandwich, a McMuffin pattern, and a series of Doji’s. This puts the candlestick investor in a position to analyze which trades are going to produce the biggest potential profits.
Best Friend Signal
The Best Friend signal is appropriately named. Not only does it create an high probability a new trend is beginning, it also indicates a strong price move is about to occur. The Best Friend signal is created with a Doji followed by a gap in price. It works equally well for bullish and bearish trades. The analysis of this signal is easy to understand. After a day of indecision, the new decision is very clear, investors want to buy or sell position with great enthusiasm. This is exactly where investors should be participating in a price move, just as the new investor sentiment is starting.
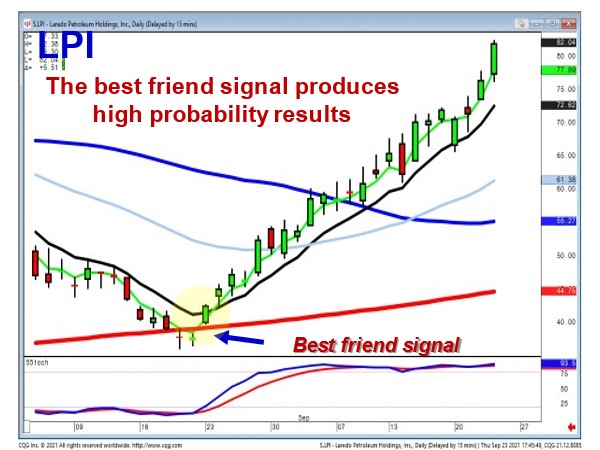
Candlestick analysis uses simple rules that dramatically improve the probabilities of being in a correct trade. Note on the LPI chart, the bullish Best Friend signal illustrated a strong reversal in investor sentiment.
Additionally, the T line rule was in effect. The T line rule merely states that if you see a candlestick buy signal and a close above the T line, the probabilities of an uptrend confirming is extremely strong. From that point, the T line rule states that you can stay in the uptrend as long as you do not see a candlestick sell signal and a close below the T line. That combination in the LPI chart created very strong probabilities, not only had an uptrend started, but the strength of the uptrend was going to be strong.
The strength illustrated by a bearish Best Friend signal allows for evaluating the direction and strength of a potential down move. As illustrated in theAMZN chart, the downtrend shows high probabilities of continuing based upon the strength of a bearish best friend signal, gapping below the T line, and stochastics heading lower, reveals high probabilities the downtrend remains in progress.

Flutter Kicker signal
A Bullish Flutter Kicker signal is an extremely strong signal. It is formed when a downtrend exhibits a bearish/dark candle. The next day the price gaps up above the previous day’s open but trades indecisively, a Doji day. Again, the Doji rule comes into play. If the following day opens positive after the Doji, the Doji rule states the price will move in the direction of how they open after the Doji. If it begins forming a bullish candle, it can be bought immediately.
The term Flutter Kicker signal is a Kicker signal with the Doji, the flutter, in between the bearish candle and then a bullish candle moving in the opposite direction. If you take out the Doji, the flutter, you have a Bullish Kicker signal. This works in the bearish direction also.

Bearish Flutter Kicker Signal
The Bearish Flutter Kicker signal indicates a strong bearish move is likely. As demonstrated in the DOCU chart, the gap down below the previous day’s open and forming a Doji type day was the alert, indicated the bearish downtrend continuation was likely. The confirmation was the lower trading the following day.

Series of Doji’s
Candlestick analysis is merely commonsense logic put into a graphic depiction. The definition of a Doji is indecision between the bulls and the bears. If one Doji means indecision, a series of Doji’s means greater indecision.
This creates a high probability trade factor. The trend is usually going to move based upon the next signal after a series of Dojis. If the series of Doji’s is occurring in the oversold area, there is a strong likelihood the next signal will be bullish. The same scenario can be applied to a series of Doji’s in the overbought condition. A bearish signal is going to be a strong indication the downtrend has started. The longer the indecisive trading, the more powerful the next trend will likely be.

As illustrated in the INBX chart, the lengthy indecisive series of Doji’s eventually revealed the new trend with a bullish signal confirmation. The magnitude of the new trend will usually be excessively strong.
Enhanced trading with the Doji
The Doji has powerful implications. It represents indecision between the bulls and the bears. The result of the indecision is clearly illustrated with Doji related signals.
If you want to dramatically improve your profitability, being in trades that have much higher degree of accuracy, you can utilize the information built into a Doji signal. You do not have to be a sophisticated technical analyst. The candlestick investor merely needs to identify and understand the reoccurring results of human nature.
The Doji, with its ‘cross’ type formation, is one of the easiest candlestick signals to recognize. The Doji rule produces extremely high probability results. Take advantage of the information built into a Doji signal. Knowing what to expect when a Doji is identified allows investors to greatly improve their trend analysis abilities.
Stephen W. Bigalow owner of www.candlestickforum.com. His 45 years of investment trading, with heavy emphasis on candlestick analysis, provides a learning forum of candlestick analysis. He consults for money managers and hedge fund managers for improving market and positioning timing. Stockbroker: Kidder Peabody, Cowen, Oppenheimer. & Company. He holds a business and economics degree from Cornell University. Published: “Profitable Candlestick Trading”, “High Profit Candlestick Patterns”, and “Candlestick Profits, Eliminating Emotions”.